3083
Diffusion MRI for the detection of hippocampal abnormalities in temporal lobe epilepsy1Medical Biophysics, Western University, London, ON, Canada, 2Centre for Functional and Metabolic Mapping, Robarts Research Institute, London, ON, Canada, 3Psychology, Western University, London, ON, Canada, 4Epilepsy Program, Schulich School of Medicine and Dentistry, Western University, London, ON, Canada, 5Neuroepidemiology Unit, Schulich School of Medicine and Dentistry, Western University, London, ON, Canada
Synopsis
Keywords: Epilepsy, Epilepsy, Microscopic anisotropy, Hippocampus
Motivation: Surgical outcomes for patients with temporal lobe epilepsy (TLE) are limited by the lack of imaging biomarkers that are sensitive to abnormalities.
Goal(s): Our goal was to assess the sensitivity of diffusion MRI metrics to hippocampal abnormalities in patients with TLE.
Approach: We measured mean diffusivity and microscopic fractional anisotropy in a specific hippocampal subfield in TLE patients and healthy volunteers, then used logistic regression to classify cohorts.
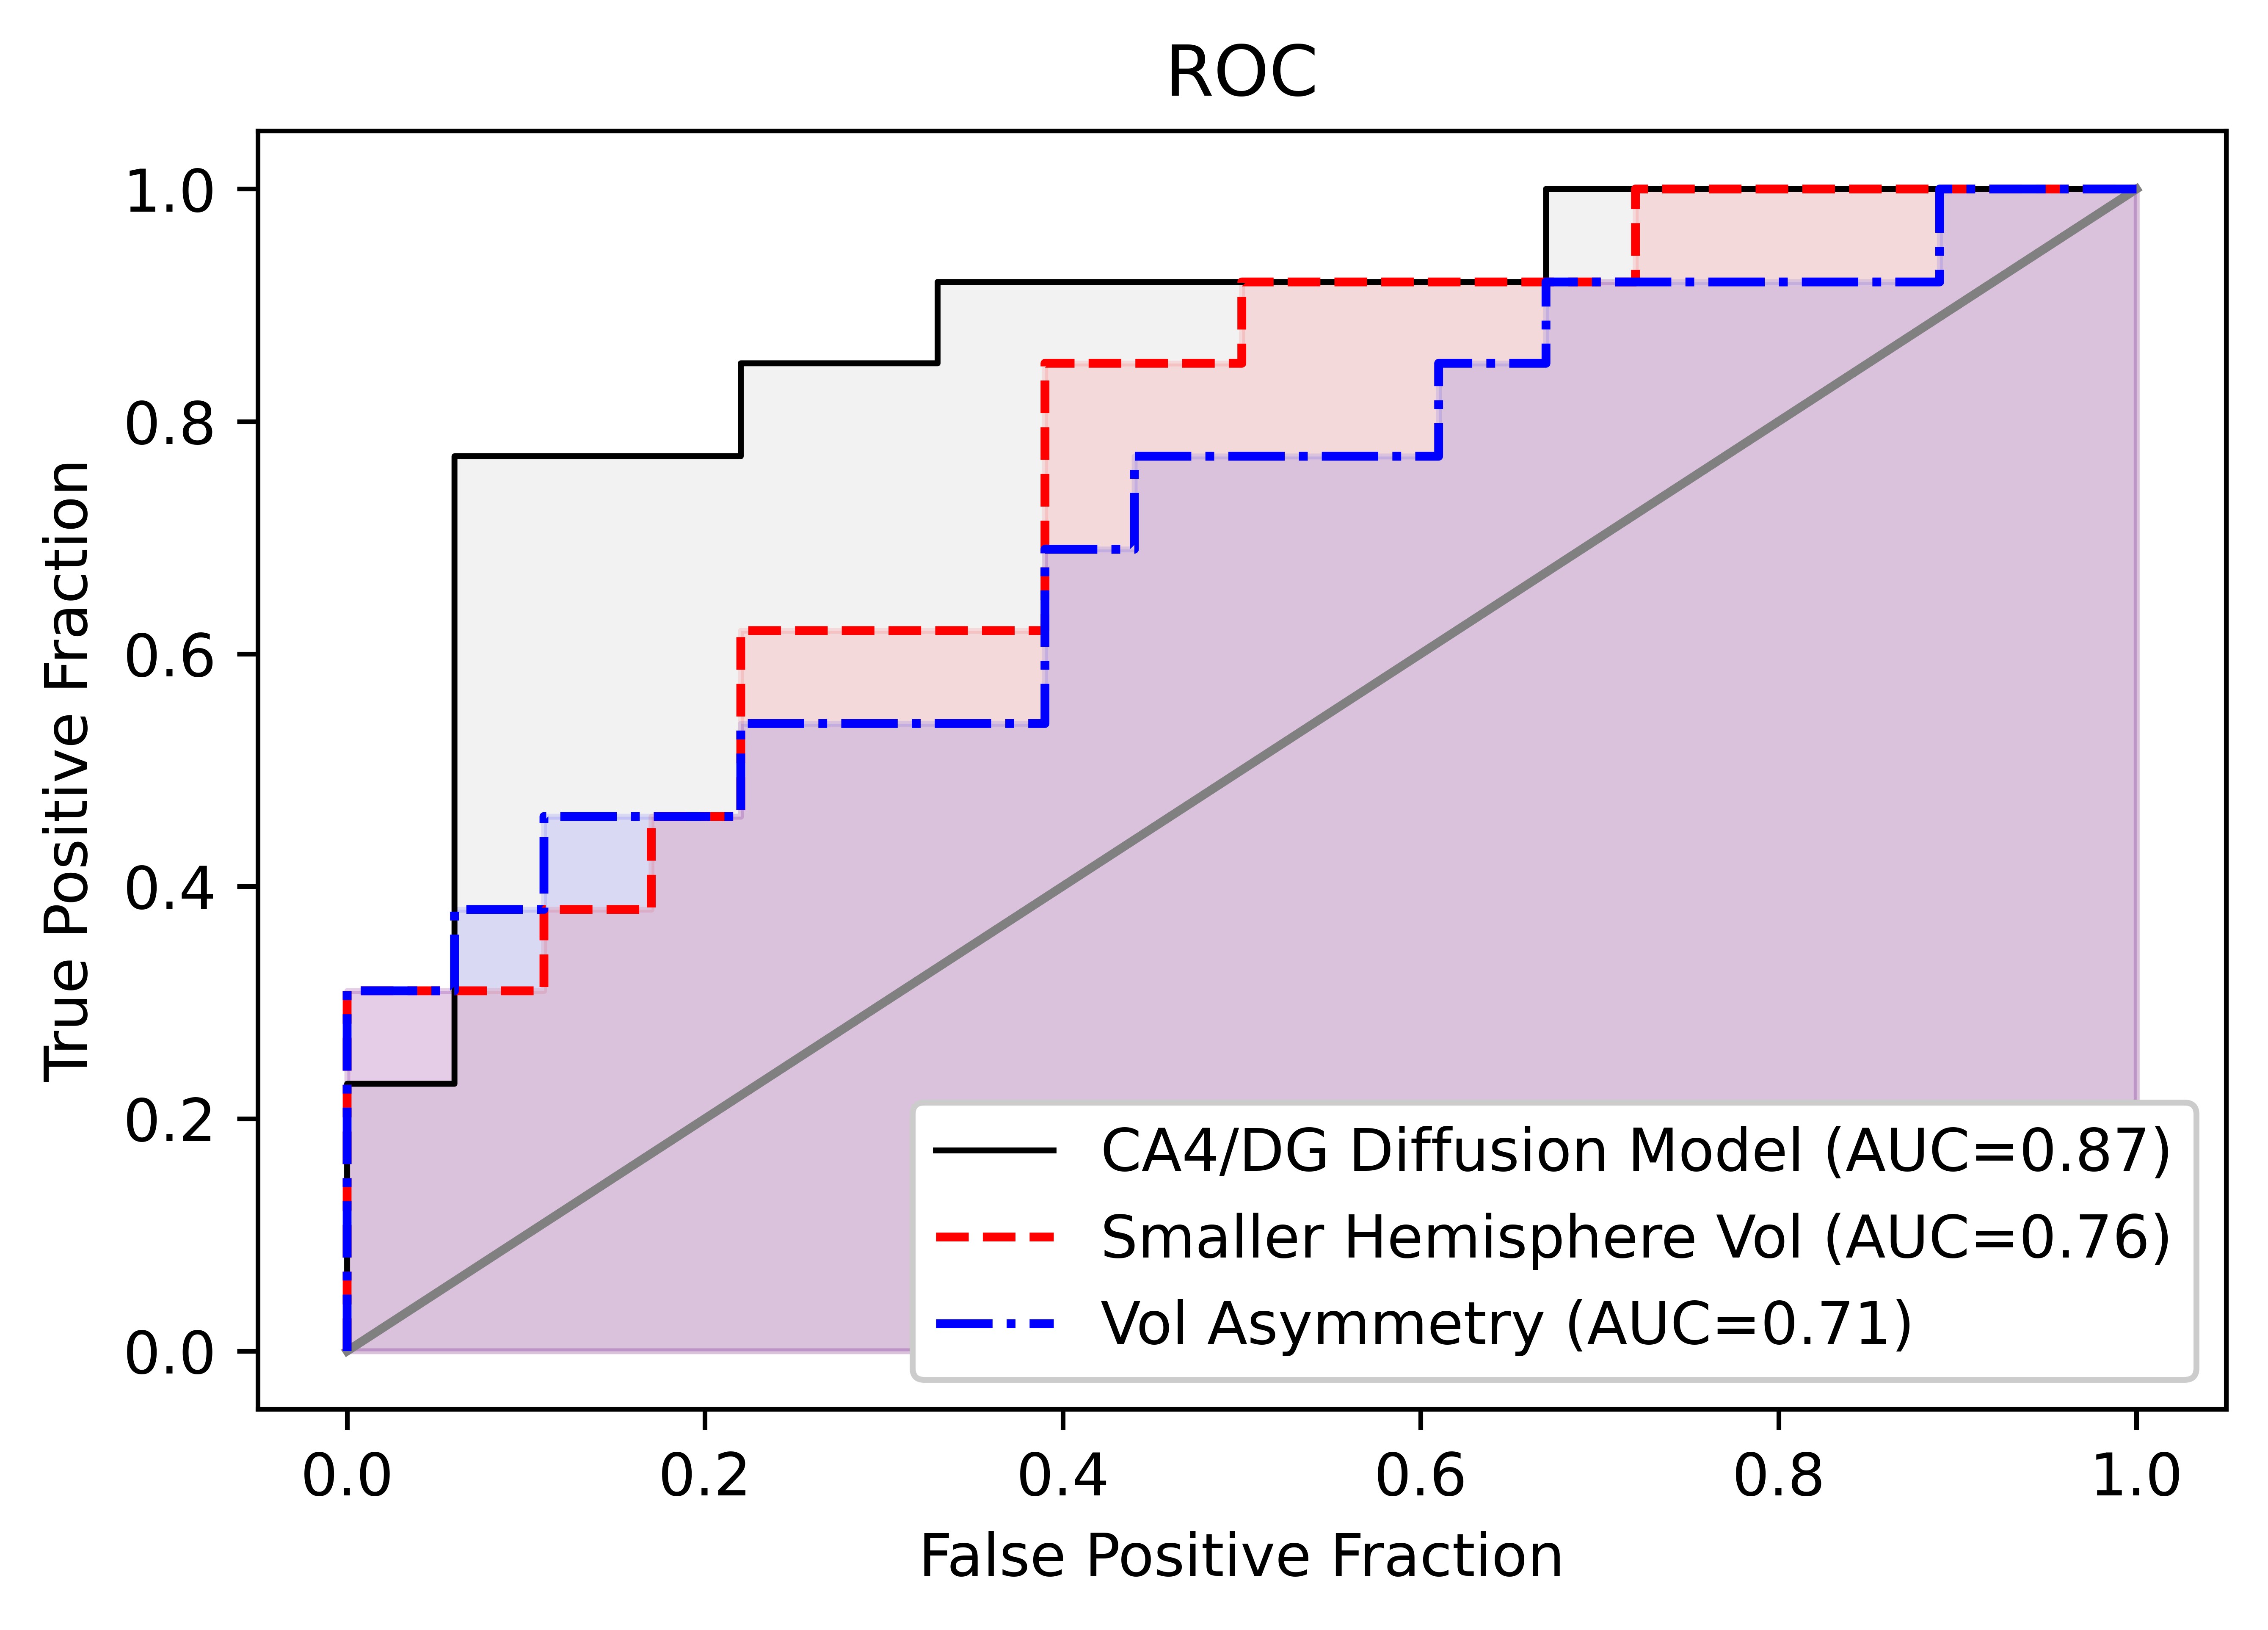
Results: The diffusion model was better at distinguishing between patients and volunteers than typical measurements of hippocampal volume, assessed using receiver operating characteristic curves (area under curve 0.87 vs. 0.71-0.76).
Impact: Advanced diffusion MRI metrics are sensitive to hippocampal abnormalities in temporal lobe epilepsy and may be able to improve surgical outcomes by helping clinicians locate the seizure focus for surgical excision.
Introduction
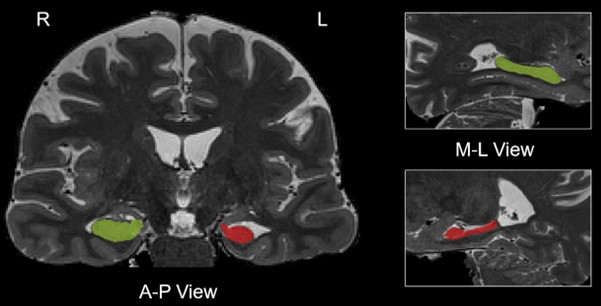
Temporal lobe epilepsy is a disease characterized by recurring seizures that originate in the temporal lobe. While surgery is the optimal treatment for some patients with drug-resistant TLE, surgical outcomes are better for patients with visible MRI abnormalities than MRI-negative patients (75% vs 51% achieve seizure freedom 1), highlighting the need for improved imaging techniques to locate abnormalities that may indicate the seizure focus. A common MRI-visible abnormality in TLE patients is hippocampal sclerosis, which typically presents as a reduction in hippocampal volume in one or both hemispheres 2 (Fig.1), but previous studies have demonstrated that diffusion MRI (dMRI) metrics are also sensitive to hippocampal abnormalities in TLE 3–5, particularly in the cornu ammonis 4 (CA4) and dentate gyrus (DG) subregions.Here, we measured mean diffusivity (MD) and microscopic fractional anisotropy (μFA) in the combined CA4/DG hippocampal subfield in healthy volunteers and TLE patients. We tested for significant differences between the cohorts and compared the ability of dMRI metrics to distinguish between TLE and healthy controls (HC) against those of hippocampus volume measurements.
Methods
13 patients with TLE (9 unilateral TLE and 4 bilateral TLE as determined using electroencephalography (EEG)) and 18 healthy volunteers were scanned at 3T using T2-weighted, DTI, and μFA imaging protocols with informed consent and appropriate Research Ethics Board approval. The T2 scan had 0.8x0.8x0.8mm resolution and TE/TR=564/3200ms. The DTI scan had 1.6x1.6x1.6mm resolution, TE/TR=99/5500ms, and consisted of 6 and 36 linear tensor encoded (LTE) diffusion-weighted volumes at b-values of 0 and 1000s/mm2. The μFA protocol had 1.8x1.8x1.8mm resolution, TE/TR=92/4900ms, and consisted of 8 LTE scans at b=2000s/mm2 and 3, 6, and 16 spherical tensor encoded scans at b=100, 1000, and 2000s/mm2.A deep-learning surface-based unfolding pipeline (Hippunfold 6) was used to segment each person’s hippocampus to isolate two regions-of-interest in T2-space: the full hippocampus (comprised of the full cornu ammonis, DG, and subiculum) and the CA4/DG subfield. The left and right hippocampal volumes were measured from the T2 image sets. μFA was estimated by fitting the μFA protocol data using linear regression 7,8, while MD was estimated by fitting the DTI data to the diffusion tensor representation. Mean μFA and mean MD were calculated for the left and right sides of the CA4/DG region, separately. To compare metrics between control and TLE cohorts, only one hemisphere was examined for each subject to eliminate any confounding effects of the contralateral side in unilateral patients: for volume and μFA, the hemisphere with a lower mean was considered, while for MD, the hemisphere with a greater mean was considered.
To assess the ability of dMRI to differentiate TLE patients and healthy volunteers, logistic regression was performed using the mean μFA from the hemisphere with lower μFA, and the mean MD from the hemisphere with higher MD. Receiver operating characteristic (ROC) curves were plotted for the dMRI logistic regression model, as well as hippocampal volume (in the hemisphere with lower volume), and hippocampal volume asymmetry, defined as the absolute percentage difference between left and right hippocampal volume.
Results
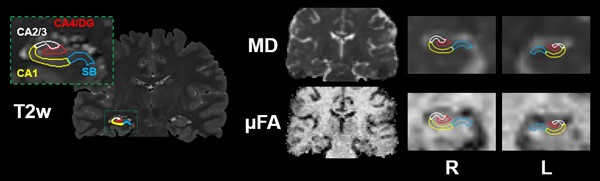
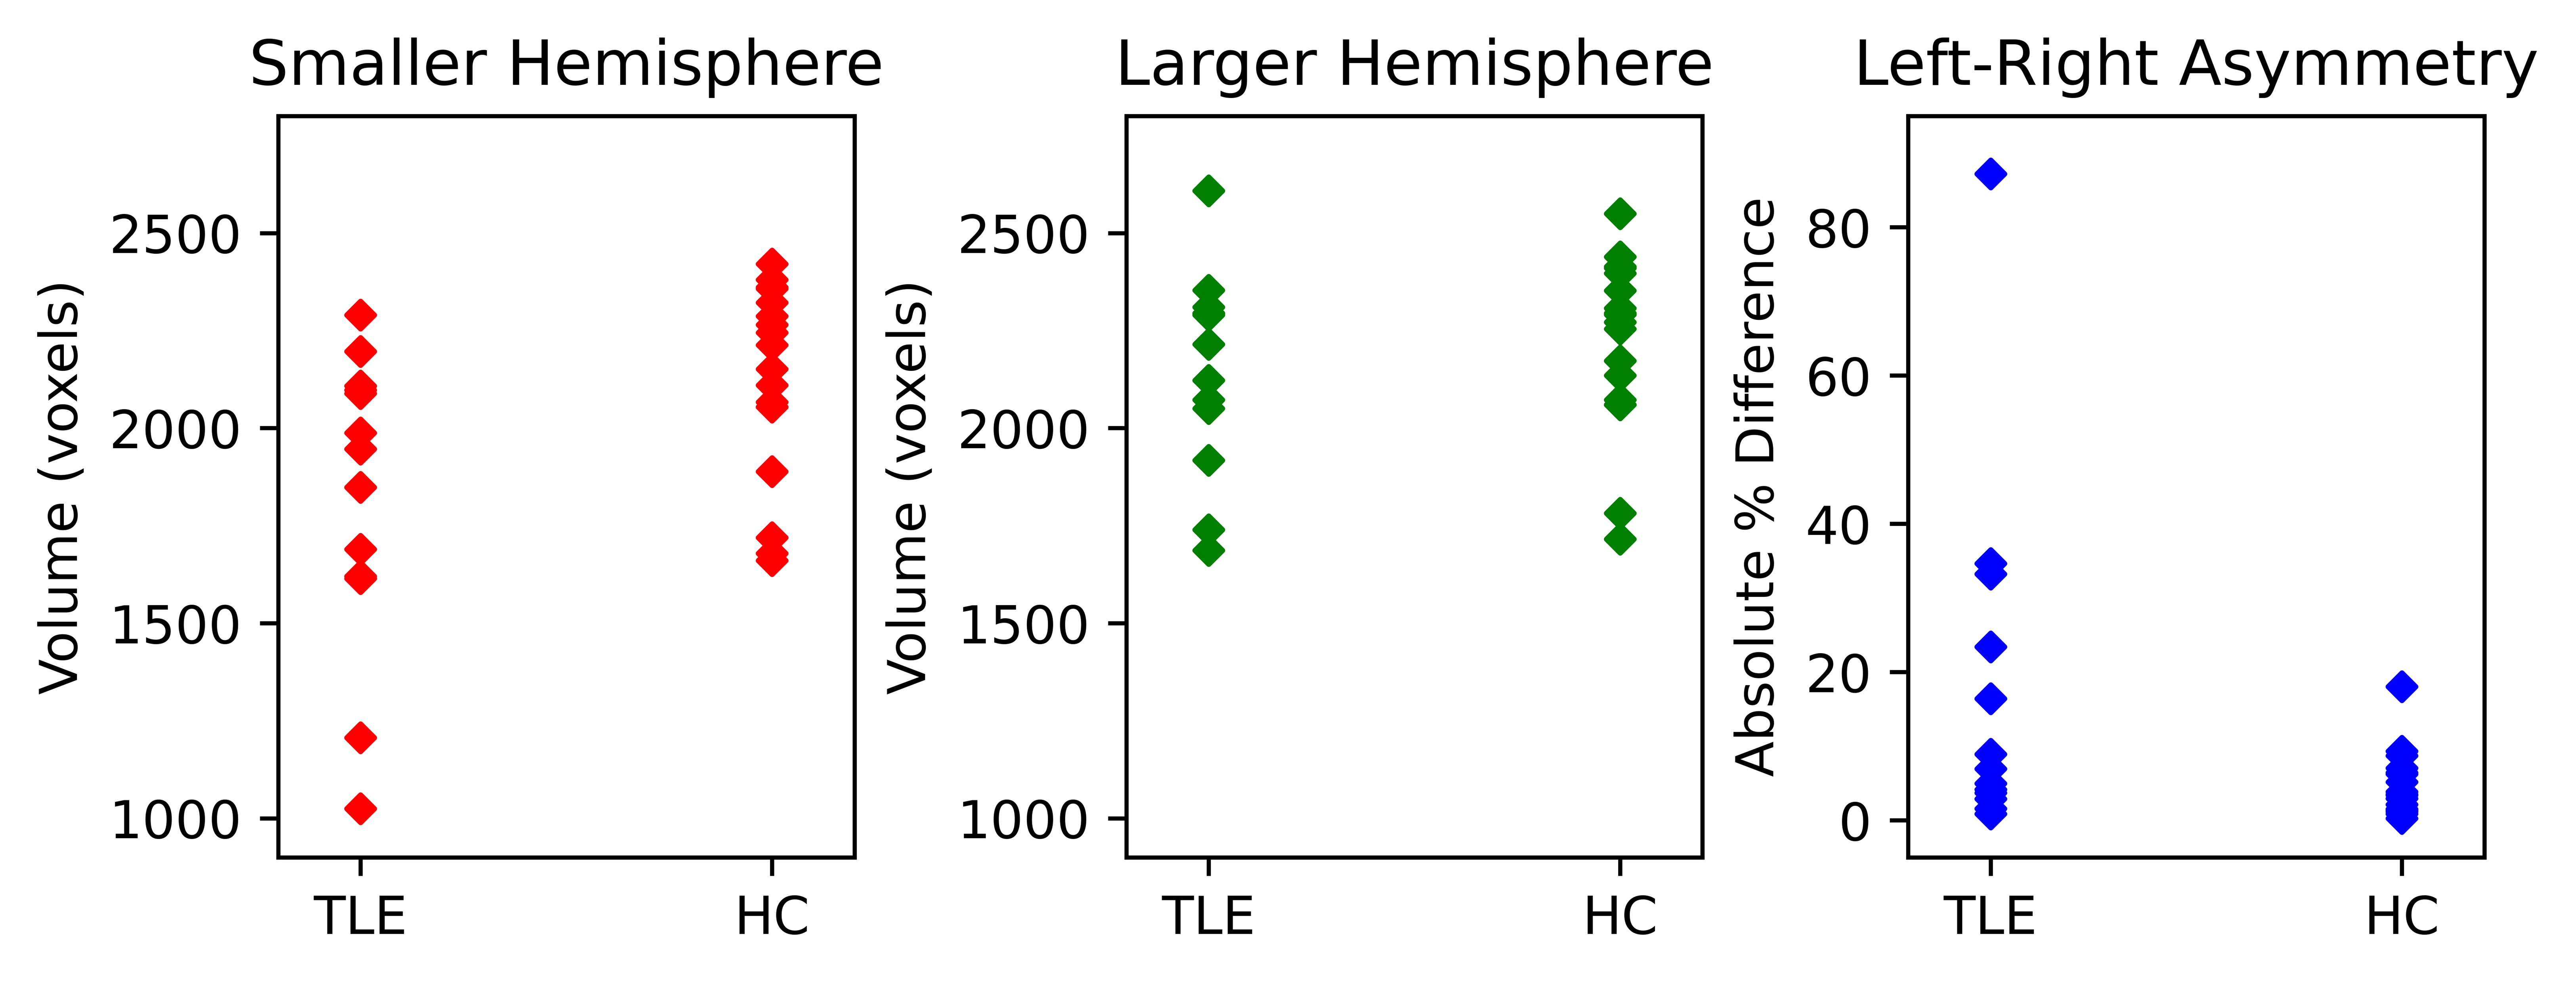
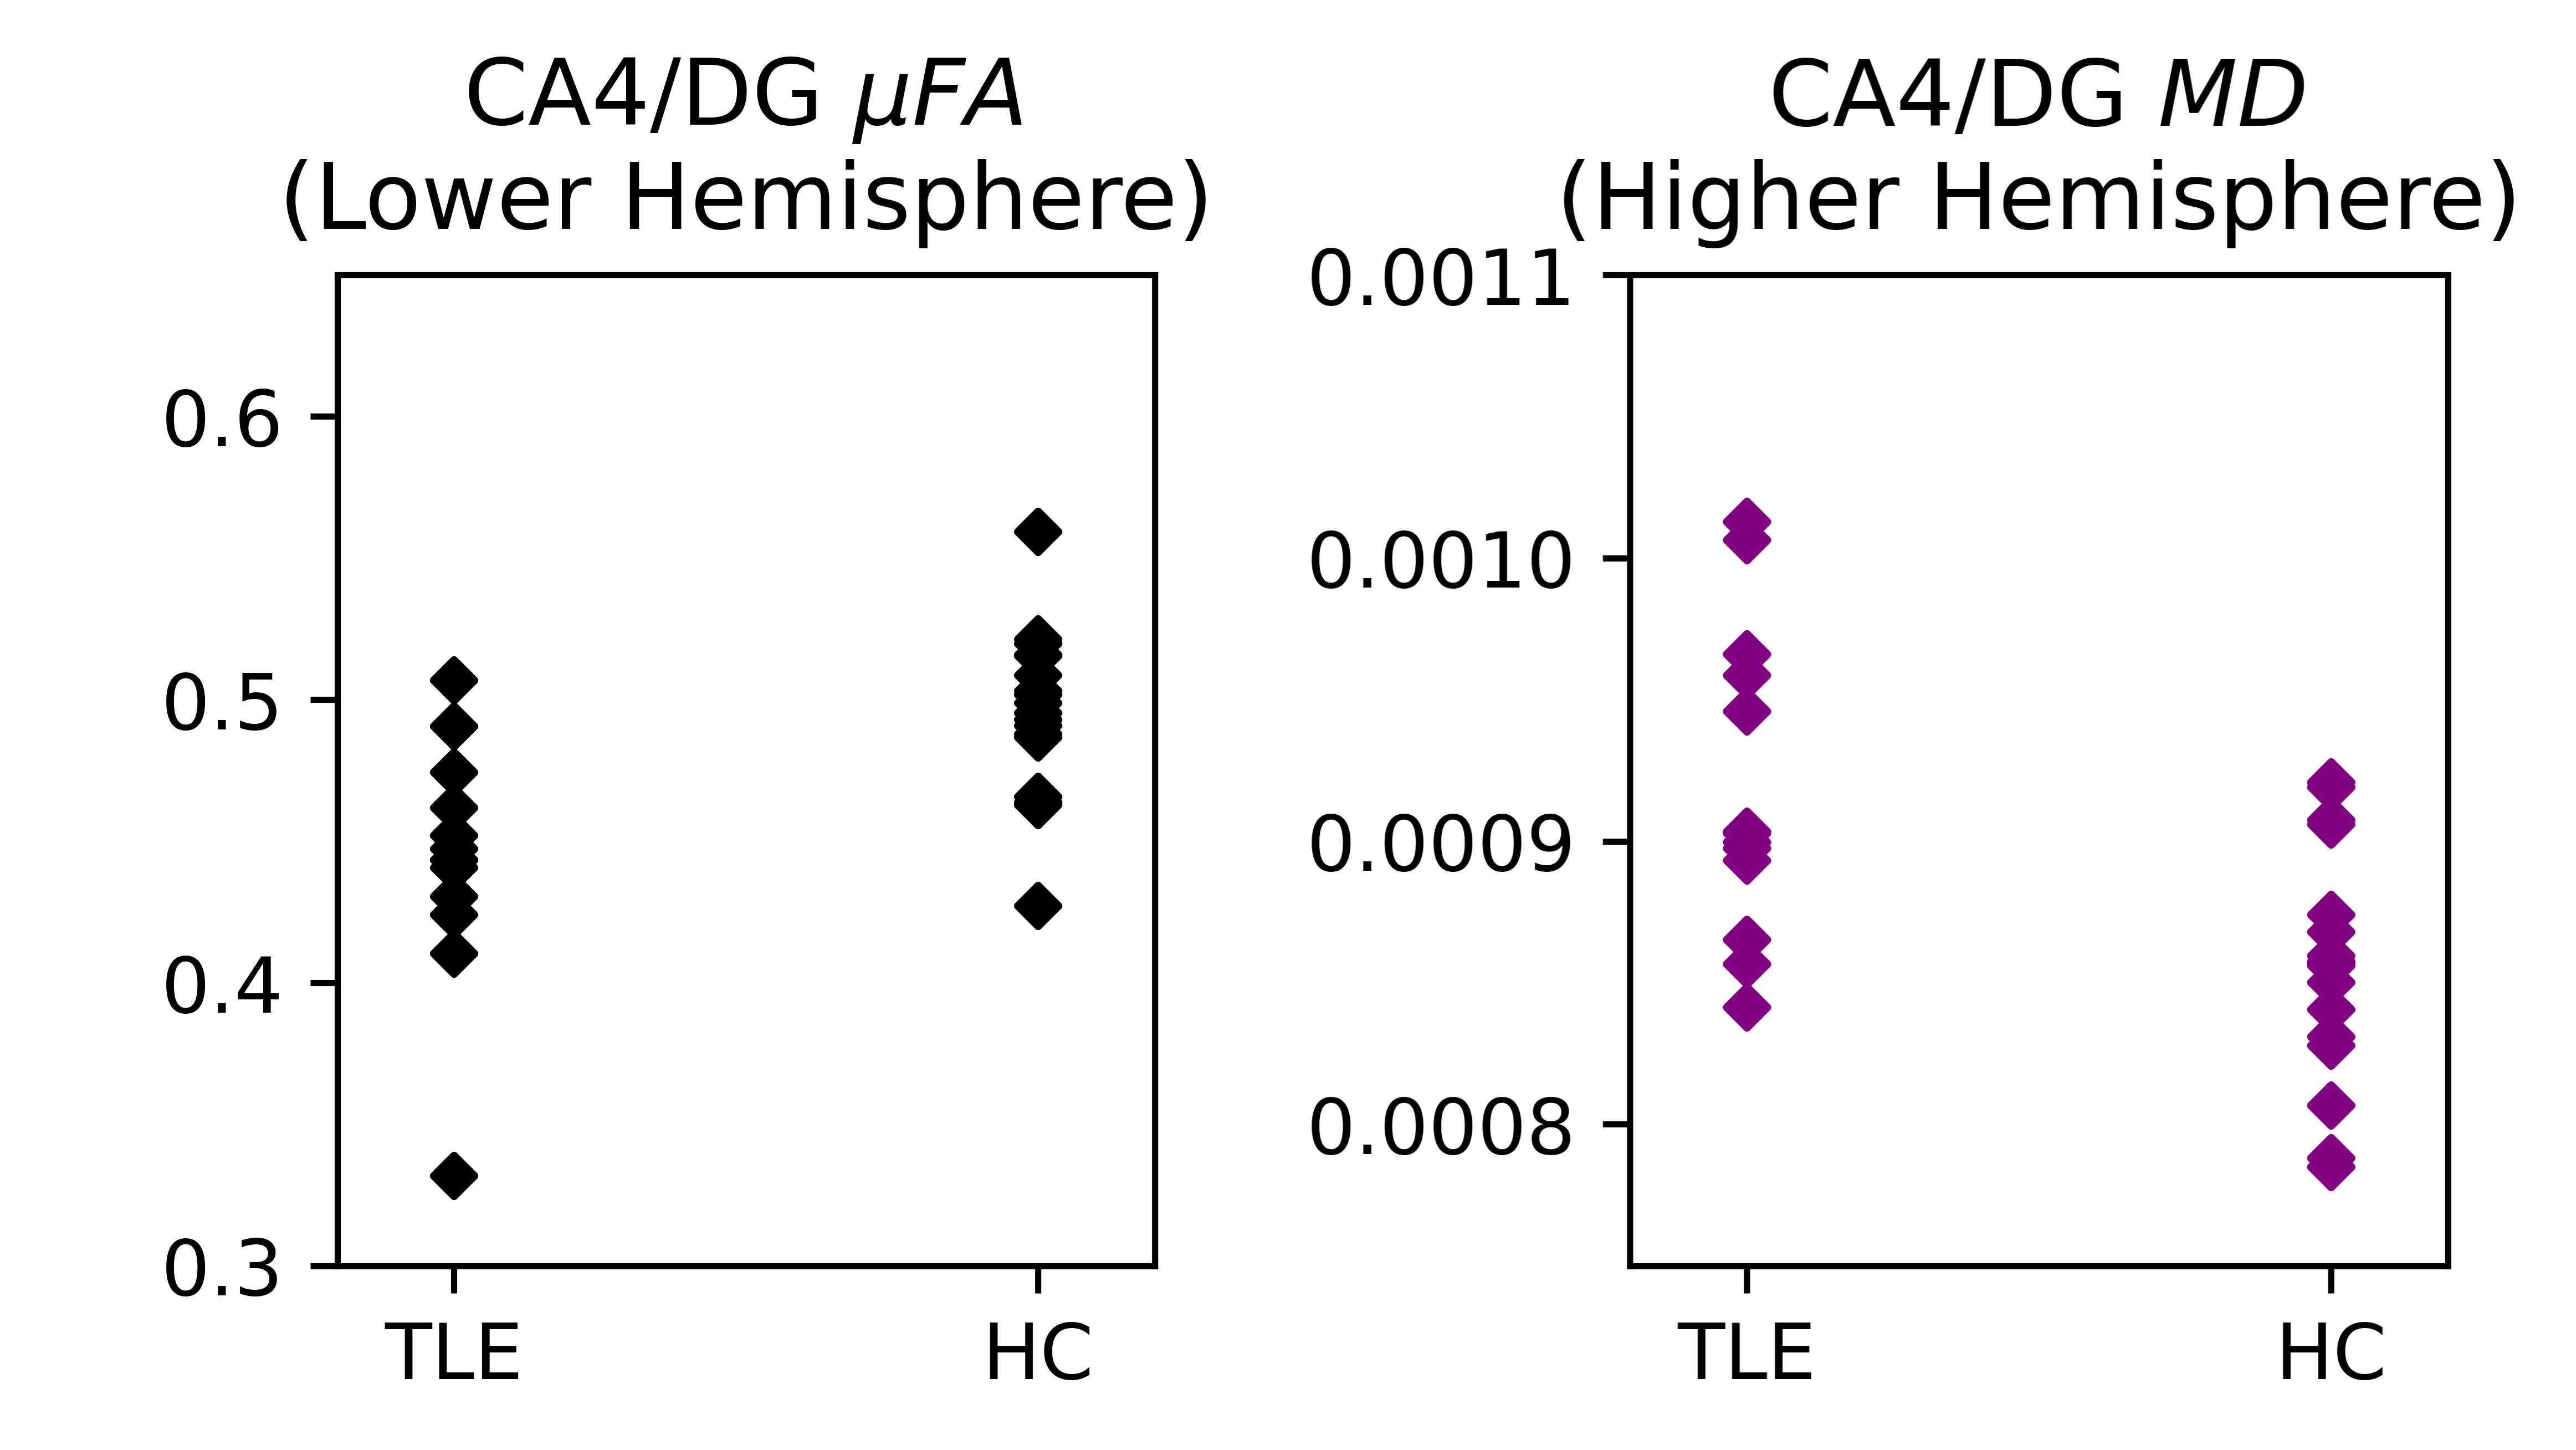
Example T2, MD, and μFA images are depicted in Fig. 2 with several subfields highlighted. No significant differences were observed between TLE and HC cohorts for measurements of the smaller hemisphere volume, larger hemisphere volume, or volume asymmetry between the two sides of the hippocampus (Fig. 3). However, μFA was significantly lower and MD was significantly greater in the TLE group than the HCs, for the relevant hemispheres in the CA4/DG subregion (Fig. 4). For 13/13 TLE patients and 10/18 volunteers, the same hemisphere had both lower μFA and higher MD. ROC analysis revealed that the logistic regression model using CA4/DG MD and μFA measurements was better at distinguishing TLE patients from HCs (area under curve (AUC): 0.87) than the volume of the smaller hippocampus hemisphere (AUC: 0.76) or hippocampal volume asymmetry (AUC: 0.71) (Fig. 5).Discussion
It is unsurprising that hippocampal volume measurements did not distinguish between cohorts because there is significant variation in both hippocampal size and left-right asymmetry between individuals 9. In contrast, diffusion metrics reflect neural microstructure and could indicate disease-specific abnormalities such as neuronal atrophy and demyelination. The limited resolution of dMRI makes measurements of the hippocampus susceptible to partial volume effects from neighbouring tissue or cerebrospinal fluid, but this is mitigated by focusing on the CA4/DG subregion located at the centre of the hippocampus (Fig. 2).Conclusion
dMRI may complement the current imaging and EEG techniques used to localize the epileptic focus in patients with TLE, potentially improving surgical outcomes for patients with unilateral drug-resistant disease.Acknowledgements
This work was supported by the Canada Research Chairs Program (CB, AK), Canada First Research Excellence Fund to BrainsCAN, a Natural Sciences and Engineering Research Council (NSERC) Discovery grant (IJ), a Canadian Institutes of Health Research (CIHR) project grant (AK), a CIHR operating grant (IJ), and the NSERC Canada Graduate Scholarship Doctoral (CGS-D) program (NA).
Dr. Jorge Burneo is the Jack Cowin Chair in Epilepsy Research at Western University.
References
1. Muhlhofer, W., Tan, Y.-L., Mueller, S. G. & Knowlton, R. MRI-negative temporal lobe epilepsy-What do we know? Epilepsia 58, 727–742 (2017).
2. Chabardès, S. et al. The temporopolar cortex plays a pivotal role in temporal lobe seizures. Brain 128, 1818–1831 (2005).
3. Goubran, M. et al. In vivo MRI signatures of hippocampal subfield pathology in intractable epilepsy. Hum. Brain Mapp. 37, 1103–1119 (2016).
4. Chau Loo Kung, G. et al. High-resolution hippocampal diffusion tensor imaging of mesial temporal sclerosis in refractory epilepsy. Epilepsia 63, 2301–2311 (2022).
5. Arezza, N. J. J. et al. Microscopic fractional anisotropy asymmetry in unilateral temporal lobe epilepsy. medRxiv (2023) doi:10.1101/2023.05.10.23289785.
6. DeKraker, J. et al. Automated hippocampal unfolding for morphometry and subfield segmentation with HippUnfold. Elife 11, (2022).
7. Lasič, S., Szczepankiewicz, F., Eriksson, S., Nilsson, M. & Topgaard, D. Microanisotropy imaging: quantification of microscopic diffusion anisotropy and orientational order parameter by diffusion MRI with magic-angle spinning of the q-vector. Frontiers in Physics 2, (2014).
8. Arezza, N. J. J., Tse, D. H. Y. & Baron, C. A. Rapid microscopic fractional anisotropy imaging via an optimized linear regression formulation. Magn. Reson. Imaging 80, 132–143 (2021).
9. Woolard, A. A. & Heckers, S. Anatomical and functional correlates of human hippocampal volume asymmetry. Psychiatry Res. 201, 48–53 (2012).
Figures