3082
Alterations of functional and structural coupling in patients with autism spectrum disorders1Department of Medical Imaging, Zhengzhou University People’s Hospital & Henan Provincial People’s Ho, Zhengzhou, China, 2Xinxiang Medical University & Henan Provincial People’s Hospital, Xinxiang, China, 3Department of Rehabilitation Medicine, Zhengzhou University People’s Hospital & Henan Provincial People’s Hospital, Zhengzhou, China, 4MR Research Collaboration, Siemens Healthineers Ltd, Beijing, China, 5Biomedical Research Institute,Henan Academy of Sciences, Zhengzhou, China
Synopsis
Keywords: Psychiatric Disorders, fMRI (resting state)
Motivation: The abnormal brain areas in autism spectrum disorder (ASD) patients detected by resting-state functional MRI (RS-fMRI) and 3D-T1 MRI alone are not completely consistent.
Goal(s): To explore the structural and functional coupling change in ASD patients.
Approach: Correlation analyses were conducted between structural and functional measures of the abnormal brain area in ASD and compared with healthy controls.
Results: ASD patients not only had abnormal function in the thalamus and superior frontal gyrus, but also showed the reverse trend of correlation between the gray matter volume and functional indicators compared with healthy controls.
Impact: The abnormal function and reverse trend of correlation between the gray matter volume and functional indicators in the thalamus and superior frontal gyrus compared with healthy controls might provide new perspective for deeply understanding neural mechanisms in autism spectrum disorder.
INTRODUCTION
Autism spectrum disorder (ASD) is a neurodevelopmental condition with various causes and an unclear pathogenesis. Multimodal MRI techniques, including resting-state functional MRI (rs-fMRI) and 3D-T1 weighted high-resolution structural MRI (3D-T1) have been widely to explore the neural abnormality of ASD. Using rs-fMRI, previous studies have found that ASD patients show lower amplitude of low-frequency fluctuation (ALFF) values in the left parietal cortex, anterior cuneus, and right insula, reduced regional homogeneity (ReHo) values in the left middle temporal gyrus, left angular gyrus [1]. Based on 3D-T1 MRI, some studies [2] revealed that ASD patients have elevated gray matter volumes (GMV) in the midbrain, pons and occipital lobe.Although these findings may help increase our understanding about ASD, the abnormal brain areas detected by rs-fMRI and structural MRI alone are not completely consistent, preventing us from deeply understanding the structural basis of local functional changes. Moreover, one of the major challenges in neuroscience is to understand the structural substrates of functional neural activities in human brain. One study [3] have demonstrated that the middle frontal gyrus and insula of healthy subjects showed positive correlation of GMV-ALFF. Zhao et al [4] also found that the correlation between GMV and ALFF in posterior cingulate gyrus in aMCI patients was opposed to healthy controls. Thus, we hypothesized that exploring the correlation between structural and functional measures in abnormal brain area of ASD patients will provide us new insights to understand the neural changes in ASD.METHODS
This study included 61 ASD patients and 40 healthy controls (HCs) from community hospitals. rs-fMRI and 3D-T1 images were used for analysis. The DPABI software (http://rfmri.org/DPABI) was used to preprocess the rs-fMRI data. The structural image was processed using VBM8 in SPM software [https://www.fil.ion.ucl.ac.uk/spm/software/spm12/]. ALFF map, ReHo map and GMV map were normalized to MNI space for analysis. Two-sample t-test was used for analyzing brain indexes differences between ASD group and HC group. To further determine the changes in the relationship between brain function and structure in abnormal brain area of ASD patients, we extracted the functional indicators and GMV values of the abnormal brain area in ASD group and HC group, and conducted correlation analysis between GMV values and functional indicators.RESULTS
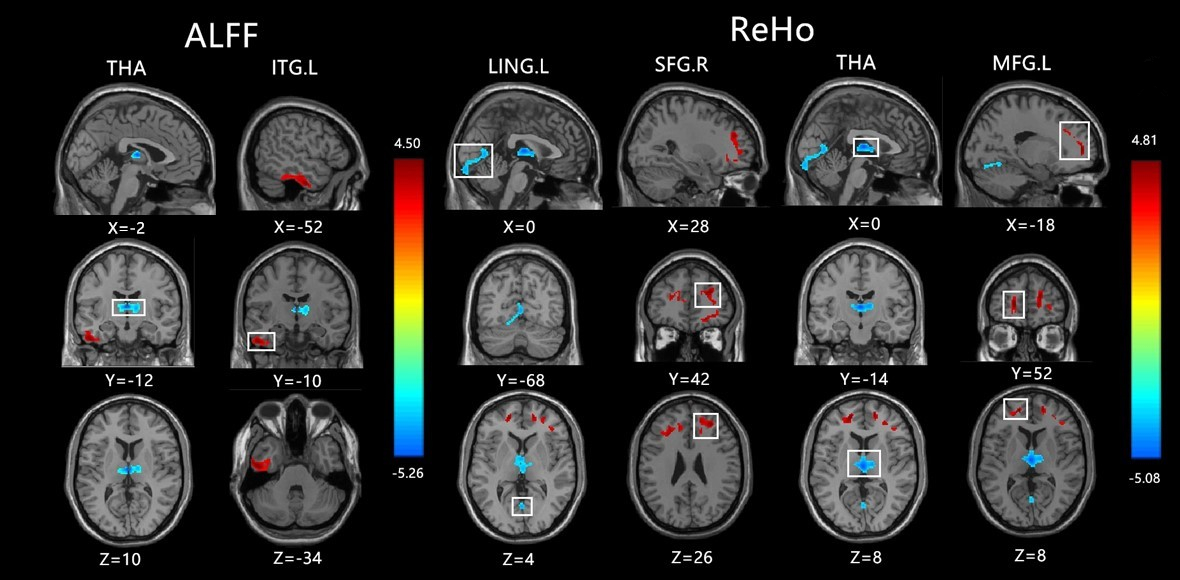
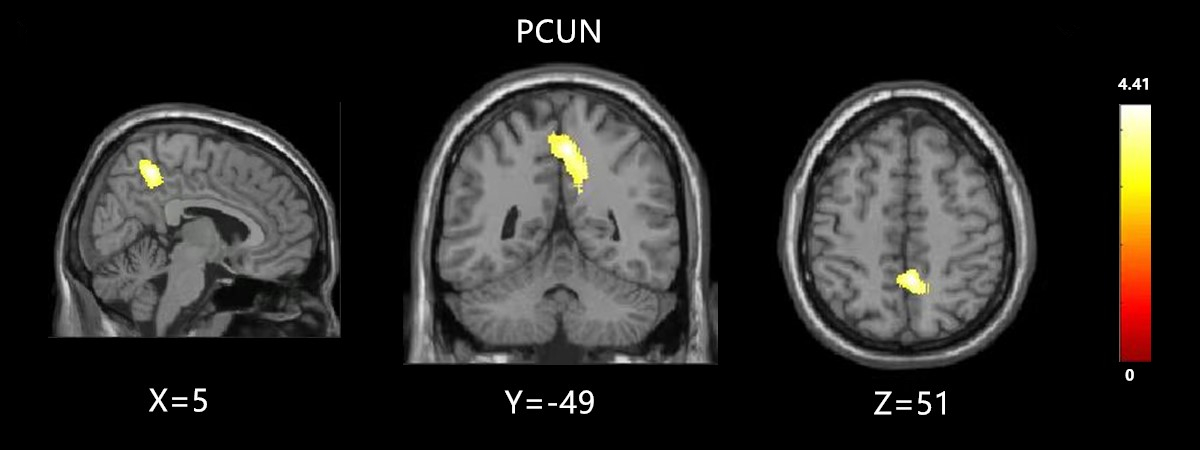
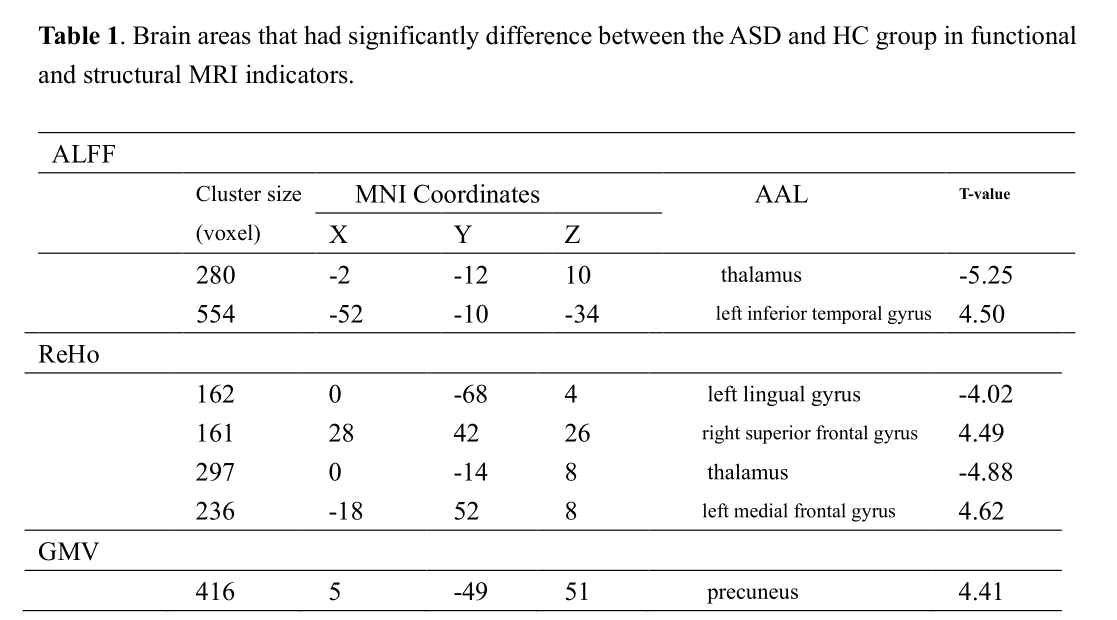
By comparing ASD with HC group, significant differences in ALFF were observed in the thalamus and left Inferior temporal gyrus (ITG.l). Significant difference in ReHo were found in the left Lingual gyrus (LING.L), right Superior frontal gyrus (SFG.R), thalamus, left middle frontal gyrus (MFG.L) (Figure1, Table 1).In addition, we found increased GMV in Precuneus in ASD group as shown in Figure 2.
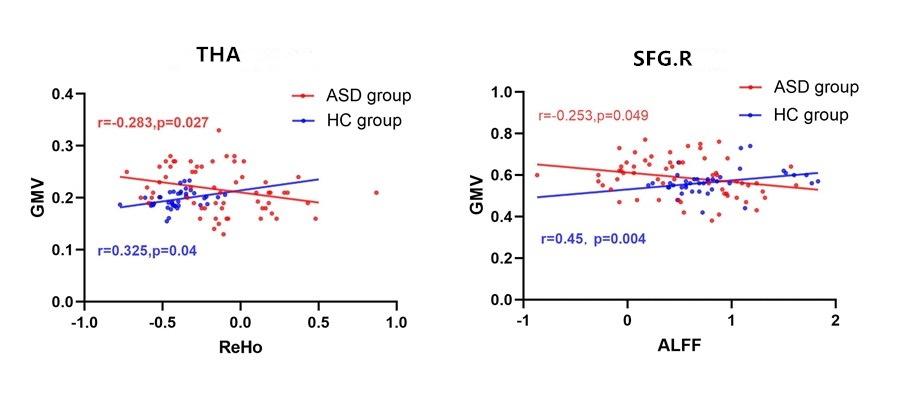
Furthermore, a significant negative correlation was found between ALFF and GMV in the thalamus, between ReHo and GMV in SFG.R. While in HC group, the correlation was positive as shown in Figure 3.
DISCUSSION
SFG plays an important role in social cognitive function [5]. Brain function abnormalities existed in the SFG for ASD patients. Besides, the original positive correlation between brain structure and function in SFG in HC was lost, instead a negative correlation was found in ASD. These abnormalities may be the neural basis of social deficits in patients with ASD. The main function of the thalamus is to regulate behavior and feelings [6]. In thalamus region, ASD patients not only showed abnormalities in brain function, but also abnormal changes in functional and structural coupling, forming a positive correlation change that was opposite to the trend of healthy controls. These abnormal changes in the thalamus may be one of the mechanisms leading to the abnormal integration and regulation of sensory information and movement in ASD.CONCLUSION
Investigating the structural and functional coupling in abnormal brain regions could provide a more comprehensive understanding about ASD. ASD patients not only have abnormal functional indicators in SFG and thalamus, but also have reverse correlation changes between functional and structural indicators compared with healthy people. These findings could help to deeply explore the neural mechanisms in ASD.Acknowledgements
We acknowledge the support received from the National Natural Science Foundation of China(82371934), Joint Fund of Henan Province Science and Technology R&D Program(225200810062).References
[1]Z. Lan, S. et al., Alterations of Regional Homogeneity in Preschool Boys With Autism Spectrum Disorders, Front Neurosci. 2021; 15:644543.
[2]M.X. Abnormal Brain Structure Is Associated with Social and Communication Deficits in Children with Autism Spectrum Disorder: A Voxel-Based Morphometry Analysis, Brain sciences. 2023; 13 (5):779.
[3]Z. Qing, G. Size matters to function: Brain volume correlates with intrinsic brain activity across healthy individuals, Neuroimage. 2016; 139:271-8.
[4]Z.L. et al., Changes of gray matter volume and amplitude of low-frequency oscillations in amnestic MCI: An integrative multi-modal MRI study, Acta radiologica (Stockholm, Sweden : 1987). 2015; 56 (5): 614-21.
[5] C.E. Forbes The role of the human prefrontal cortex in social cognition and moral judgment, Annual review of neuroscience. 2010; 33:299-324.
[6] L. Wagner, et al., Associations between thalamocortical functional connectivity and sensory over-responsivity in infants at high likelihood for ASD, Cereb Cortex. 2023.33;(12):8075-8086.
Figures