3078
Application of Automatic Subregion Segmentation in Perfusion Evaluation of Hippocampal Sclerosis based on Arterial Spin Labeling1Radiology, General Hospital of Ningxia Medical University, Yinchuan, China, 2MR Research, GE HealthCare MR Research, Beijing, China, Beijing, China
Synopsis
Keywords: Epilepsy, Arterial spin labelling, Automatic Subregion Segmentation
Motivation: Evaluating the hippocampal volume and perfusion level is important in the diagnosis of hippocampal sclerosis (HS). However, further observation at the subregion level is difficult.
Goal(s): To investigate the alterations in hippocampal subregion volume and blood flow in HS patients with an automatic segmentation procedure.
Approach: T1-MPRAGE and 3D-pCASL images were automatically segmented to quantify the hippocampal subregion volume and blood flow. The diagnostic performance of these subregion quantitative metrics in HS were statistically analyzed.
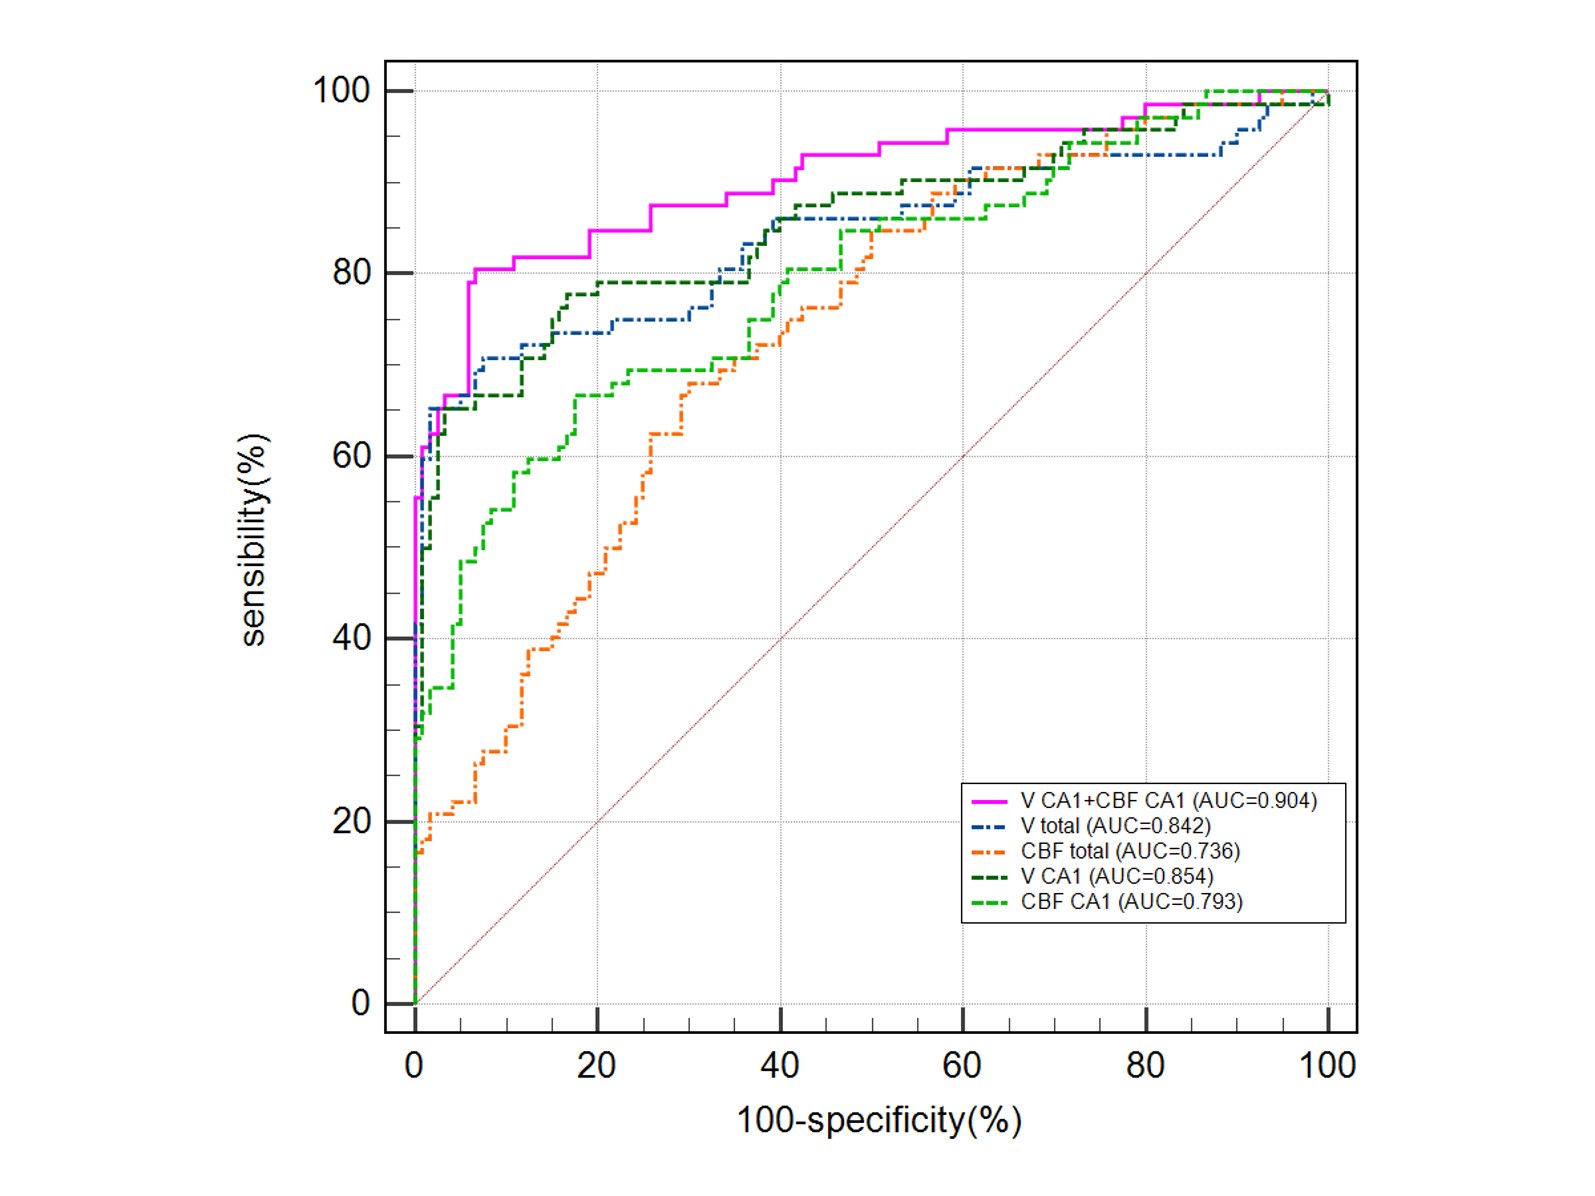
Results: The volume (VCA1) and blood flow (CBFCA1) of CA1 region are independent factors in diagnosing HS. The combination of VCA1 and CBFCA1 has the highest diagnostic performance.
Impact: The combination of automatic segmentation and arterial spin labeling offers a quantitative imaging foundation for diagnosing hippocampal sclerosis at the subregion level. This scheme can also be applied to other MR techniques to improve the diagnostic effectiveness in hippocampal research.
Introduction
Mesial temporal lobe epilepsy with hippocampal sclerosis (HS) can be alleviated or even eliminated through surgery [1]. MRI plays a crucial role in the preoperative assessment of epileptogenic lesions [2]. Previous studies have shown that HS can cause a decrease in hippocampal volume and CBF on the affected side [3,4]. In view of the pathological and clinical correlation of hippocampal sclerosis subregions [5,6], it is very important to develop MRI to assess the condition of hippocampal subregions. However, due to the small spatial scale of hippocampal subregions, past MR studies were often limited to the level of the overall hippocampus. In contrast, automatic segmentation techniques that has been evolving in recent years is more accurate and efficient than manual delineation. This study utilizes subregion automatic segmentation and 3D pseudo-continuous arterial spin labeling (pCASL) technology to quantify the changes in hippocampal subregion volume and blood flow in HS patients. Additionally, we aim to evaluate the diagnostic performance of subregion quantitative metrics and provide a solid imaging foundation for the subregional diagnosis of HS.Methods
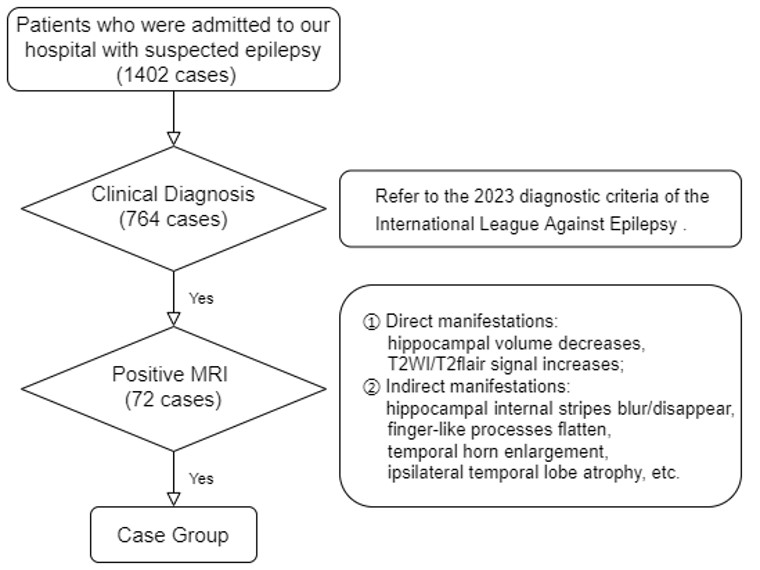
ParticipantsThis study was approved by the Ethics Review Committee of our institution. The case group consisted of 72 patients diagnosed with unilateral mesial temporal lobe epilepsy and hippocampal sclerosis, meanwhile 60 healthy individuals were recruited as the control group. There were no statistically significant differences in age and gender between the two groups (age: t=0.634, P=0.527; gender:χ 2=0.367, P=0.545). The detailed inclusion and exclusion criteria were shown in Figure 1.
Data acquisition
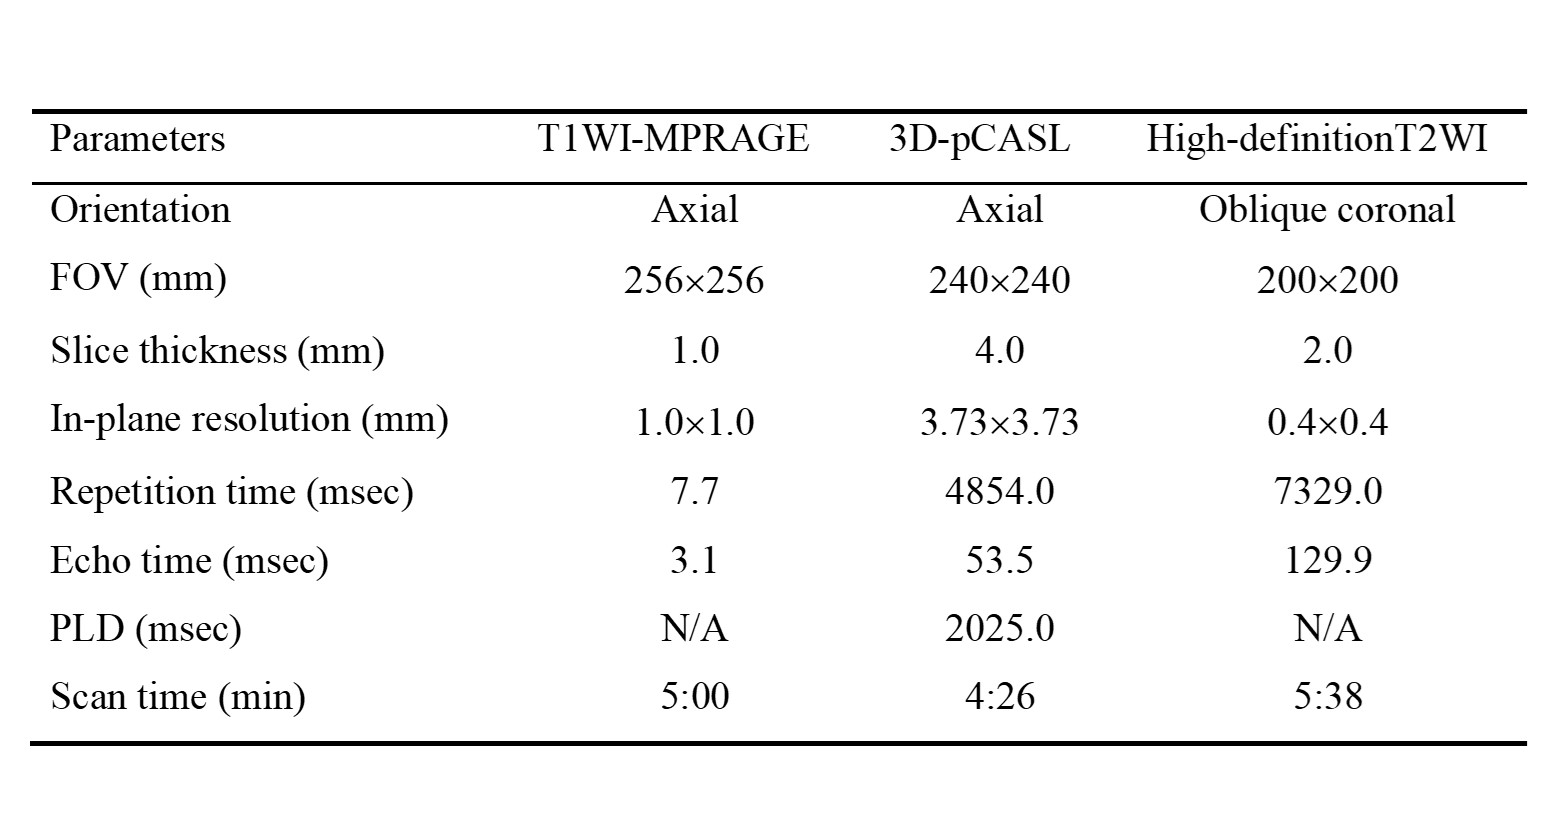
All participants were scanned after obtaining written informed consent. All MR examinations were performed on a 3.0T MR scanner (SIGNATM Architect, GE Healthcare, Milwaukee WI, USA) equipped with a 48-channel head coil. The main scan parameters were listed in Table 1.
Image post-processing
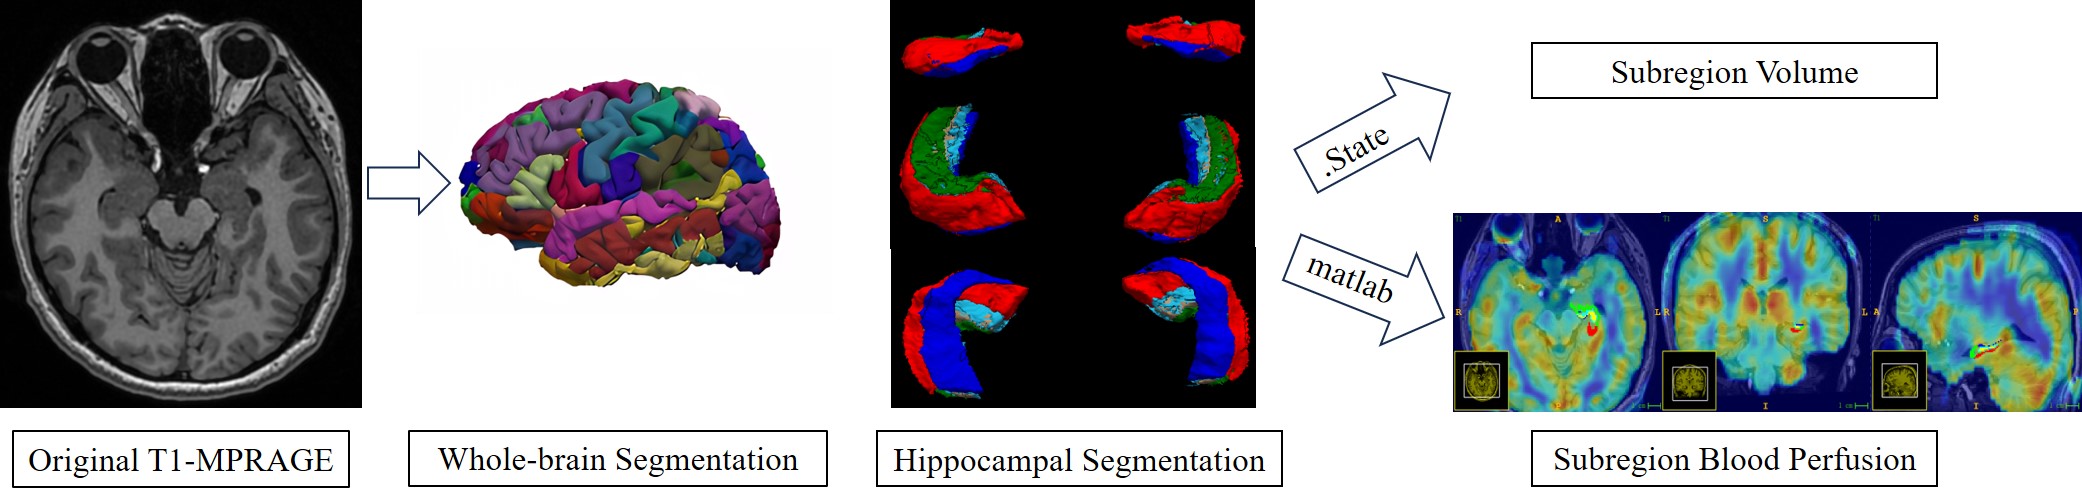
The automatic segmentation of hippocampal subregions was performed using FreeSurfer (V7.3.2, http://surfer.nmr.mgh.harvard.edu/). The detailed steps were shown in Figure 2. The segmentation process involved a combination of 39 in-vivo T1-weighted MRI datasets with 1mm isotropic voxels and 15 ex-vivo MRI datasets with 0.1-0.2 mm isotropic resolution [7, 8]. Bayesian probability was employed to synthesize a hippocampal structure calculation map [9]. The resulting segmentation automatically divided the bilateral hippocampus into subregions such as subiculum (Sub), CA1, CA2-3, CA4, dentate gyrus granule cell layer (GC-DG), and others. The volume data for the subregion can be automatically obtained in the generated .stats folder. The CBF value of the hippocampal subregion is measured fully automatically using ITK-SNAP 4.0. The subregions segmented by the MATLAB self-written program are mapped onto the CBF quantitative map. The CBF values are obtained in the Volumes and Statistics.
Statistical analysis
SPSS (V26.0, IBM Corporation, Armonk, NY, USA) was used to conduct an independent-samples t-test of variance to compare the subregion volumes and CBF values between the control and the case group. Subregion metrics that showed statistical significance were further utilized in the multi-factor logistic regression analysis using MedCalc (V20.11.5, MedCalc, Ostend, Belgium). Independent subregion metrics for diagnosing HS were identified and their receiver operating characteristic (ROC) curves were plotted. The area under the curves (AUCs) were measured and compared using the Delong test, with P-value<0.05 considered to be statistically significant.
Results
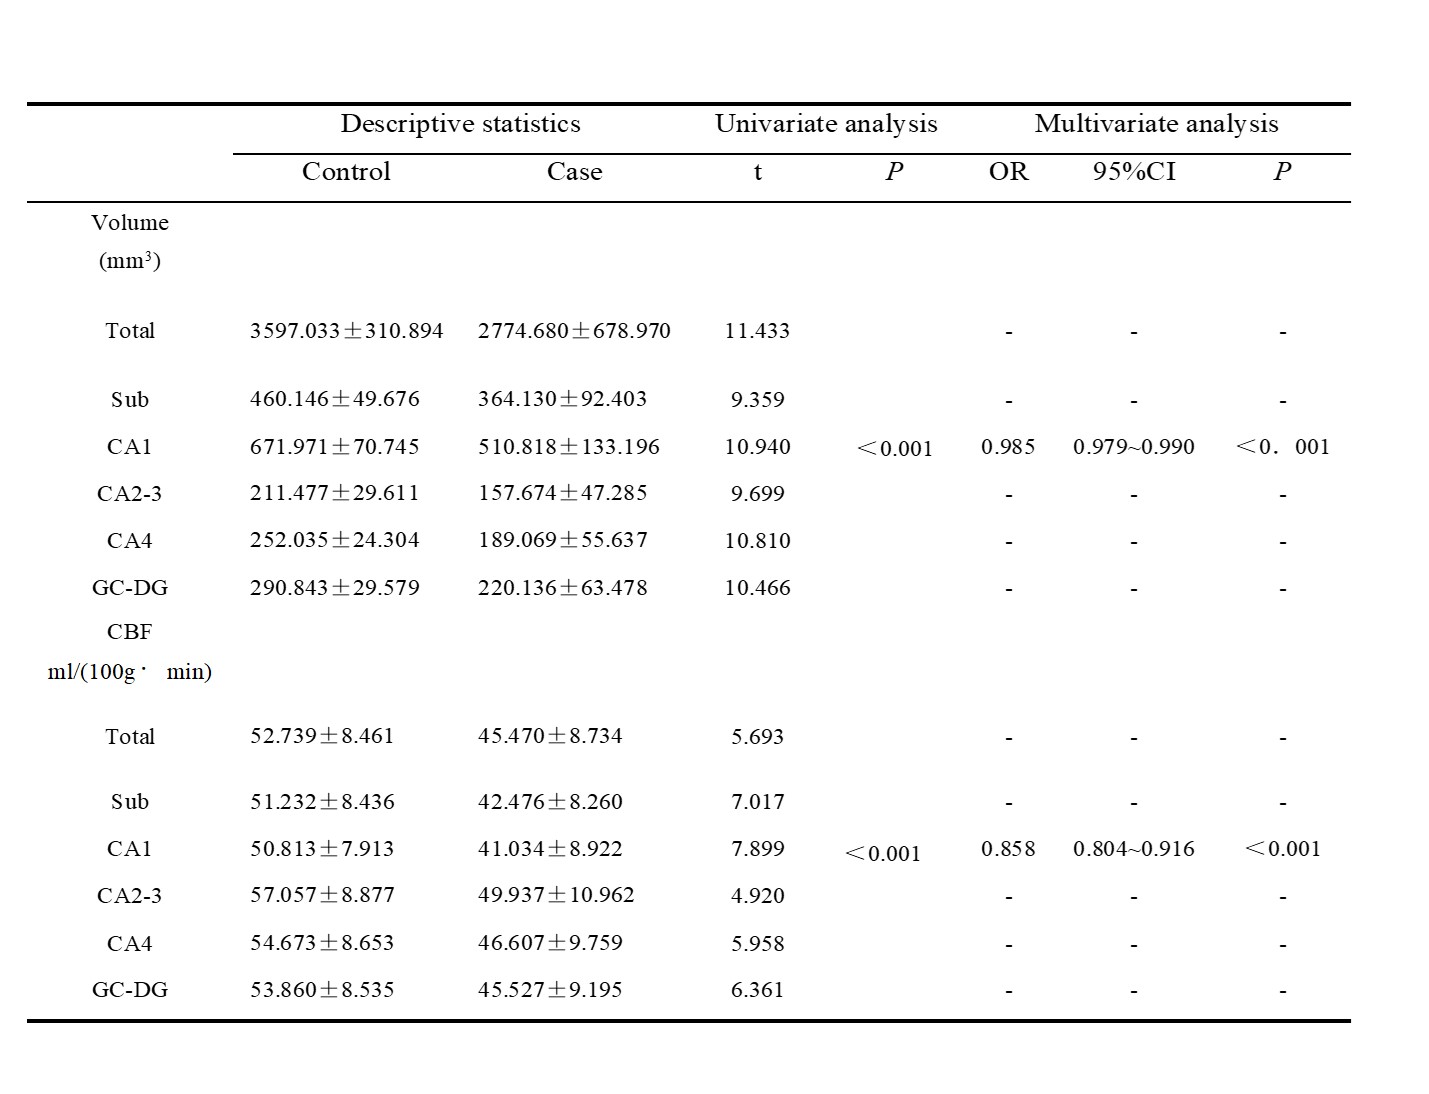
Statistical analysis revealed significant differences in subregion volumes and CBF values between the control and the case group (P<0.001). Qualitative analysis showed that VCA1, CBFSub, and CBFCA1 were most significantly reduced. Multifactor logistic stepwise regression analysis was conducted on the variables with statistically significant differences in the affected side groups mentioned above. The analysis revealed that VCA1 and CBFCA1 are independent factors for diagnosing HS at the subregion level. The combination of VCA1 and CBFCA1 resulted in a higher AUC (0.904) in diagnosing HS than V total (0.904), CBF total (0.736), VCA1 (0.854) or CBFCA1 (0.793) alone. The difference was statistically significant (V total: Z=2.463, CBF total: Z=4.938, VCA1: Z=2.514,CBFCA1: Z=3.319;all P<0.05). Please refer to Table 2 and Figure 3 for details.Discussion
The diagnostic efficiency of HS can be improved with the use of automatic partition segmentation technology. VCA1 and CBFCA1 are independent factors for diagnosing HS at the subregion level. Previous studies by STAALDUINEN [10] et al. have highlighted that the CA1 area is particularly sensitive to hypoxia, often referred to as a "vulnerable" area. The combined diagnosis of HS is more efficient than a single parameter.Conclusion
Automatic subregion segmentation can help to realize the quantitative analysis of hippocampal subregion volume and blood flow based on MR. The combination of specific subregion metrics (VCA1 and CBFCA1) may be potential image bio-markers in diagnosing HS at subregion level.Acknowledgements
No acknowledgement found.References
[1] Yoganathan K, Malek N, Torzillo E, et al. Neurological update: structural and functional imaging in epilepsy surgery[J]. Journal of Neurology, 2023, 270(5): 2798-2808.
[2] Algahtany M, Abdrabou A, Elhaddad A, et al. Advances in brain imaging techniques for patients with intractable epilepsy[J]. Frontiers in Neuroscience, 2021, 15: 699123.
[3] Mittal A, Singh Dhanota DP, Saggar K, et al. Role of interictal arterial spin labeling magnetic resonance perfusion in mesial temporal lobe epilepsy [J]. Ann Indian Acad Neurol. 2021;24(4):495-500. [4] Riederer F, Seiger R, Lanzenberger R, et al. Automated volumetry of hippocampal subfields in temporal lobe epilepsy [J]. Epilepsy Res. 2021;175:106692.
[5] Mizutani M, Sone D, Sano T, et al. Histopathological validation and clinical correlates of hippocampal subfield volumetry based on T2-weighted MRI in temporal lobe epilepsy with hippocampal sclerosis[J]. Epilepsy Res. 2021; 177:106759.
[6] Menzler K, Hamer HM, Mross P, et al. Validation of automatic MRI hippocampal subfield segmentation by histopathological evaluation in patients with temporal lobe epilepsy [J]. Seizure. 2021; 87:94-102.
[7] Sämann P G, Iglesias J E, Gutman B, et al. FreeSurfer‐based segmentation of hippocampal subfields: A review of methods and applications, with a novel quality control procedure for ENIGMA studies and other collaborative efforts[J]. Human brain map**, 2022, 43(1): 207-233.
[8] Park Y W, Choi Y S, Kim S E, et al. Radiomics features of hippocampal regions in magnetic resonance imaging can differentiate medial temporal lobe epilepsy patients from healthy controls[J]. Scientific reports, 2020, 10(1): 19567.
[9] Iglesias J E, Augustinack J C, Nguyen K, et al. A computational atlas of the hippocampal formation using ex vivo, ultra-high resolution MRI: application to adaptive segmentation of in vivo MRI[J]. Neuroimage, 2015, 115: 117-137.
[10] Van Staalduinen E K, Zeineh M M. Medial temporal lobe anatomy[J]. Neuroimaging Clinics, 2022, 32(3): 475-489.
Figures