3076
Initial evaluation of relaxometry from Synthetic MRI in Autism Spectrum Disorder in Children with or without mental retardation1The Third Affiliated Hospital of Zhengzhou University, Zhengzhou, China, 2GE Healthcare MR Research, Beijing, China
Synopsis
Keywords: Other Neurodegeneration, Nervous system, Autism spectrum disorder,Synthetic MR
Motivation: To comprehend the brain microstructure of ASD patients, with or without Mental Retardation, and differentiate between them.
Goal(s): This article aims to evaluate the differences of T1 and T2 relaxometry in disease related brain regions for children with ASD-MR , ASD group, and HC group, by using Synthetic MRI.
Approach: MAGiC data were processed in SyMRI to create T1 and T2 relaxometry maps. Two pediatric radiologists outlined regions of interest on these maps using ITK-SNAP.
Results: The T1 in left thalamus could be sensitive to reflect the microstructural change in patient groups and could be helpful indicator to differentiate the ASD and ASD-MR.
Impact: T1 relaxometry derived from Synthetic MRI is potential for differentiation of Autism Spectrum Disorder and Autism Spectrum Disorder with Mental retardation.
Introduction and Purpose
Autism spectrum disorder (ASD) is a common neurodevelopmental condition, presenting challenges in communication, social interaction, and emotional processing1. Mental retardation (MR), or intellectual disability (ID), signifies significant intellectual impairment due to delayed or obstructed development below age-appropriate levels. Children with ASD often experience concurrent neurodevelopmental disorders like language delay, intellectual disability, and global developmental delay2. Currently, ASD and ASD concurrent neurodevelopmental disorder diagnoses rely on subjective assessments and behavioral tests, which can result in misdiagnosis or underdiagnosis. It's essential to investigate objective methods for assessing brain microstructure differences, particularly in early stages. Synthetic MR (SyMRI) is an emerging MRI technique that quantitatively analyzes whole-brain T1 and T2 relaxation times and proton density in a single scan. This study aims to explore quantitative relaxometry changes in ASD with MR (ASD-MR) and ASD alone (ASD) compared to healthy controls.Materials and Methods
Between January 2020 and December 2022, we collected data from three groups: 20 children newly diagnosed with both ASD and MR, 20 children with ASD, and 20 healthy control children (HC). All participants were aged 24 to 60 months with a gestational age of 37 weeks or more. Diagnoses were confirmed by two experienced pediatric developmental specialists using DSM-5 criteria3.T1WI, T2WI, DWI, and Synthetic MRI (MAGnetic resonance imaging compilation, MAGiC) were obtained on a 3.0T MRI scanner (Pioneer, GE Healthcare, Milwaukee, WI). The parameters for axial MAGiC were as follows: TR 4266 ms, TE 19.4 ms, FOV 20 × 20cm², matrix size 288 × 224, 22 slices, slice thickness 4 mm, slice gap 1 mm, and a total scan time of 4 minutes 16 seconds.
The MAGiC data were imported into software SyMRI (Synthetic MR 8.0; Linkoping) to generate T1 and T2 relaxometry maps. Two pediatric radiologists manually delineated regions of interest (ROI) on the T1 and T2 maps using ITK-SNAP (3.8.0). These ROIs were shown in Figure 1.
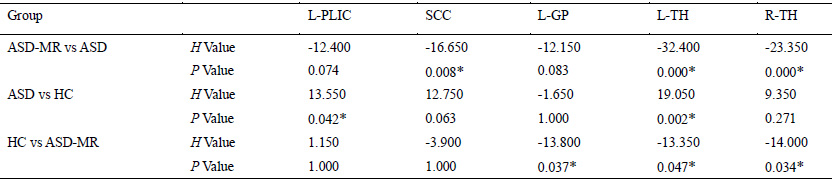
Data analysis utilized SPSS 26.0. We compared numerical variables among groups using one-way analysis of variance (ANOVA) or the Kruskal-Wallis H rank-sum test, accounting for data normality and variance homogeneity. P-values were Bonferroni-adjusted, with a significance level set at P<0.05. Spearman correlation analysis assessed the relationship between T1 or T2 relaxometry and Gesell scale scores in children with ASD-MR. Diagnostic performance of T1 and T2 relaxometry was evaluated through receiver operating characteristic (ROC) curves, including the area under the curve (AUC) calculation.
Results
Significant higher T1 relaxometry in the left thalamus was found in children in ASD group than that in ASD-MR and HC group (p < 0.01). And the T1 relaxometry in HC group was larger than the that in ASD-MR group (p < 0.05). (Figure 2-A)(Table 1)The T1 relaxometry of the left thalamus in the ASD-MR group was positively correlated with adaptive behavior scores (r = 0.536, p < 0.05). (Figure 2-B)(Table 2). The AUC of T1 relaxometry in left thalamus was 0.986 (sensitivity (sen.) =0.950, specificity (spe.) = 0.950), 0.762 (sen.= 0.650, pe. = 0.900) and 0.890 (sen.= 0.900, spe.= 0.700) respectively for distinguishing ASD-MR from ASD group, ASD-MR from HC group, and ASD from HC group.(Figure 2-C)(Table 3).
No significant difference was observed for T2 relaxometry.
Discussion
A decrease in lipid and cholesterol content in the myelin sheath or an increase in brain tissue water content is known to lead to higher T1 relaxometry4.The highest T1 relaxometry observed in the left thalamus in ASD group indicated similar potential molecular composition alteration in the brain tissue of ASD patients, which is consistent with previous findings5. Existed studies with diffusion imaging for ASD have shown the reduction in Fractional Anisotropy(FA) in the thalamic radiations6,7 due to the demyelination and lower axonal density in the thalamus, corresponding to change of T1 in left thalamus. For ASD-MR, mental retardation is considered that the risk genes expressed in the thalamus of ASD-MR children could lead to reduced excitability and damage to thalamic neurons8, which may associate with abnormal aggregation of neural fiber bundles and the myelin sheath content would increase. Lateralized microstructural differences in the brains may explain the lack of significant T1 relaxometry differences in the right thalamus among the three groups. The noteworthy positive correlation between T1 values in the thalamus and adaptive behavior implies the value of T1 quantification in assessing changes in adaptive behavior.Conclusion
This study initially examined T1 relaxometry in the brain regions related to the condition, both in ASD with or without MR. T1 in the left thalamus proved to be a sensitive indicator for detecting microstructural abnormalities in patients, potentially aiding in distinguishing between ASD and ASD-MR.Acknowledgements
Funding: This project was supported by the Henan Province Science and Technology Research (Grants No. 232102311091)
References
1 Benedetto, L. et al. One-Year Follow-Up Diagnostic Stability of Autism Spectrum Disorder Diagnosis in a Clinical Sample of Children and Toddlers. Brain sciences 11, doi:10.3390/brainsci11010037 (2021).
2 Chen, S. et al. Autism spectrum disorder and comorbid neurodevelopmental disorders (ASD-NDDs): Clinical and genetic profile of a pediatric cohort. Clinica chimica acta; international journal of clinical chemistry 524, 179-186, doi:10.1016/j.cca.2021.11.014 (2022).
3 Francés, L. et al. Current state of knowledge on the prevalence of neurodevelopmental disorders in childhood according to the DSM-5: a systematic review in accordance with the PRISMA criteria. Child and adolescent psychiatry and mental health 16, 27, doi:10.1186/s13034-022-00462-1 (2022).
4 Filimonova, E., Amelina, E., Sazonova, A., Zaitsev, B. & Rzaev, J. Assessment of normal myelination in infants and young children using the T1w/T2w mapping technique. Frontiers in neuroscience 17, 1102691, doi:10.3389/fnins.2023.1102691 (2023).
5 Deoni, S. C. et al. White-matter relaxation time and myelin water fraction differences in young adults with autism. Psychological medicine 45, 795-805, doi:10.1017/s0033291714001858 (2015).
6 He, X., Zhao, X., Sun, Y., Geng, P. & Zhang, X. Application of TBSS-based machine learning models in the diagnosis of pediatric autism. Frontiers in neurology 13, 1078147, doi:10.3389/fneur.2022.1078147 (2022).
7 Zhang, M. et al. Brain white matter microstructure abnormalities in children with optimal outcome from autism: a four-year follow-up study. Scientific reports 12, 20151, doi:10.1038/s41598-022-21085-8 (2022).
8 Roy, D. S. et al. Anterior thalamic dysfunction underlies cognitive deficits in a subset of neuropsychiatric disease models. Neuron 109, 2590-2603.e2513, doi:10.1016/j.neuron.2021.06.005 (2021).
Figures
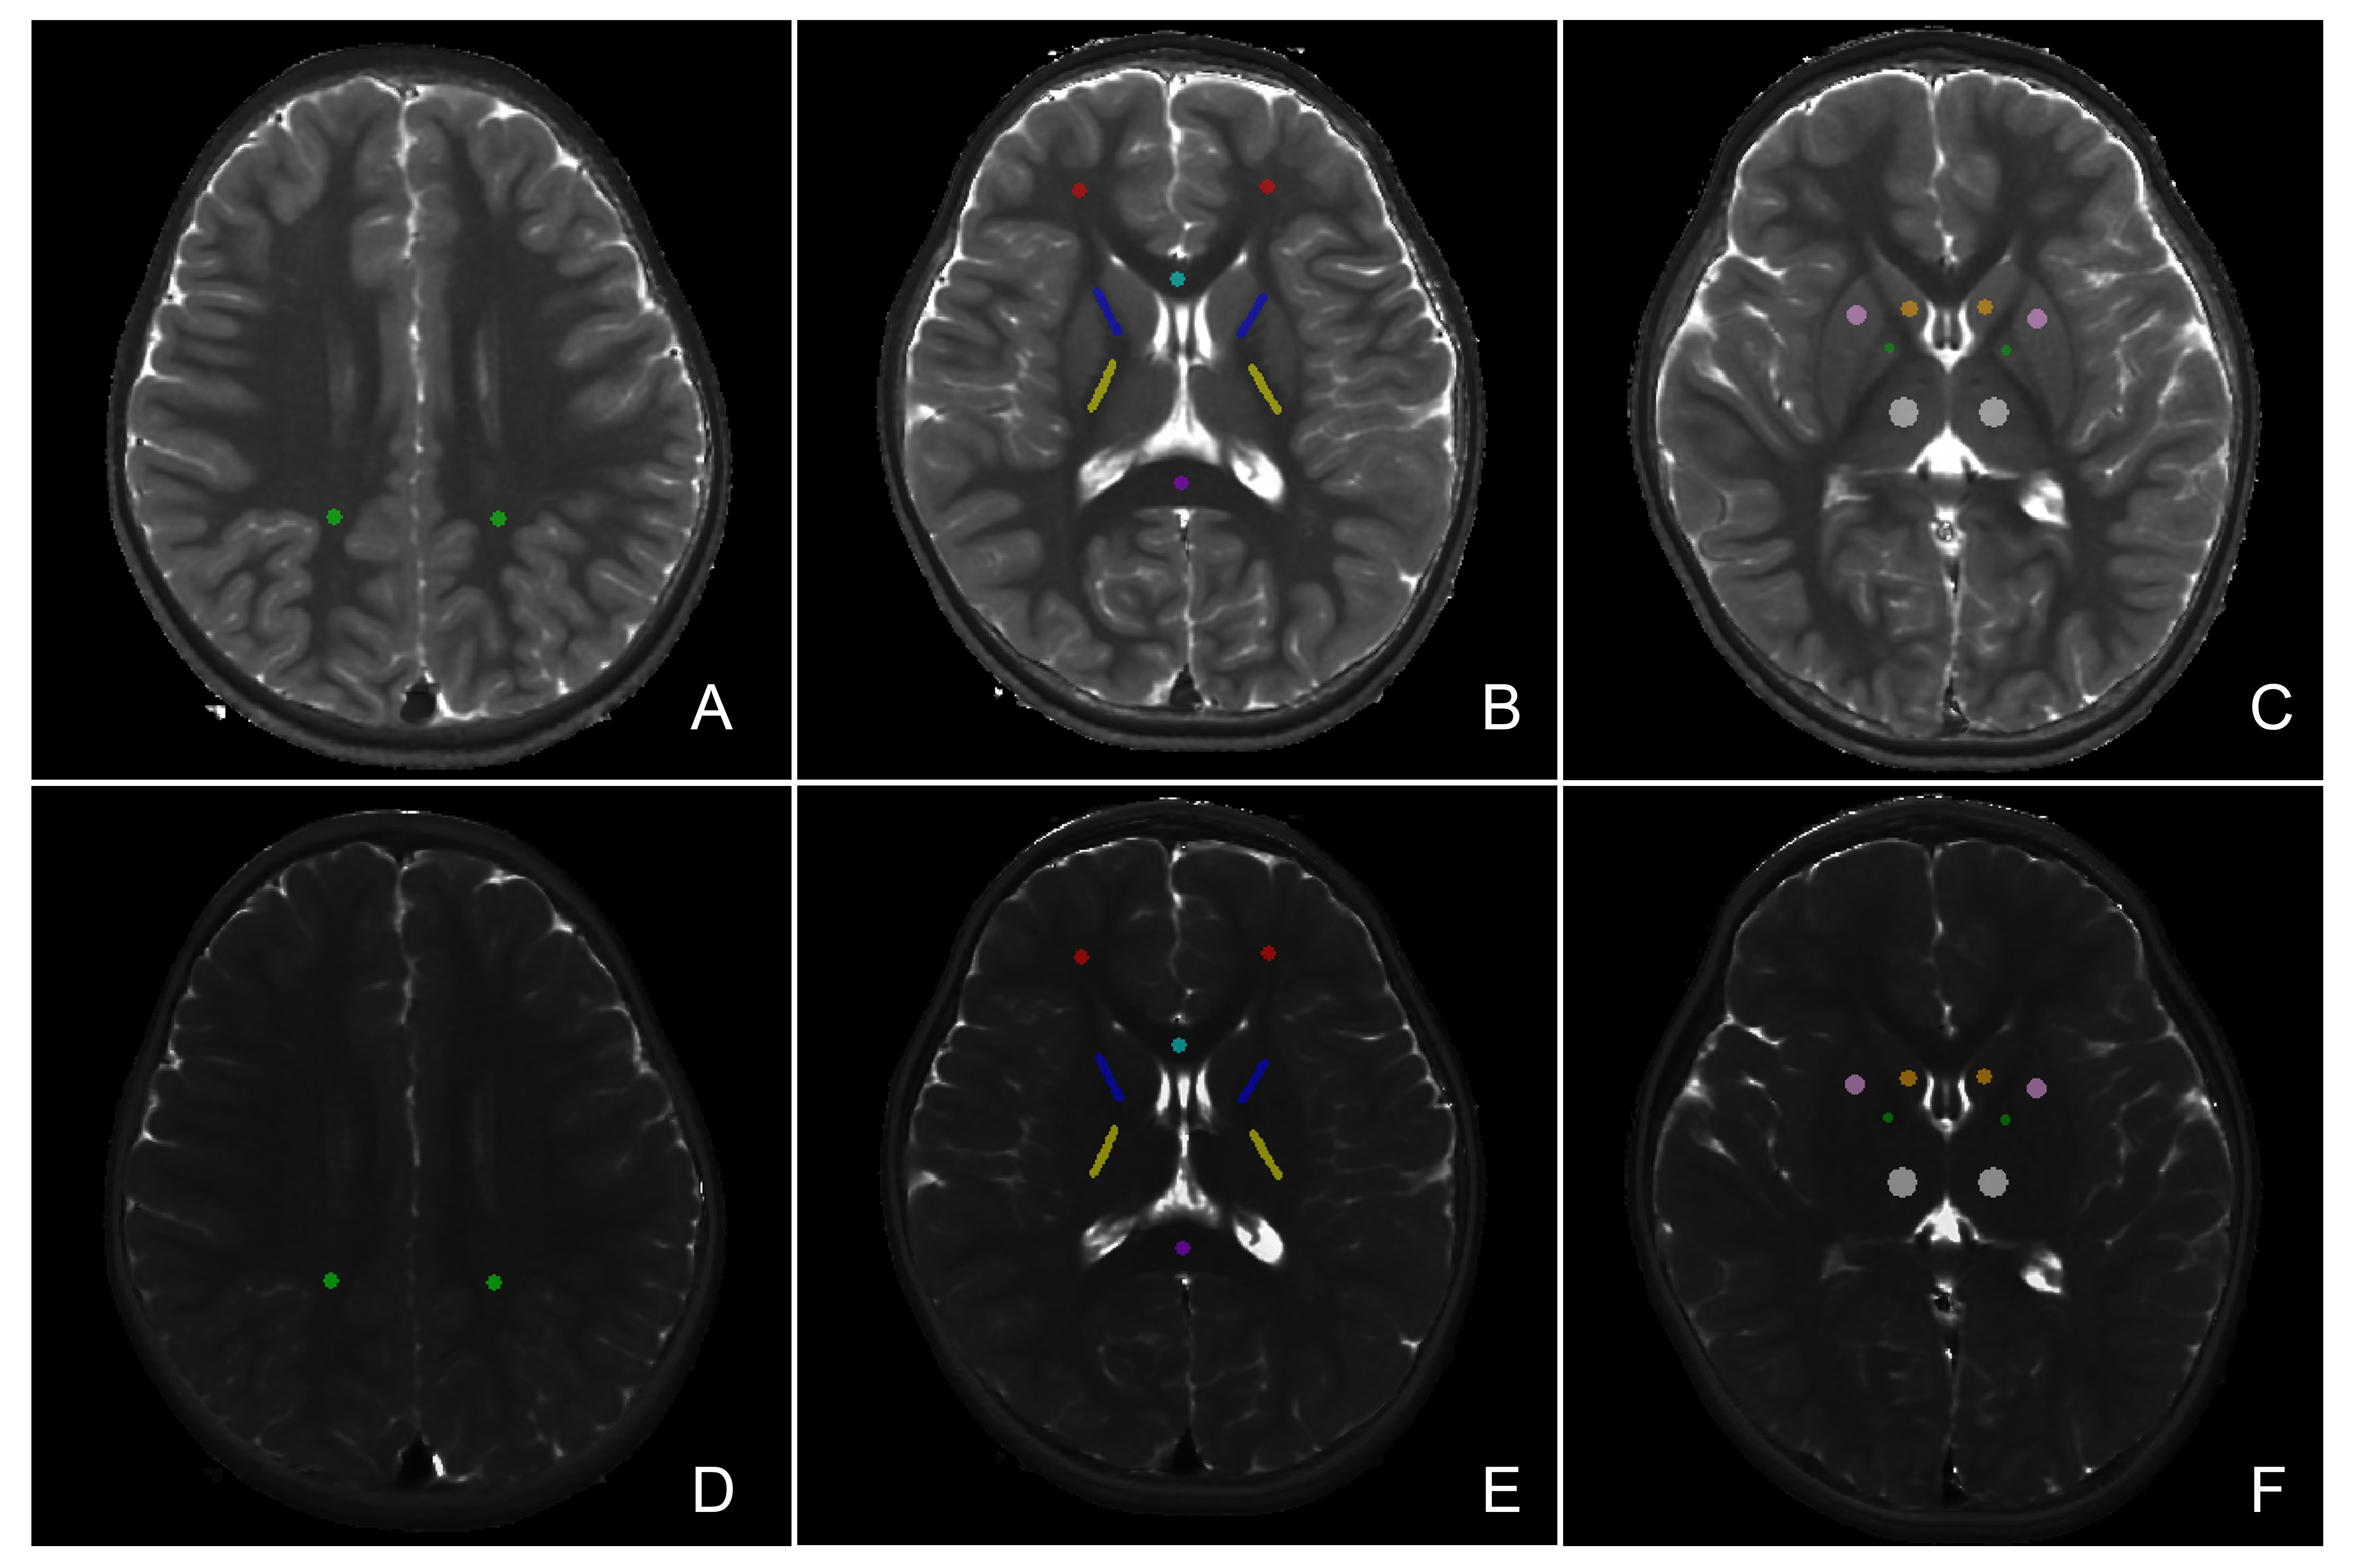
Figure 1 Representative quantitative T1 relaxation (A-C) and T2 relaxation maps (D-F). Regions of interest (ROIs) were outlined for investigated brain regions with different colours. Light green: parietal white matter; Red: Frontal white matter; Light blue: Knee of the corpus callosum; Deep purple: Splenium of the corpus callosum; Deep blue: Anterior limb of the internal capsule; Yellow: Posterior limb of the internal capsule; Orange: Head of the caudate nucleus; Pink: Putamen; Dark green: Pallidum; White: Thalamus.
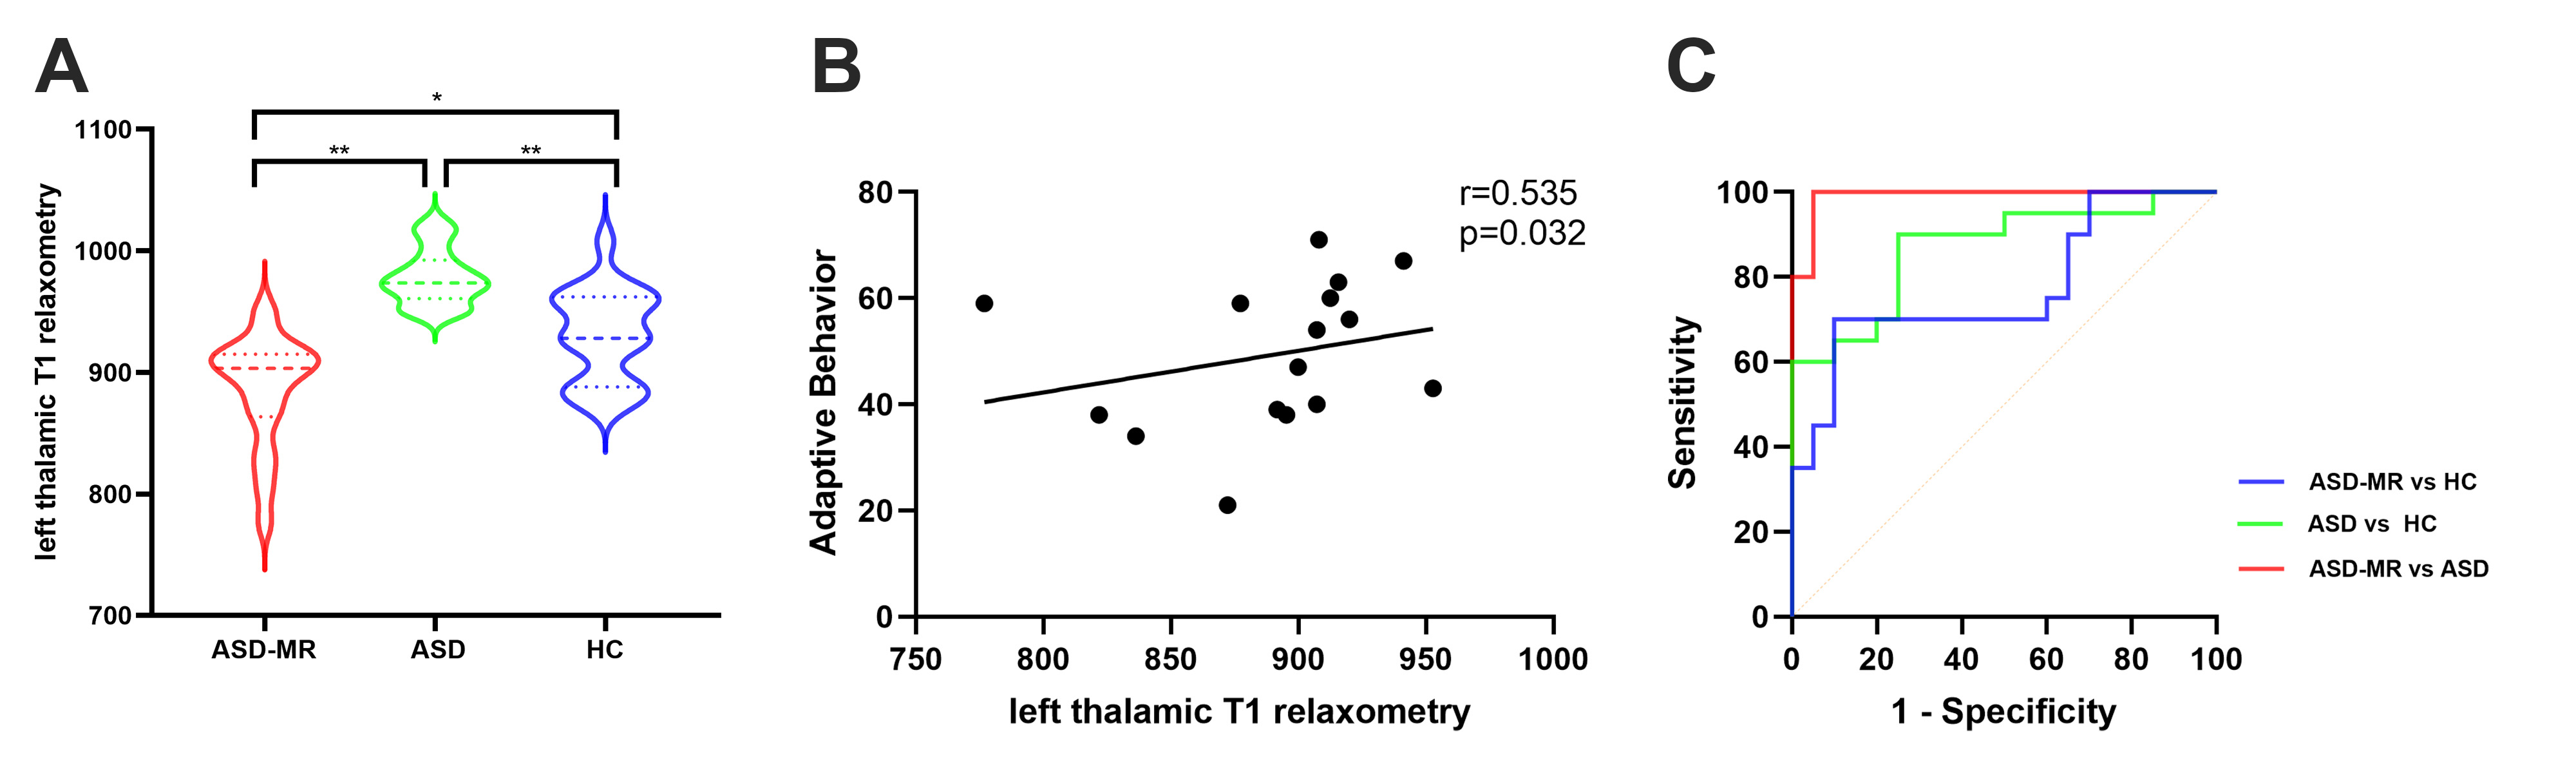
Figure 2-A: T1 relaxometry comparison in the left thalamus among ASD with MR (ASD-MR) group, ASD group, and healthy controls. * p < 0.05; ** p < 0.01, with Bonferroni-corrected p-values.
2-B: Left thalamic T1 relaxometry correlation with adaptive behavior scores in the ASD-MR group.
2-C: ROC curves for distinguishing groups using left thalamic T1 relaxometry. Blue: ASD-MR vs. ASD; Red: ASD vs. healthy controls; Green: ASD-MR vs. healthy controls.