3074
Coronary angiography and myocardial perfusion MRI using hyperpolarized water1Technical University of Denmark, Kongens Lyngby, Denmark, 2MR Research Centre, Aarhus University, Aarhus, Denmark, 3Danish Research Centre for Magnetic Resonance, Copenhagen University Hospital, Hvidovre, Denmark
Synopsis
Keywords: Hyperpolarized MR (Non-Gas), Hyperpolarized MR (Non-Gas), coronary MRA, myocardial perfusion
Motivation: Conventional cardiac MRI plays an essential role in diagnosing coronary artery disease (CAD). However, the image quality is limited by low SNR.
Goal(s): Hyperpolarized water can address this problem and be an alternative to Gd-based MR contrast agents for coronary MR angiography (MRA) and myocardial perfusion MRI with minimal safety concerns.
Approach: In this work, we demonstrate a procedure to achieve high-resolution motion-free coronary MRA and 3D whole heart myocardial perfusion quantification using hyperpolarized water.
Results: The work shows that hyperpolarized water is suited as a positive contrast agent for coronary MRA and myocardial perfusion MRI.
Impact: Compared to previous work on coronary MRA and myocardial perfusion MRI using hyperpolarized 13C/1H, we achieve higher spatial resolution and image quality. Despite invasive catheterisation procedures, the method can be applied in particular situations and has potential for broader use.
Introduction
Cardiac MRI uses no ionizing radiation and can provide both anatomical and functional information. However, the image quality and resolution are limited by the signal-to-noise ratio. Hyperpolarized 13C-labeled compounds have been used in coronary MRA and myocardial perfusion studies to overcome the SNR limitations [1,2]. 1H has a four times higher gyromagnetic ratio than 13C. Thus, imaging using 1H provides four times higher spatial resolution than 13C with the same use of imaging gradients. Also, a much higher concentration of 1H in an injectable solution can be obtained, which results in higher SNR compared to 13C. Additionally, the standard scanner hardware, coils, and pulse sequences can be used to image 1H. Due to its favorable properties, water could be a suitable contrast agent for coronary MRA and myocardial perfusion MRI with minimal safety concerns. Studies have demonstrated the feasibility of performing coronary/renal MRA using hyperpolarized water in a pig model [3,4]. In this work, we demonstrate the feasibility of high-resolution cardiac motion-free coronary MRA and 3D whole heart quantitative myocardial perfusion using hyperpolarized water.Method
HyperpolarizationPreparation of samples for water hyperpolarization experiments generally followed a procedure described in [5]. For each experiment, a 600 µL sample was polarized using a SpinAligner polarizer (Polarize ApS, Copenhagen Denmark). The sample was dissolved in 7.5 mL of a deoxygenated (argon bubbling) and tonicity checked TRIS D2O buffer. The water proton concentration in the dissolved sample was approx. 5 M. A small fraction of the sample (550 µL) was taken aside and used for measuring the polarization and T1 of the water.
Animal protocol
One 40 kg female danish domestic pig participated in this feasibility study. The animal handling is followed by a procedure described in [3]. A 6F catheter was placed inside the left coronary artery circumflex using X-ray guidance.
Imaging protocol
All imaging experiments were performed using a 3T scanner (Discovery MR750, GE Healthcare)
- Hyperpolarized 1H dynamic coronary MRA: Images were acquired as projections in the long axis plane of the heart with cardiac gating in diastole using a 2D gradient echo sequence with flip angle=2°, TE=2.2 ms TR=4.4 ms, slice thickness=150 mm, FOV=120×108 mm2, in plane resolution= 0.6×0.6 mm2, acceleration=2, heart rate=51 bpm, 1 frame per heartbeat.
- Hyperpolarized 1H myocardial perfusion imaging: Images are acquired to cover the whole heart in a short axis view using a multi-slice 2D gradient echo sequence with flip angle=2°, TE=1.4 ms, TR=2.7 ms, slice thickness=8 mm, number of slices=10, FOV=120×108 mm2, in plane resolution=1.5×1.5 mm2, acceleration=2, heart rate=59 bpm, 1 frame per heartbeat.
Result and Discussion
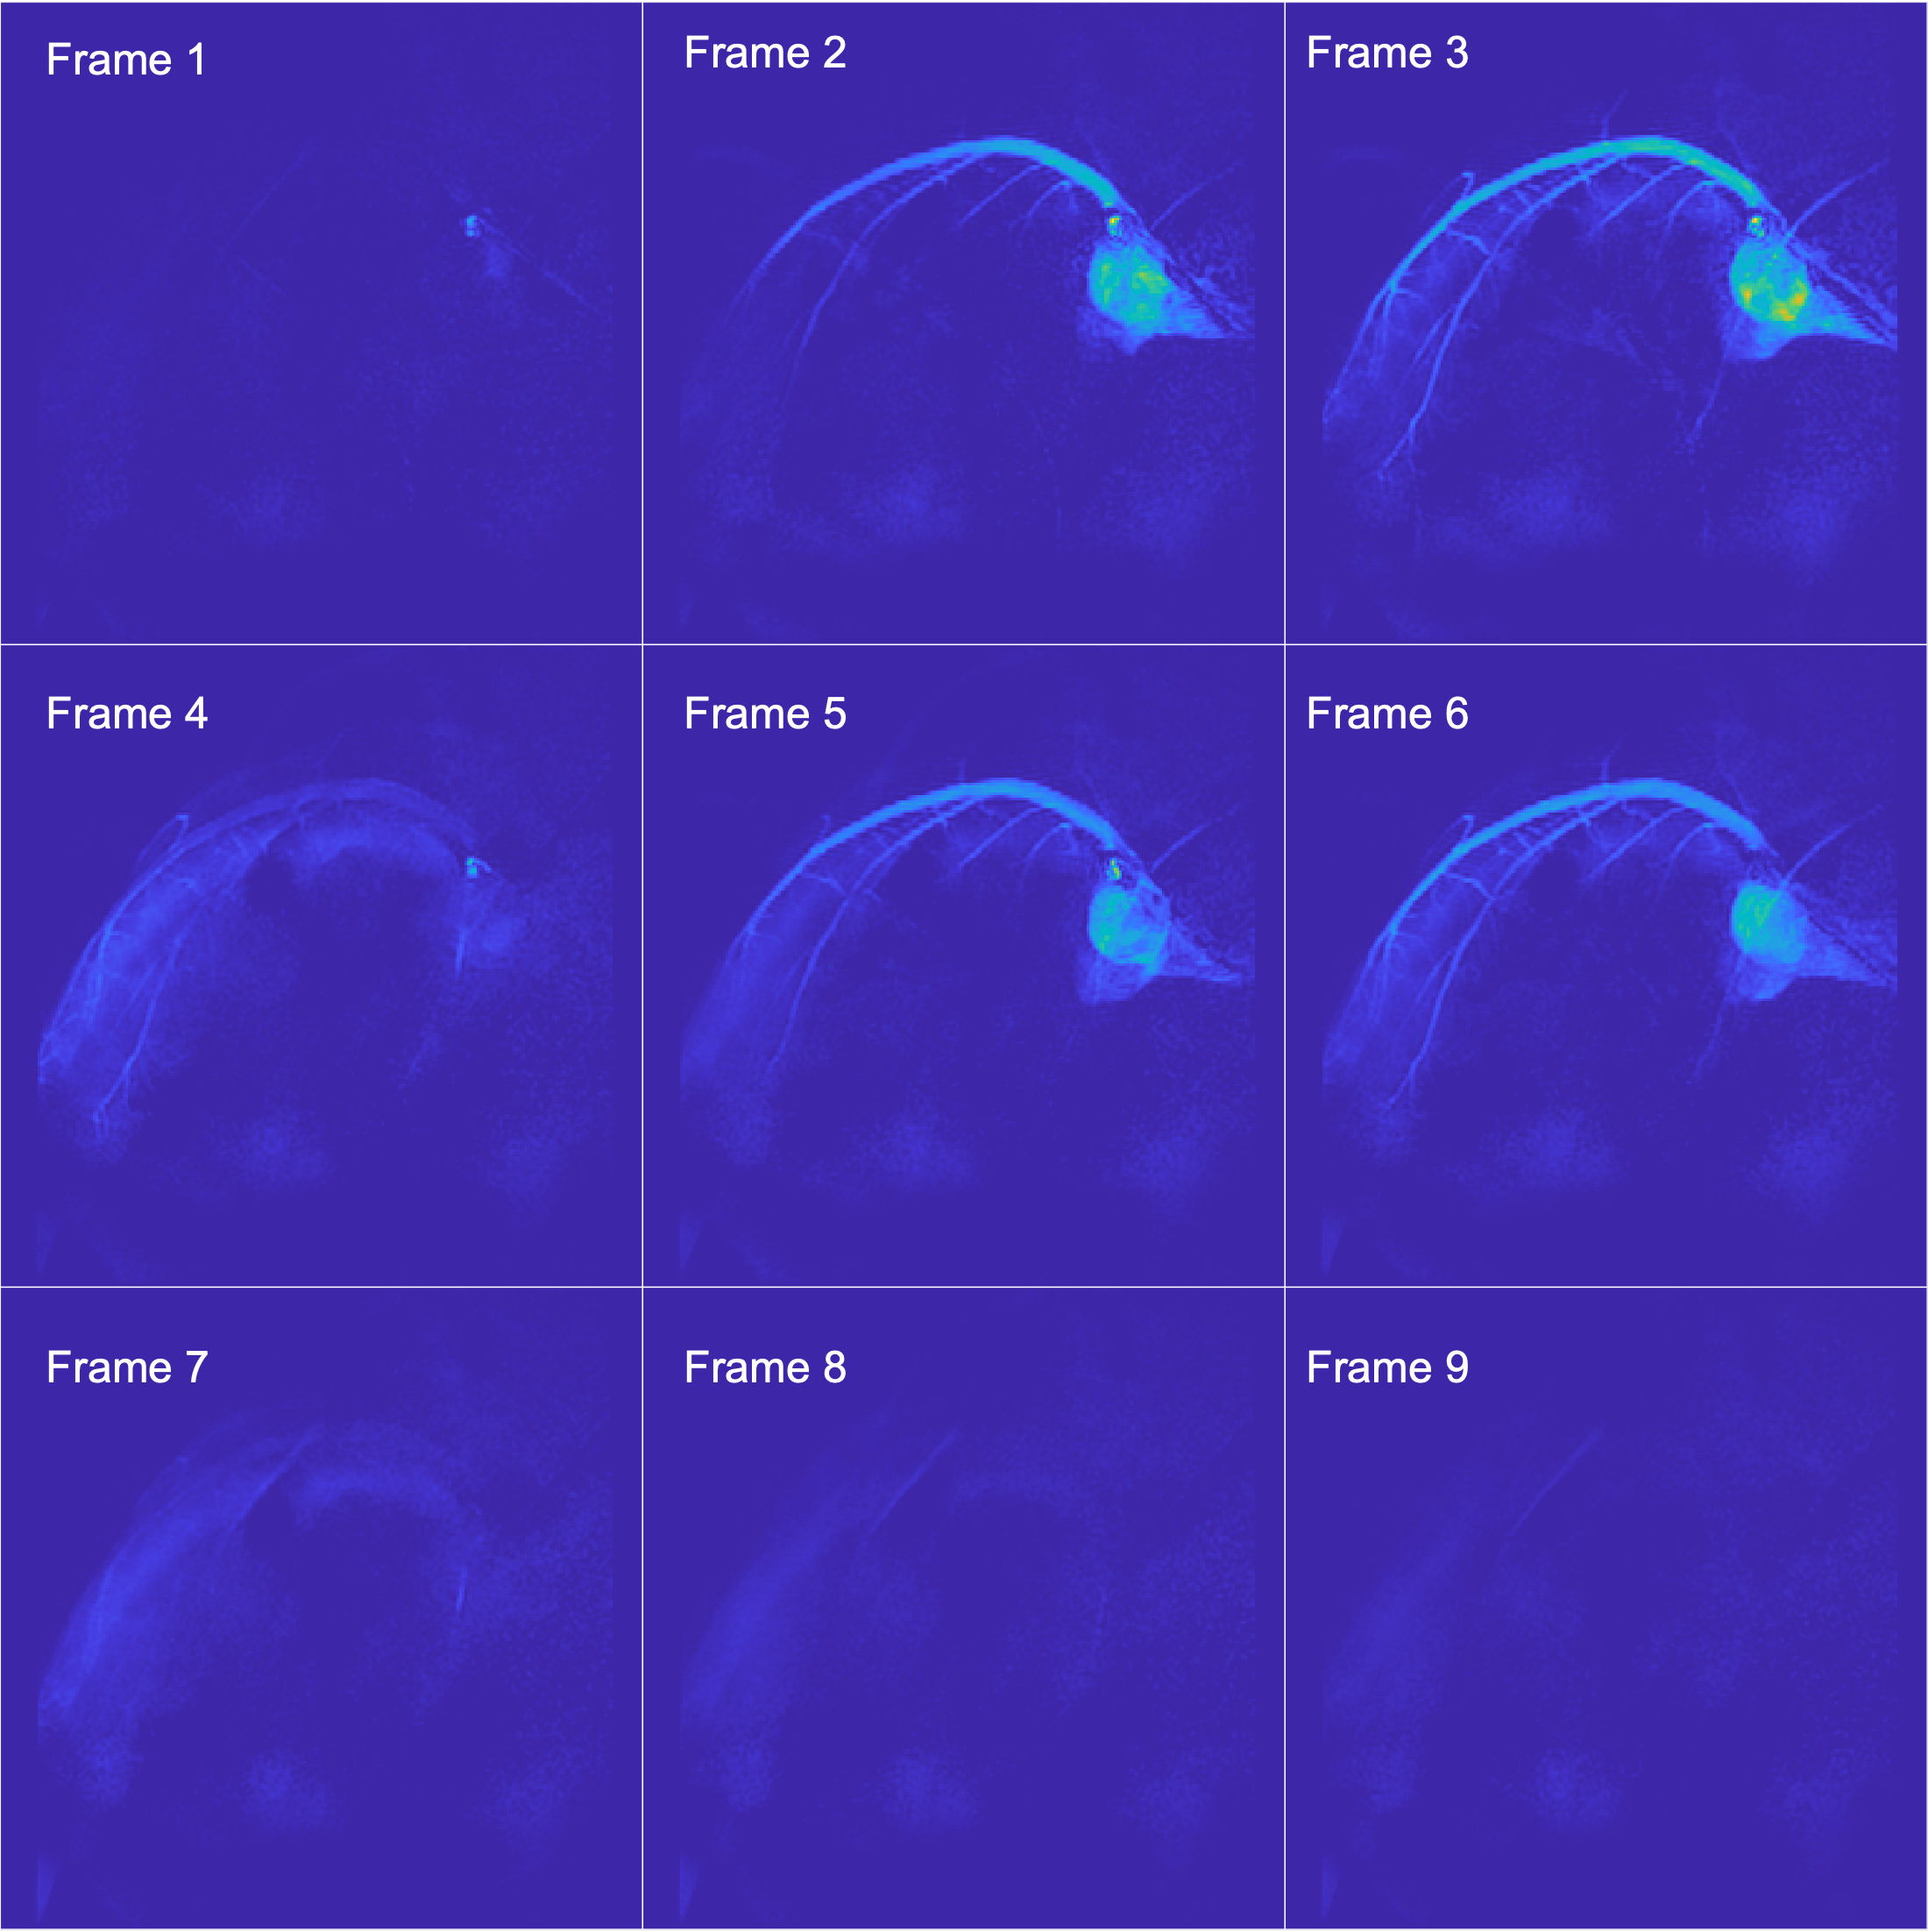
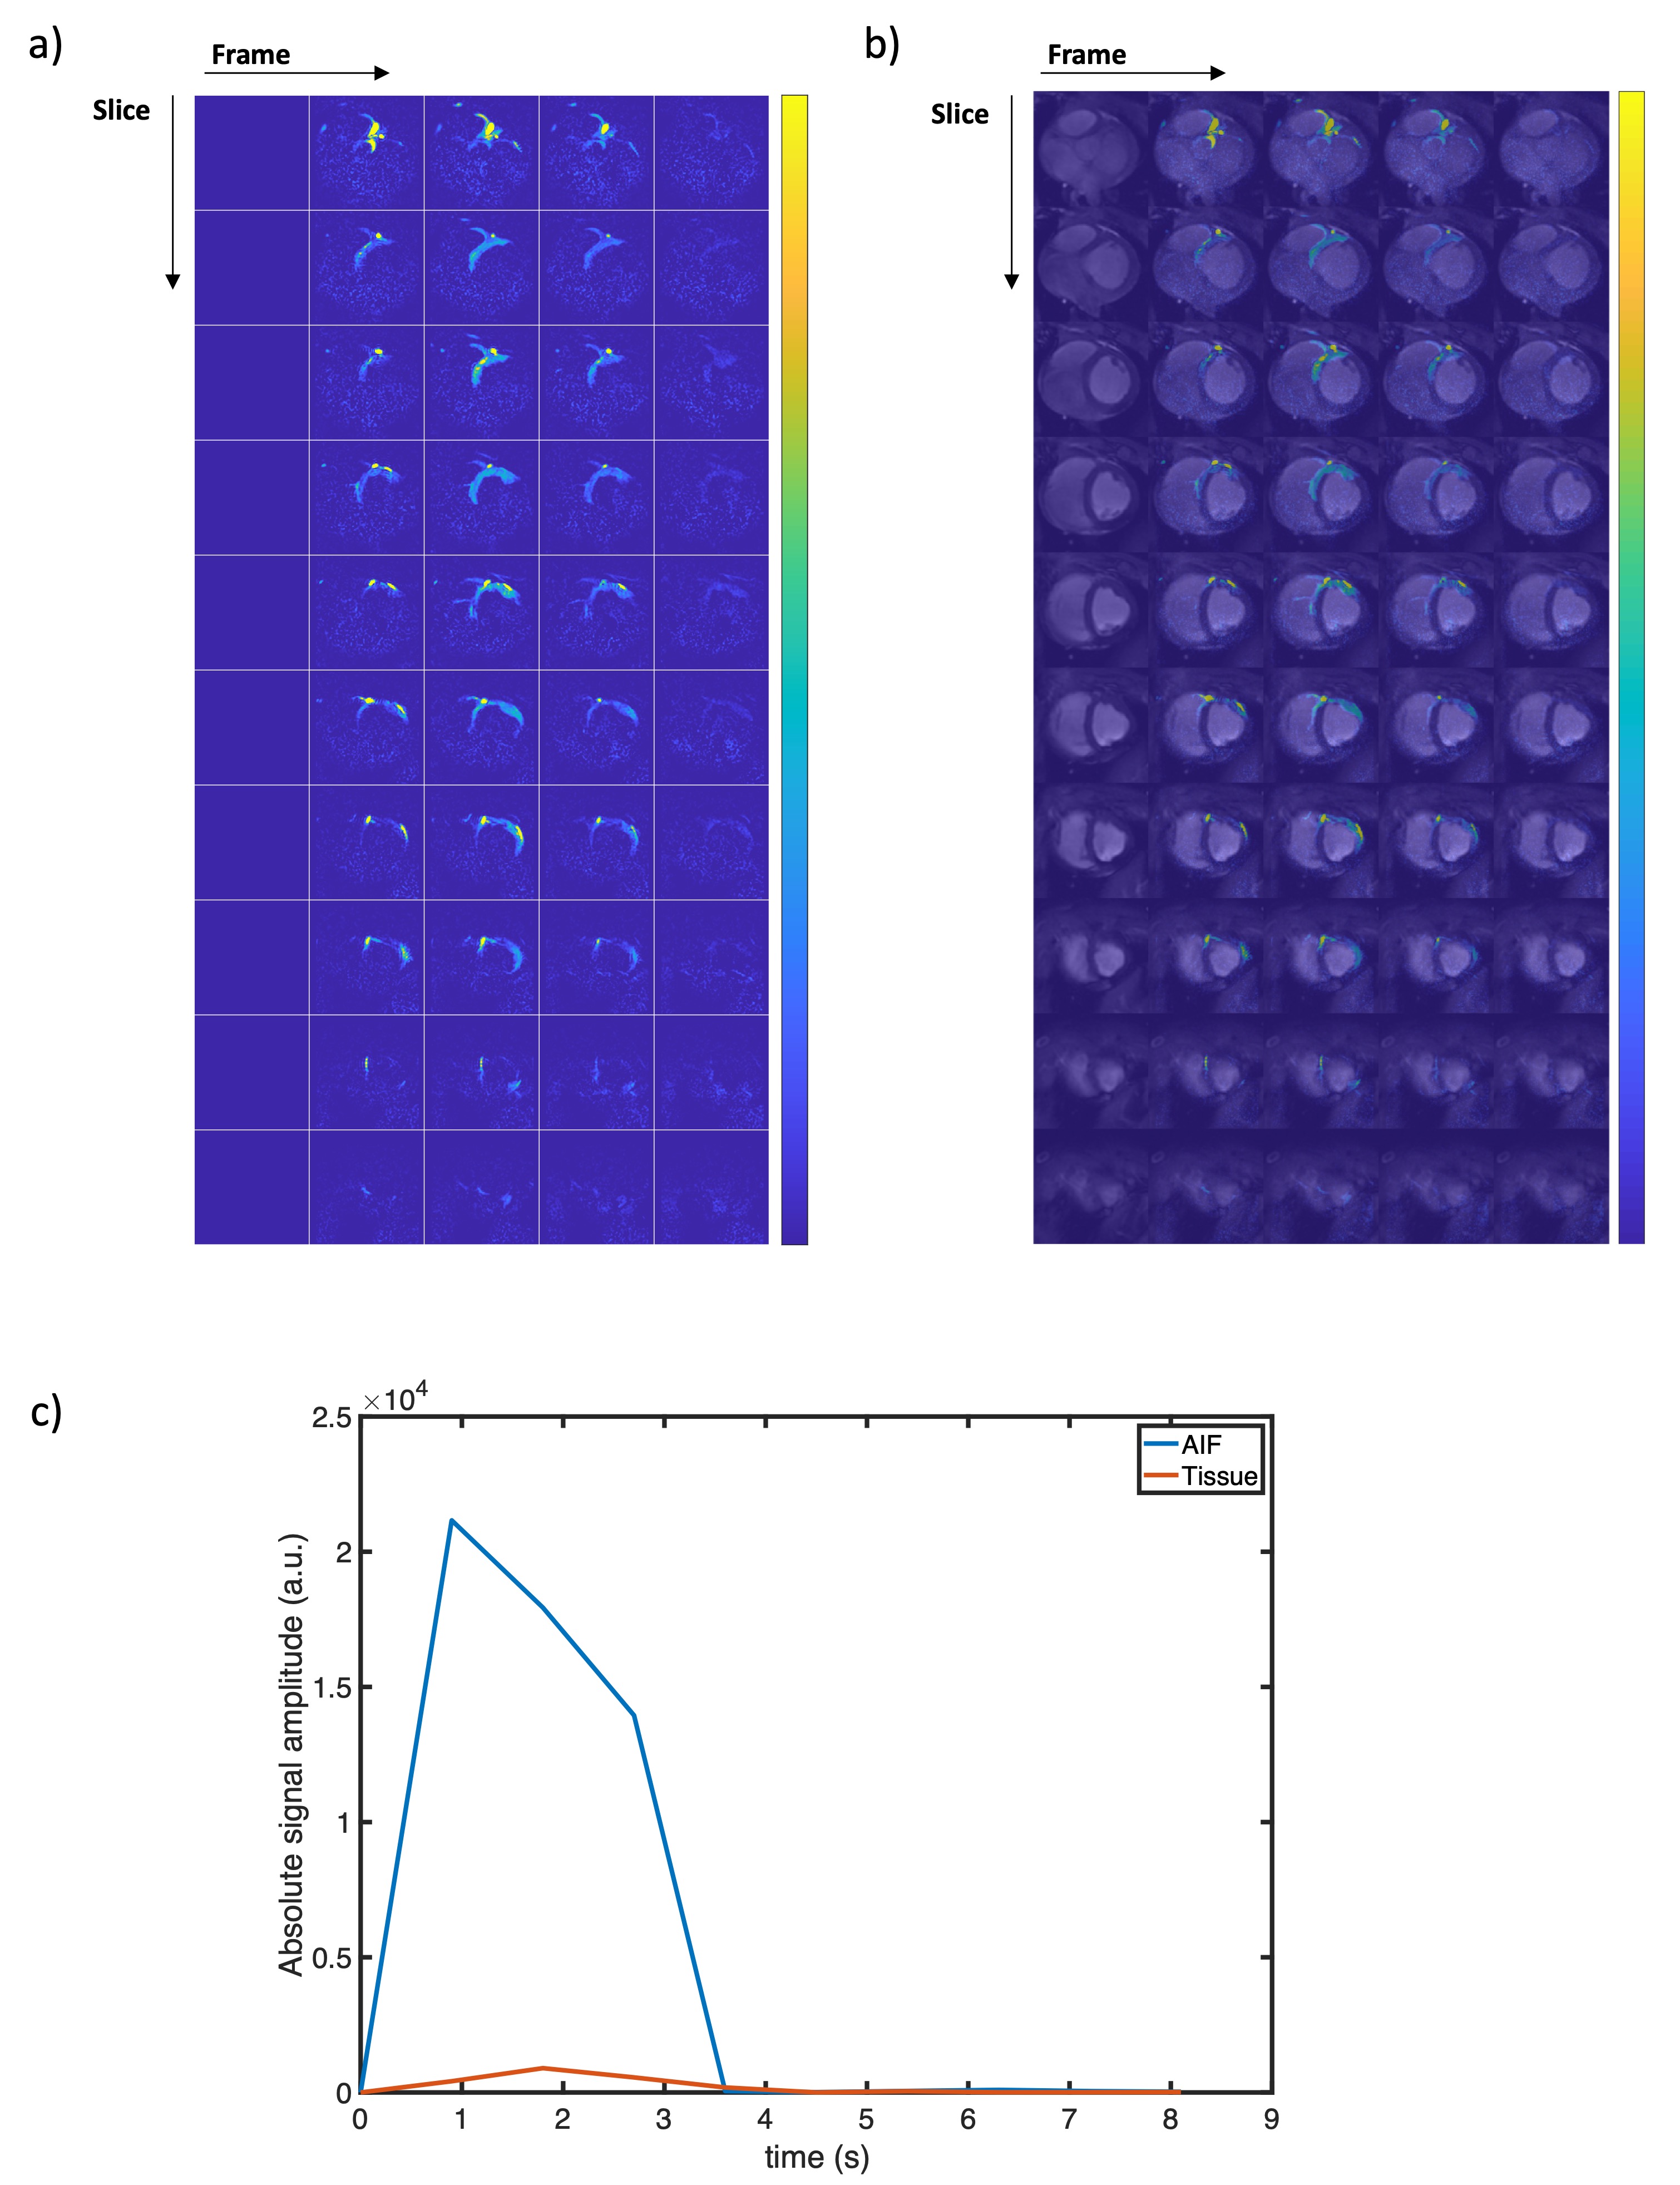
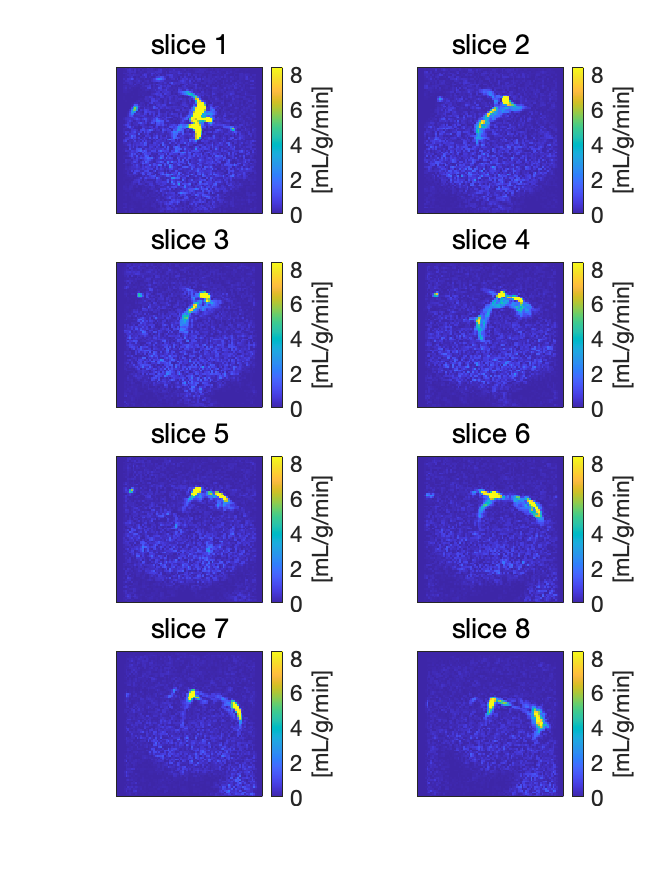
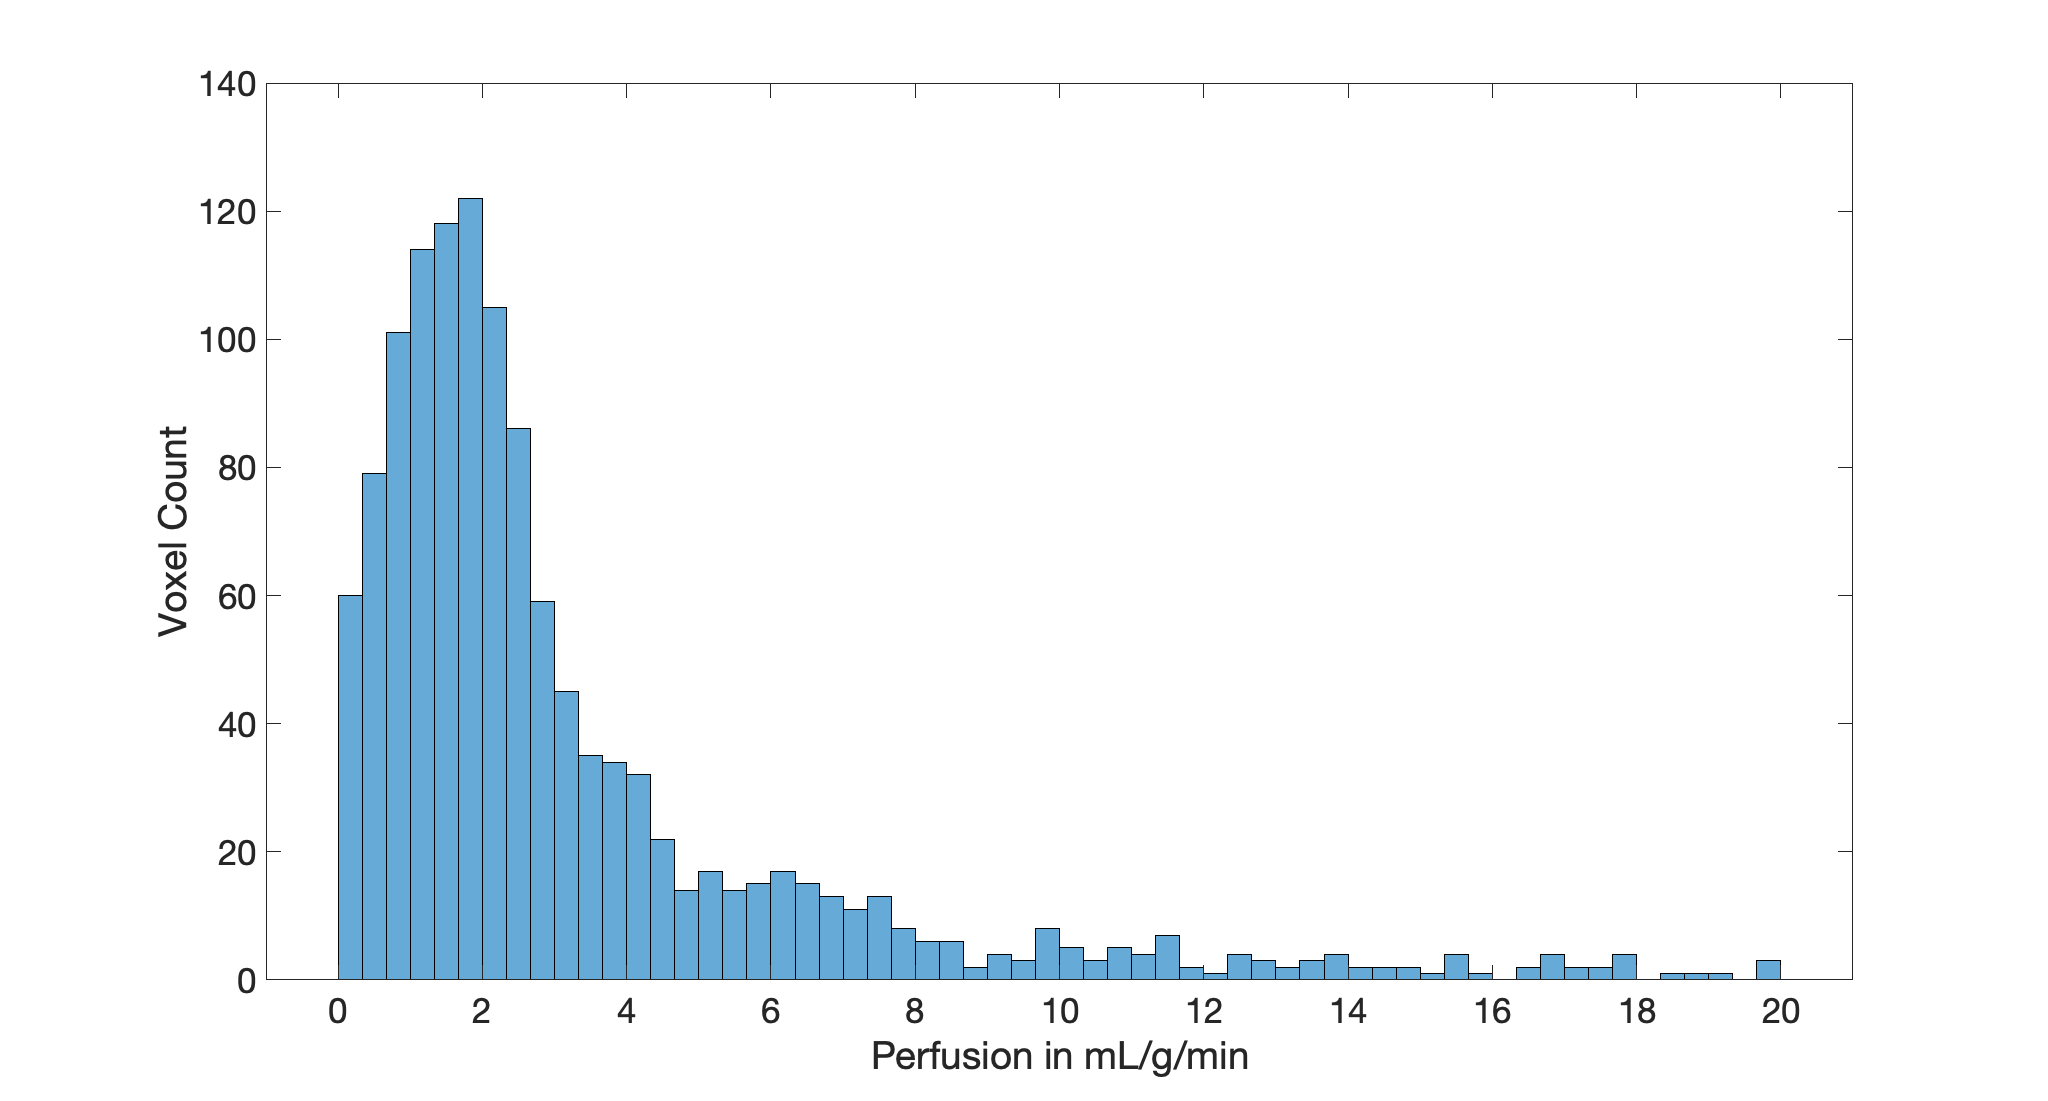
With a measured T1 of 30±1 s at 1.4 T and 28 °C, the estimated polarization of the sample at the time of injection (23±2 s transfer time) is approximately 10±2 %. Figure 1 shows the dynamic left circumflex coronary artery images. The resolution is sufficient to resolve small vessels at the end of branches. Comparing the proposed method with the literature [1,3], the proposed method can achieve submillimeter spatial resolution and better image quality from visual comparison. Figure 2a) and b) show dynamic myocardial perfusion images. Due to the catheter placement, only the myocardium supplied by the left circumflex artery is perfused. Figure 2c) shows the AIF and an example tissue curve. The latter is from a single voxel manually selected inside the myocardium. Figure 3 shows quantitative perfusion maps and Figure 4 shows the histogram of perfusion values inside the signal region, which is drawn manually based on dynamic perfusion-weighted images to cover both arterial and perfused tissue regions. The most frequent estimated perfusion values are around 2 mL/g/min, which is in the range of literature rest perfusion values of 1-2 mL/g/min [7]. Due to using invasive catheterisation procedures, the method's clinical application is limited. However, it can be applied in particular situations, e.g. validation studies. Also, the range of application may potentially be broadened with improved polarisation or increased sample volume.Conclusion
The study has demonstrated the feasibility of high-resolution cardiac motion free coronary MRA and 3D whole heart quantitative myocardial perfusion estimation using hyperpolarized water.Acknowledgements
No acknowledgement found.References
- Olsson LE, Chai CM, Axelsson O, Karlsson M, Golman K, Petersson JS. MR coronary angiography in pigs with intraarterial injections of a hyperpolarized 13C substance. Magn Reson Med. 2006;55(4):731-737. doi:10.1002/mrm.20847
- Deshpande VS, Shea SM, Laub G, Simonetti OP, Finn JP, Li D. 3D magnetization-prepared true-FISP: a new technique for imaging coronary arteries. Magn Reson Med. 2001;46(3):494-502. doi:10.1002/mrm.1219
- Lipsø KW, Hansen ESS, Tougaard RS, Laustsen C, Ardenkjaer-Larsen JH. Dynamic coronary MR angiography in a pig model with hyperpolarized water. Magn Reson Med. 2018;80(3):1165-1169. doi:10.1002/mrm.27088
- Wigh Lipsø K, Hansen ESS, Tougaard RS, Laustsen C, Ardenkjaer-Larsen JH. Renal MR angiography and perfusion in the pig using hyperpolarized water. Magn Reson Med. 2017;78(3):1131-1135. doi:10.1002/mrm.26478
- Pinon AC, Capozzi A, Ardenkjær-Larsen JH. Hyperpolarized water through dissolution dynamic nuclear polarization with UV-generated radicals. Commun Chem. 2020;3(1):1-9. doi:10.1038/s42004-020-0301-6
- Hanson LG, Henrik L, Klærke MI. Estimation of perfusion and other vascular parameters from first part of bolus passage. 2009 ISMRM ISMRT Annu Meet Exhib.
- Husso M, Nissi MJ, Kuivanen A, et al. Quantification of porcine myocardial perfusion with modified dual bolus MRI – a prospective study with a PET reference. BMC Med Imaging. 2019;19(1):1-11. doi:10.1186/s12880-019-0359-8
Figures