3071
Task Activation of Human Occipital Lobe Results in Hyperpolarized 13C-Lactate Signal Increase1Department of Medical Biophysics, University of Toronto, Toronto, ON, Canada, 2Physical Sciences, Sunnybrook Research Institute, Toronto, ON, Canada, 3Department of Radiation Oncology, Sunnybrook Health Sciences Centre, Toronto, ON, Canada, 4GE Healthcare, Toronto, ON, Canada, 5Pharmacy, Sunnybrook Health Sciences Centre, Toronto, ON, Canada, 6Molecular Pharmacology Program, Memorial Sloan Kettering Cancer Center, New York City, NY, United States
Synopsis
Keywords: Hyperpolarized MR (Non-Gas), Hyperpolarized MR (Non-Gas)
Motivation: Increases in lactate production are believed to occur in occipital lobe regions in response to visual stimuli.
Goal(s): In this study, whole-brain hyperpolarized-13C MRI was used to investigate how a visual stimulus affects occipital lobe 13C-lactate signal in healthy human volunteers.
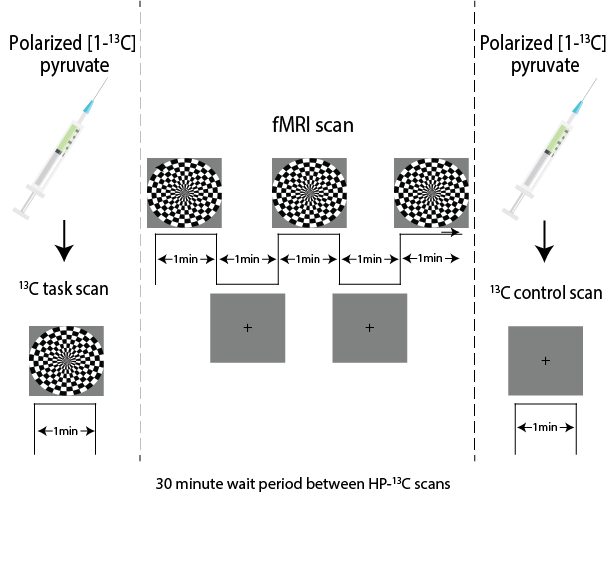
Approach: A set of two hyperpolarized-13C MRI scans were done. Participants (n = 6) viewed a flashing checkerboard stimulus during one of the 13C scans, and had their eyes closed for the second 13C scan.
Results: Increased 13C-lactate signal was observed in the visual stimulus scans when compared to the eyes-closed scans in occipital lobe regions relative to non-occipital lobe regions.
Impact: We have shown that hyperpolarized-13C MRI is capable of measuring differences in 13C-lactate signal in response to a visual stimuli. These findings support the idea of increases in lactate production in response to stimulus. Future studies will explore other stimuli.
Introduction
Hyperpolarized-13C MRI (HP-13C MRI) is a minimally invasive technique that enables imaging of 13C-pyruvate and labelled downstream products such as 13C-lactate and 13C-bicarbonate. A prior study using HP-13C MR found increased 13C-bicarbonate signal in the occipital lobe during functional activation, attributed to increased pyruvate oxidation1. In this study, whole-brain HP-13C MR was performed to compare regional 13C-metabolites between visual stimulus conditions.Methods
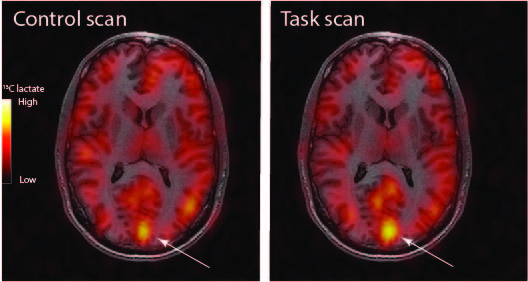
Cognitively normal volunteers (N=6) were recruited under a protocol approved by the Sunnybrook Research Institute Research Ethics Board and Health Canada. Participants' age ranged from 24 to 33, and were all screened for cognitive impairment using the Montreal Cognitive Assessment2.'Task' and 'control' HP-13C MR scans were acquired for every participant using a previously described 3D-echo-planar sequence3,4. The task scan involved the participant viewing a 8Hz flashing checkerboard stimulus during the HP-13C MR acquisition. During the control scan the participant had their eyes closed. There was a half-hour wait period between the two HP-13C scans. During this interval, anatomical and BOLD fMRI images were acquired. The ordering of the task and control HP-13C scans was swapped for three participants to control for scan order effects. HP-13C MR images were reconstructed in MATLAB (The MathWorks Inc., Natick, MA). A block-design was used for the BOLD scans with the same minute-long block duration as a single HP-13C MR task acquisition (Fig. 1). A set of example control and task 13C-lactate scans are shown in Fig. 2.
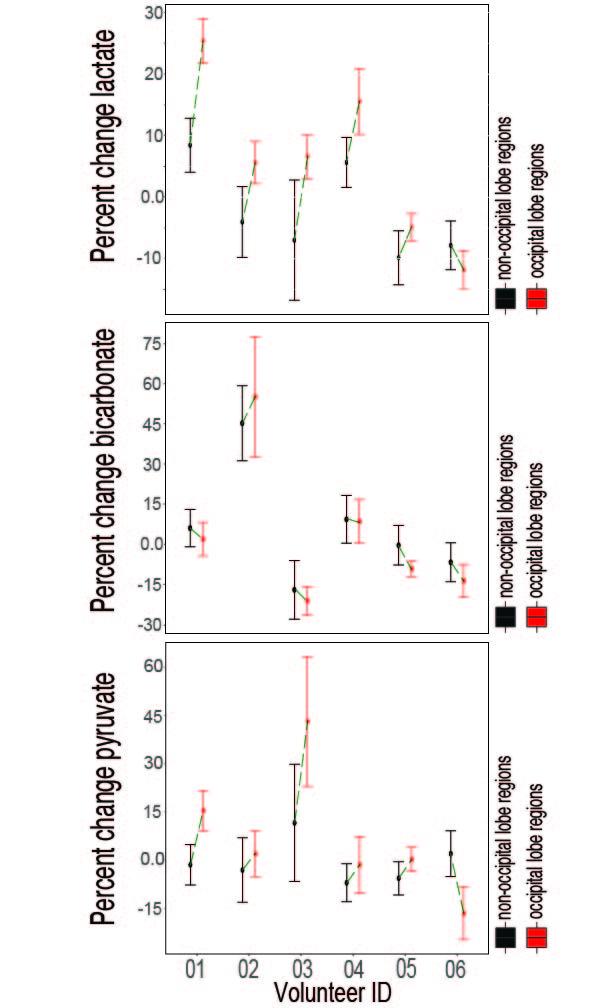
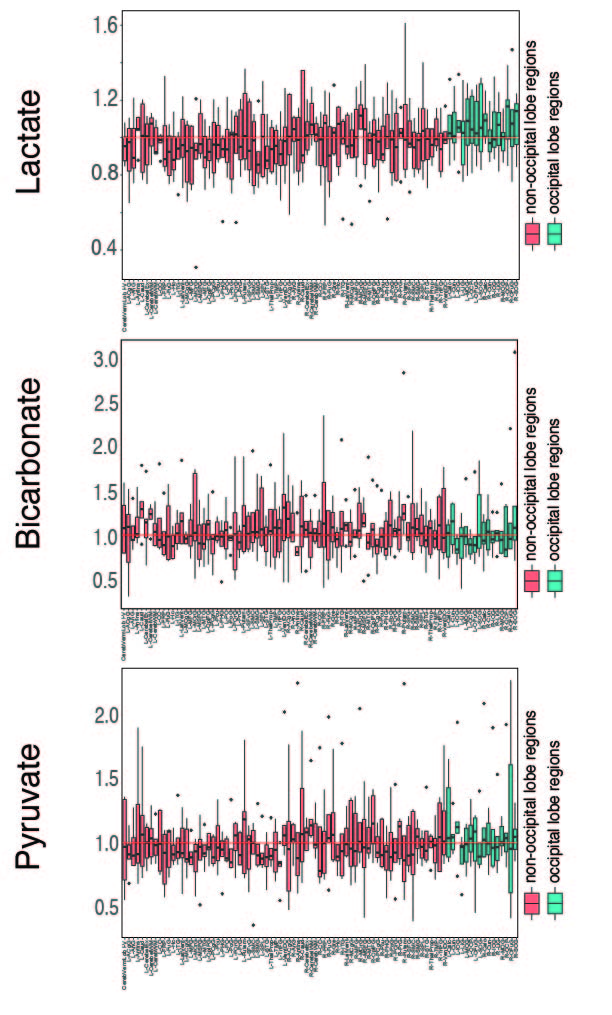
For image analysis, anatomical T1w images were parcellated using an automatic parcellation method5, and regions with volume below the 1.5cm3 HP-13C voxel resolution were excluded, resulting in 89 brain regions. The parcellation map for each participant was used to compute regional 13C-pyruvate, 13C-lactate, and 13C-bicarbonate. Regional 13C-metabolite signals were normalized by the 13C-metabolite signal from the brainstem to remove inter-scan 13C polarization variability. The brainstem normalized 13C-metabolite signal from the task scan was divided by the brainstem normalized control scan 13C-metabolite signal, resulting in a single set of regional ratios of 13C-metabolite signal for each participant (referred to as task/control signal ratio below). Task/control signal ratio were grouped into occipital and non-occipital lobe regions, as the occipital lobe contains visual processing areas. A one-tailed Datta-Sutten clustered Wilcoxon rank-sum test was run to test for a difference in metabolism between occipital lobe regions relative to non-occipital lobe regions6. The percentage change between normalized 13C-metabolite task and control scans were calculated for each participant, grouped by non-occipital lobe and occipital lobe regions (Fig. 3). Region-specific task/control signal ratios were plotted for all assessed brain regions, with color coding indicating occipital lobe and non-occipital lobe regions in Fig. 4.
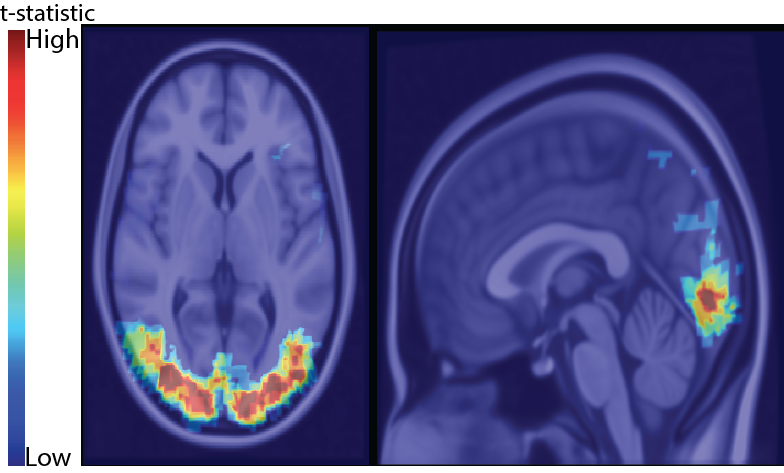
The fMRI scan parameters were as follows: 3.5 mm isotropic resolution, 2000 ms repetition time, 29 ms echo time, 40o flip angle, 64 by 64 matrix size, 38 slices. BOLD image analysis was performed using the AFNI toolbox7,8, and involved removal of the first two TRs of each acquisition, registering across time to reduce motion artifacts, and applying a Gaussian blur function. BOLD images were regressed against the task paradigm and voxelwise t-statistics were calculated. BOLD activation was consistently achieved in the occipital lobe in all six participants with the designed task block design. A representative t-statistic map was created by registering the BOLD images of the six volunteers to the MNI152 brain standard9, and summing the final results (Fig. 5).
Results and Discussion
A significant difference in the 13C-lactate task/control signal ratios between occipital lobe regions and non-visual regions was found (p = 0.04, Z= -1.8). Neither the 13C-bicarbonate nor 13C-pyruvate signal ratios showed a difference (p = 0.98, Z = 2.0 and p = 0.19, Z = -0.9 respectively). Occipital lobe regions are consistently increased in the task 13C-lactate scans for five out of six participants. Small increases in 13C-pyruvate signal can be observed in the same set of participants, but no noticeable difference is seen between conditions in 13C-bicarbonate. These results are consistent with prior studies that have observed increases in lactate signal during visual stimulus10,11. Interestingly, the difference in 13C-lactate signal between occipital lobe and non-occipital lobe regions appears to result from a bidirectional change: non-occipital lobe regions had slightly reduced 13C-lactate production during the visual stimulus, while occipital lobe regions had increased 13C-lactate signal.Conclusion
Increased 13C-lactate production in occipital lobe regions relative to non-occipital lobe regions was observed during a visual task using hyperpolarized-13C MRI. Future studies will explore the mechanism behind this signal change.Acknowledgements
Funding support from the Canadian Institutes for Health Research grant PJT152928.References
[1] Maheen Zaidi1 et al. “Assessment of human brain pyruvate oxidation using functional hyperpolarized 13C MRS”. In: Proceedings of the Joint Annual ISMRM-ESMRMB 2022, and ISMRT Annual Meeting, London, UK(2022).
[2] Ziad S Nasreddine et al. “Montreal cognitive assessment”. In: The American Journal of Geriatric Psychiatry (2003).
[3] Casey Y Lee et al. “Lactate topography of the human brain using hyperpolarized 13C-MRI”. In: Neuroimage 204 (2020), p. 116202.
[4] Biranavan Uthayakumar et al. “Age-associated change in pyruvate metabolism investigated with hyperpolarized 13C-MRI of the human brain”. In: Human Brain Mapping (2023).
[5] Yuankai Huo et al. “3D whole brain segmentation using spatially localized atlas network tiles”. In: NeuroImage 194 (2019), pp. 105–119.
[6] Somnath Datta and Glen A Satten. “Rank-sum tests for clustered data”. In: Journal of the American Statistical Association 100.471 (2005), pp. 908–915.
[7] Robert W Cox. “AFNI: software for analysis and visualization of functional magnetic resonance neuroimages”. In: Computers and Biomedical research 29.3 (1996), pp. 162–173.
[8] Robert W Cox and James S Hyde. “Software tools for analysis and visualization of fMRI data”. In: NMR in Biomedicine: An International Journal Devoted to the Development and Application of Magnetic Resonance In Vivo 10.4-5 (1997), pp. 171–178.
[9] John C Mazziotta et al. “A probabilistic atlas of the human brain: theory and rationale for its development”. In: Neuroimage 2.2 (1995), pp. 89–101.
[10] Jeffrey A Stanley and Naftali Raz. “Functional magnetic resonance spectroscopy: the “new” MRS for cognitive neuroscience and psychiatry re-search”. In: Frontiers in psychiatry 9 (2018), p. 76.
[11] James Prichard et al. “Lactate rise detected by 1H NMR in human visual cortex during physiologic stimulation.” In: Proceedings of the national academy of sciences 88.13 (1991), pp. 5829–5831.
Figures