3070
Repeatability of Hyperpolarized [1-13C]pyruvate MRI Cardiac Metabolism Measurements in Humans1Radiology and Biomedical Imaging, University of California - San Francisco, San Francisco, CA, United States, 2Medicine - Cardiology, University of California - San Francisco, San Francisco, CA, United States
Synopsis
Keywords: Hyperpolarized MR (Non-Gas), Metabolism
Motivation: Hyperpolarized (HP) 13C-pyruvate MRI is an emerging tool with the potential to provide unprecedented measurements of cardiac metabolism.
Goal(s): The goal of this work was to measure the repeatability of HP 13C-pyruvate, which is important for designing clinical trials and identifying opportunities to improve the technique.
Approach: Two HP 13C-pyruvate scans were performed in a single session approximately 15 minutes apart in healthy volunteers who were in the fed state.
Results: We measured no statistically significant differences between scans and measured the coefficient of variance of metabolism quantifications using pharmacokinetic rate constants. Blood glucose changed between scans and can affect the metabolism measurements.
Impact: These assessments of repeatability of Hyperpolarized 13C-pyruvate MRI in the human heart will support the design of clinical trials and also guide where potential improvements are required to improve measurements of metabolism.
Introduction
Hyperpolarized [1-13C] pyruvate imaging is a novel technique used to study metabolism across the body including measurements of glycolysis, anaerobic glycolysis and Krebs cycle flux. In the heart, it permits investigation of myocardial substrate selection and metabolic remodeling that are disrupted in heart disease as well as response to ischemic injuries(1–3).Recent technological advances have enabled this technology to move to human clinical trials in the heart(4). To pave the path for the next step towards translation to clinic, guidelines for normative metabolic measures must be established. Previous feasibility studies demonstrated hyperpolarized [1-13C] pyruvate can be used for whole heart imaging and regional metabolism quantifications of pyruvate-to-lactate conversion via lactate dehydrogenase (LDH) and Krebs cycle flux from pyruvate-to-bicarbonate conversion via pyruvate dehydrogenase (PDH)(5). Early stage patient imaging studies have shown: decreased myocardial PDH activity measures following chemotherapy in breast cancer patients(6); reduced PDH and increased LDH activity measures in type 2 diabetes mellitus(7); and reduced PDH activity in non-viable tissue post-myocardial infarction(8).
Test-retest studies determine the inherent variability in measurements, and this study investigates the repeatability of metabolism quantification measurements from hyperpolarized [1-13C] pyruvate in the healthy heart.
Methods
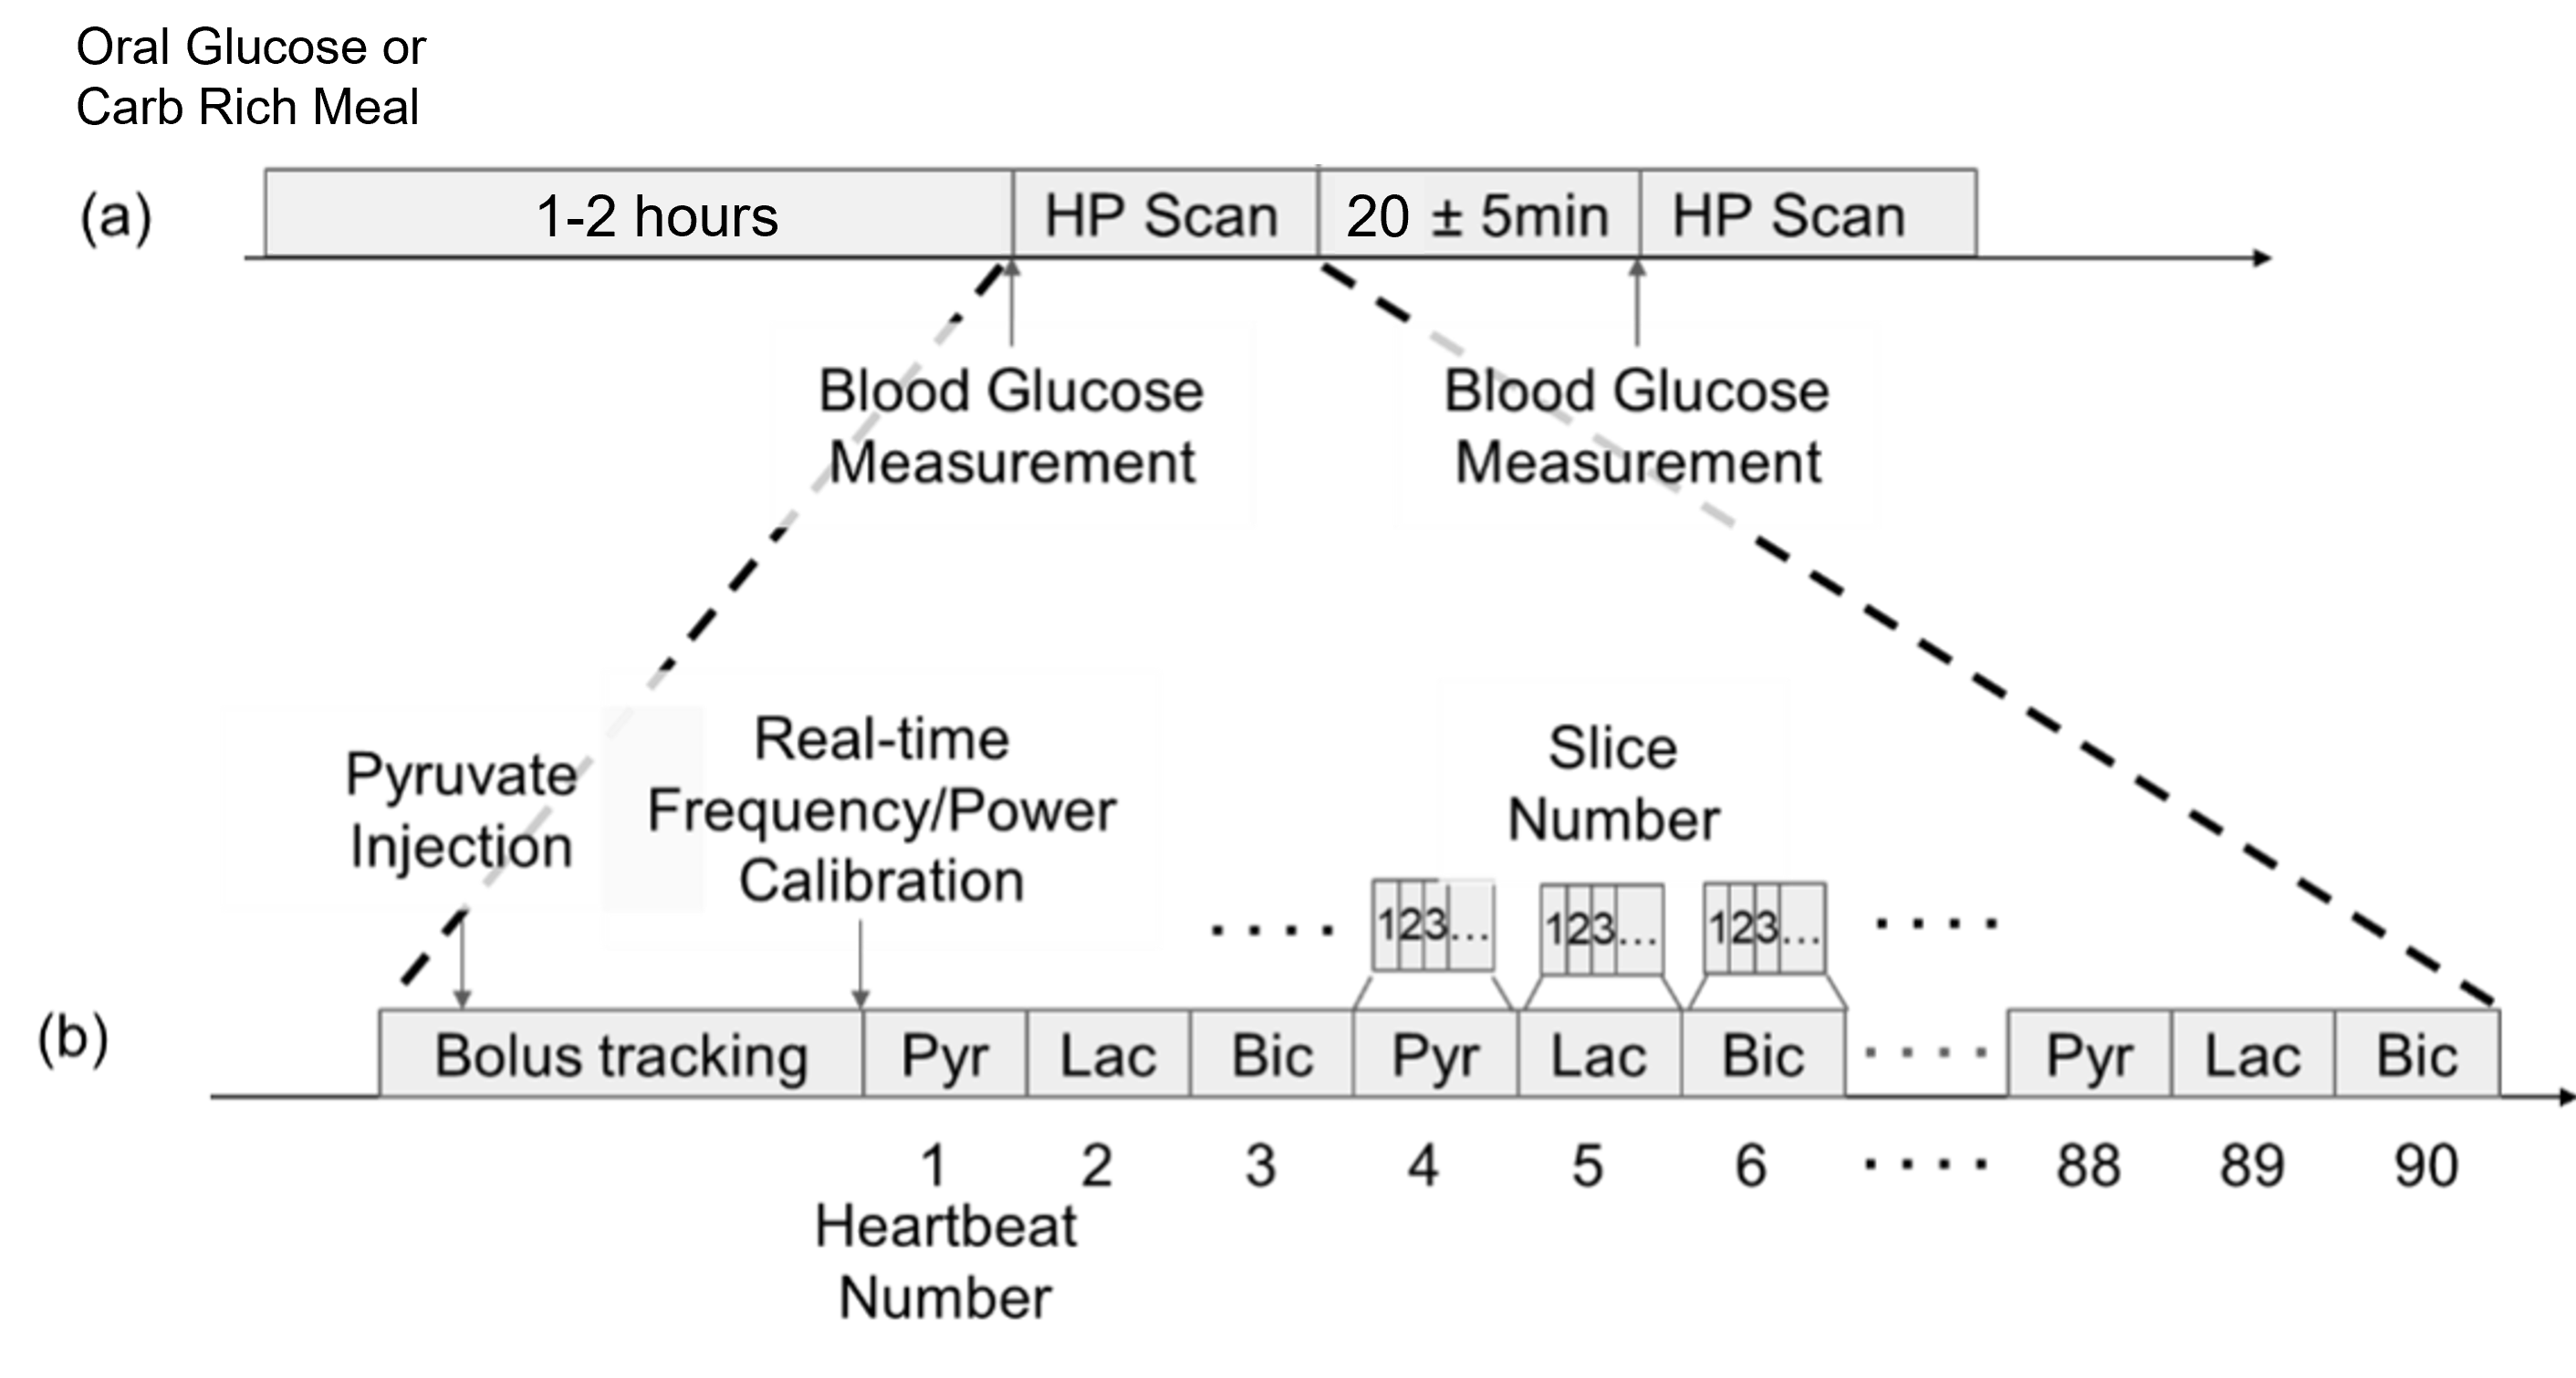
We imaged Six healthy volunteers in a fed metabolic state with two subsequent HP injections, approximately 15-20 minutes apart, leaving all the sequence and timing unchanged (Figure 1). Two volunteers were administered oral glucose solution (30 g) an hour prior to the first injection, two volunteers were asked to come after a carbohydrate-rich meal within 2 hours of the first injection(9), and two volunteers were asked to fast overnight prior to the study and were administered oral glucose solution an hour prior to injection. The last two volunteers came back for an additional scan 1-6 weeks after their first scan to repeat the study. Volunteer blood glucose levels were measured approximately 5 minutes prior to each injection.The HP 1-13C pyruvate scan used an autonomous scanning protocol(10) including metabolite-specific imaging using a spectral-spatial pulse and spiral readout to acquire 2D short-axis images, 1-13C bicarbonate and 1-13C lactate in-plane resolution: 12x12mm, 1-13C pyruvate in-plane resolution: 6x6mm, slice thickness: 21mm, temporal resolution: 3 heartbeats (~3.6s), FA: 20° (pyruvate), 30°(lactate and bicarbonate) (Fig 1). We performed pharmacokinetic modeling using MATLAB code from the hyperpolarized-mri-toolbox(11) to assess the conversion of pyruvate-to-lactate (kPL) and pyruvate-to-bicarbonate (kPB) evaluated in manually drawn ROIS on the LV myocardium.
Results
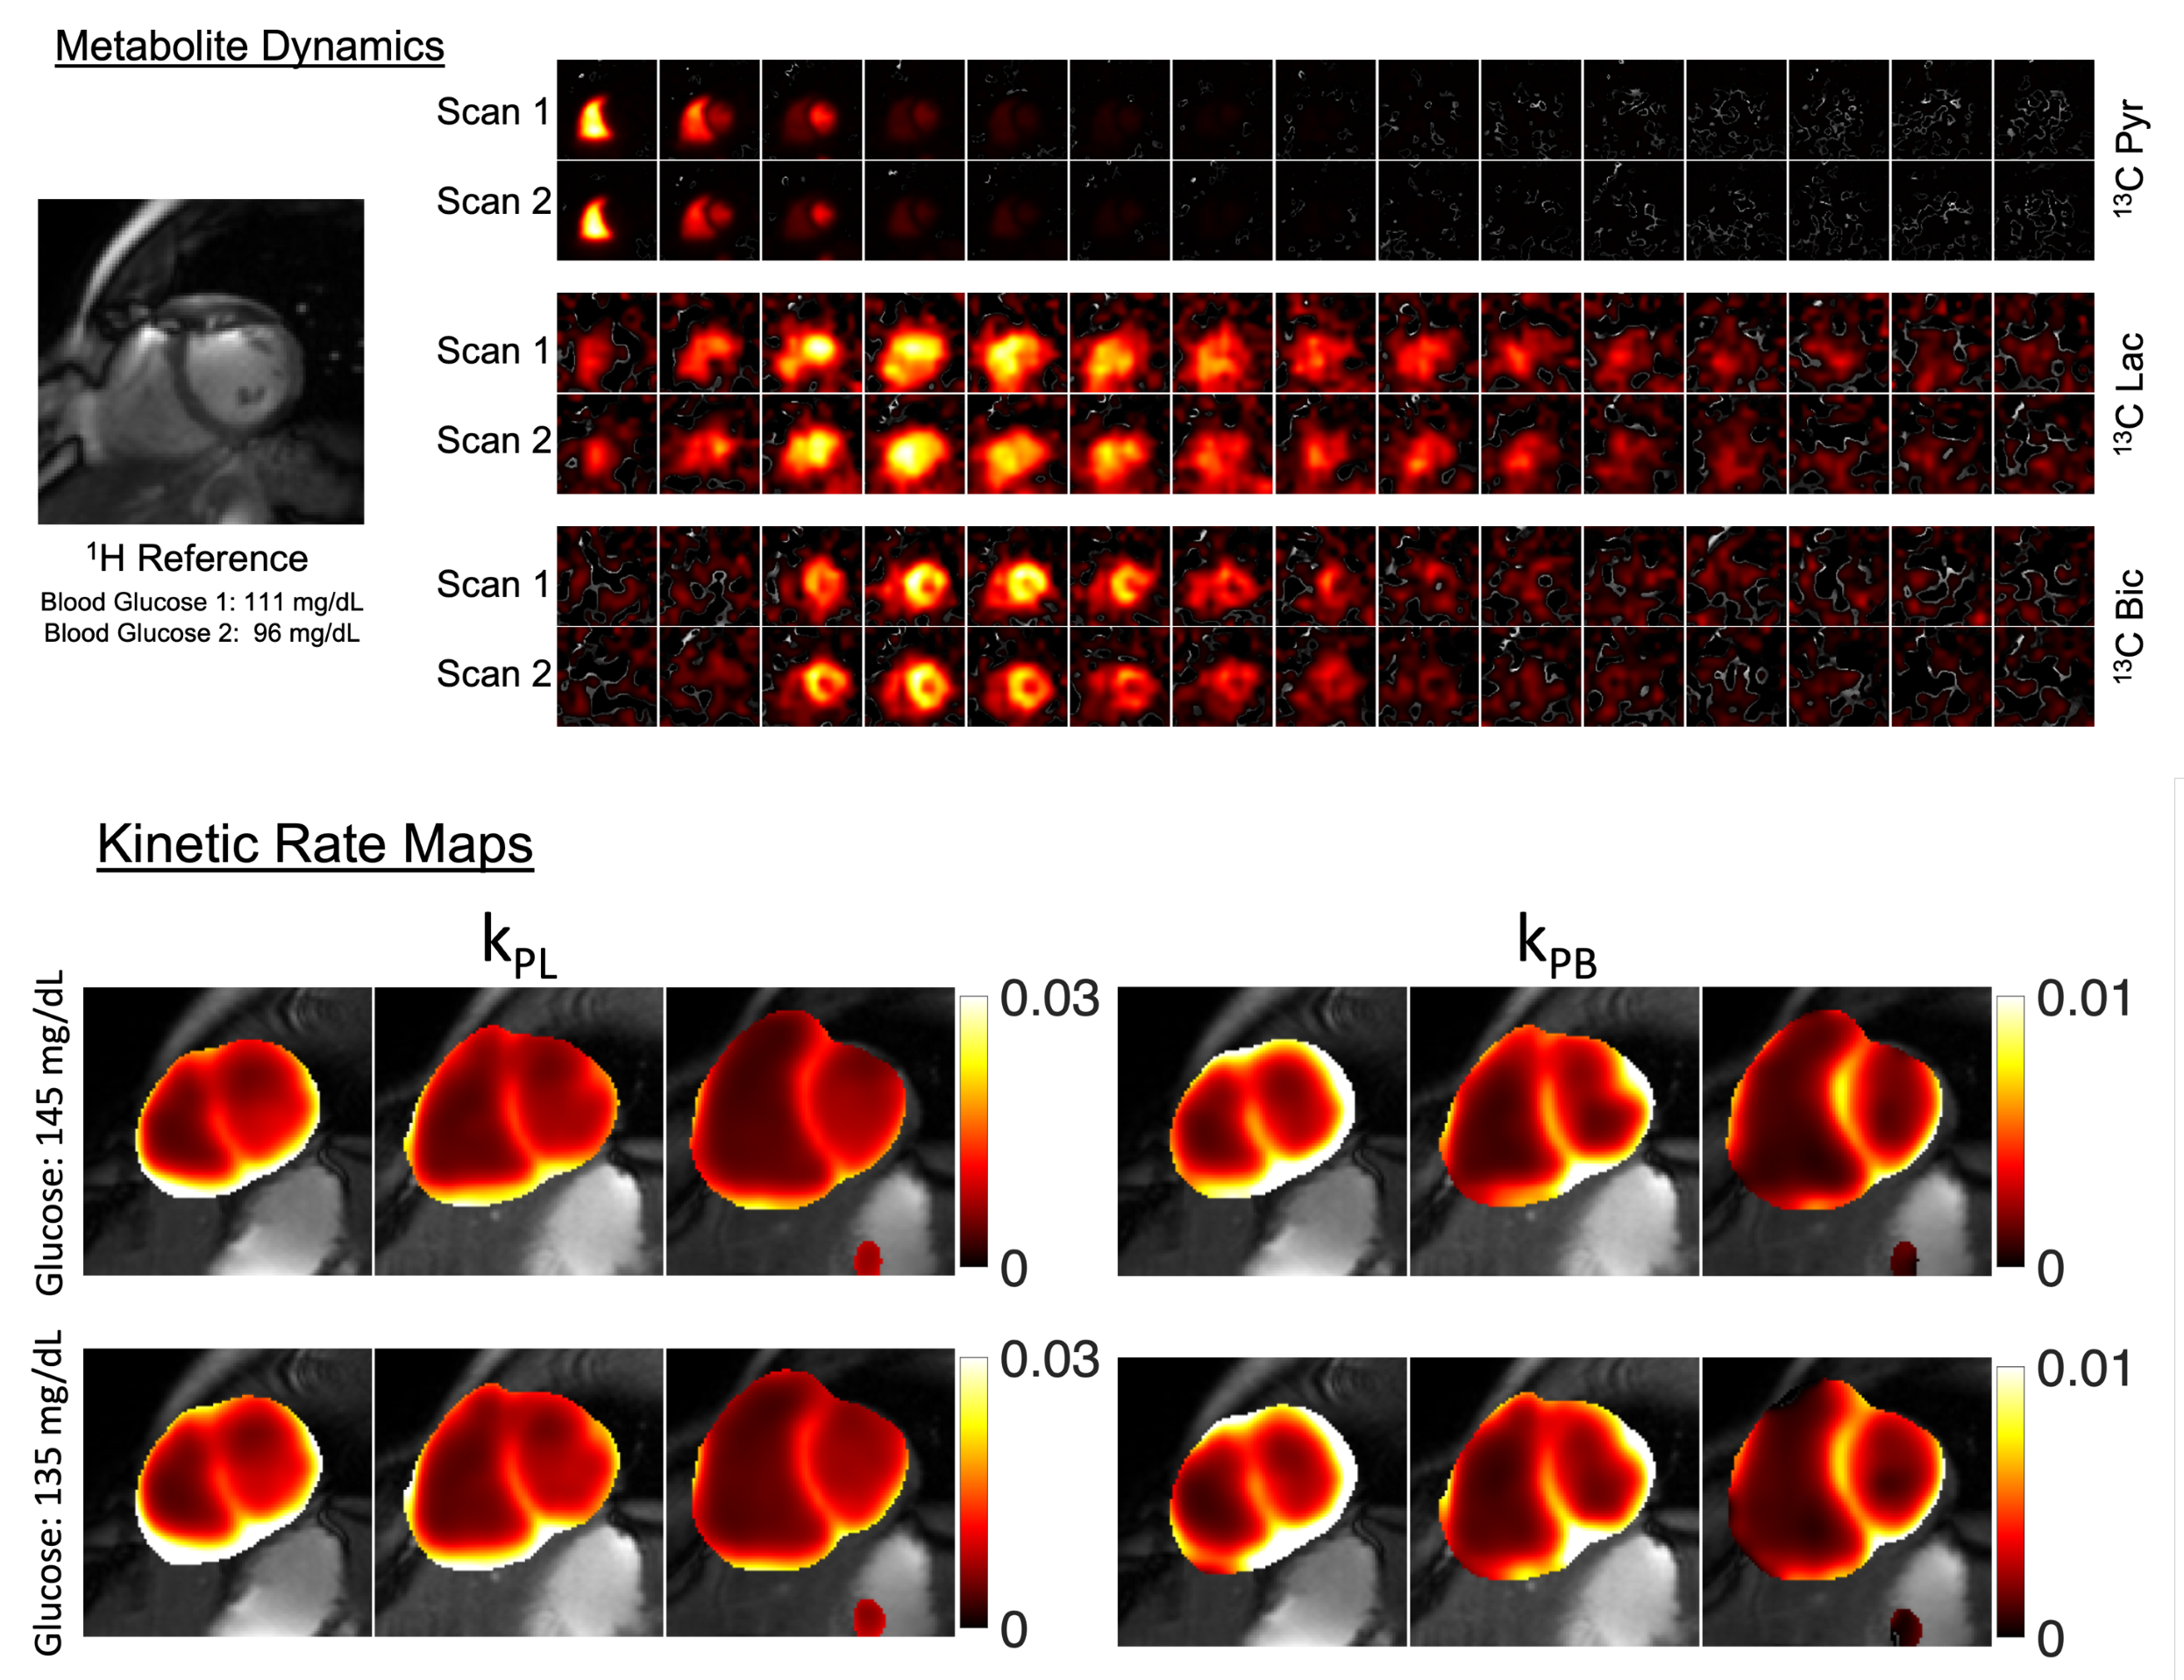
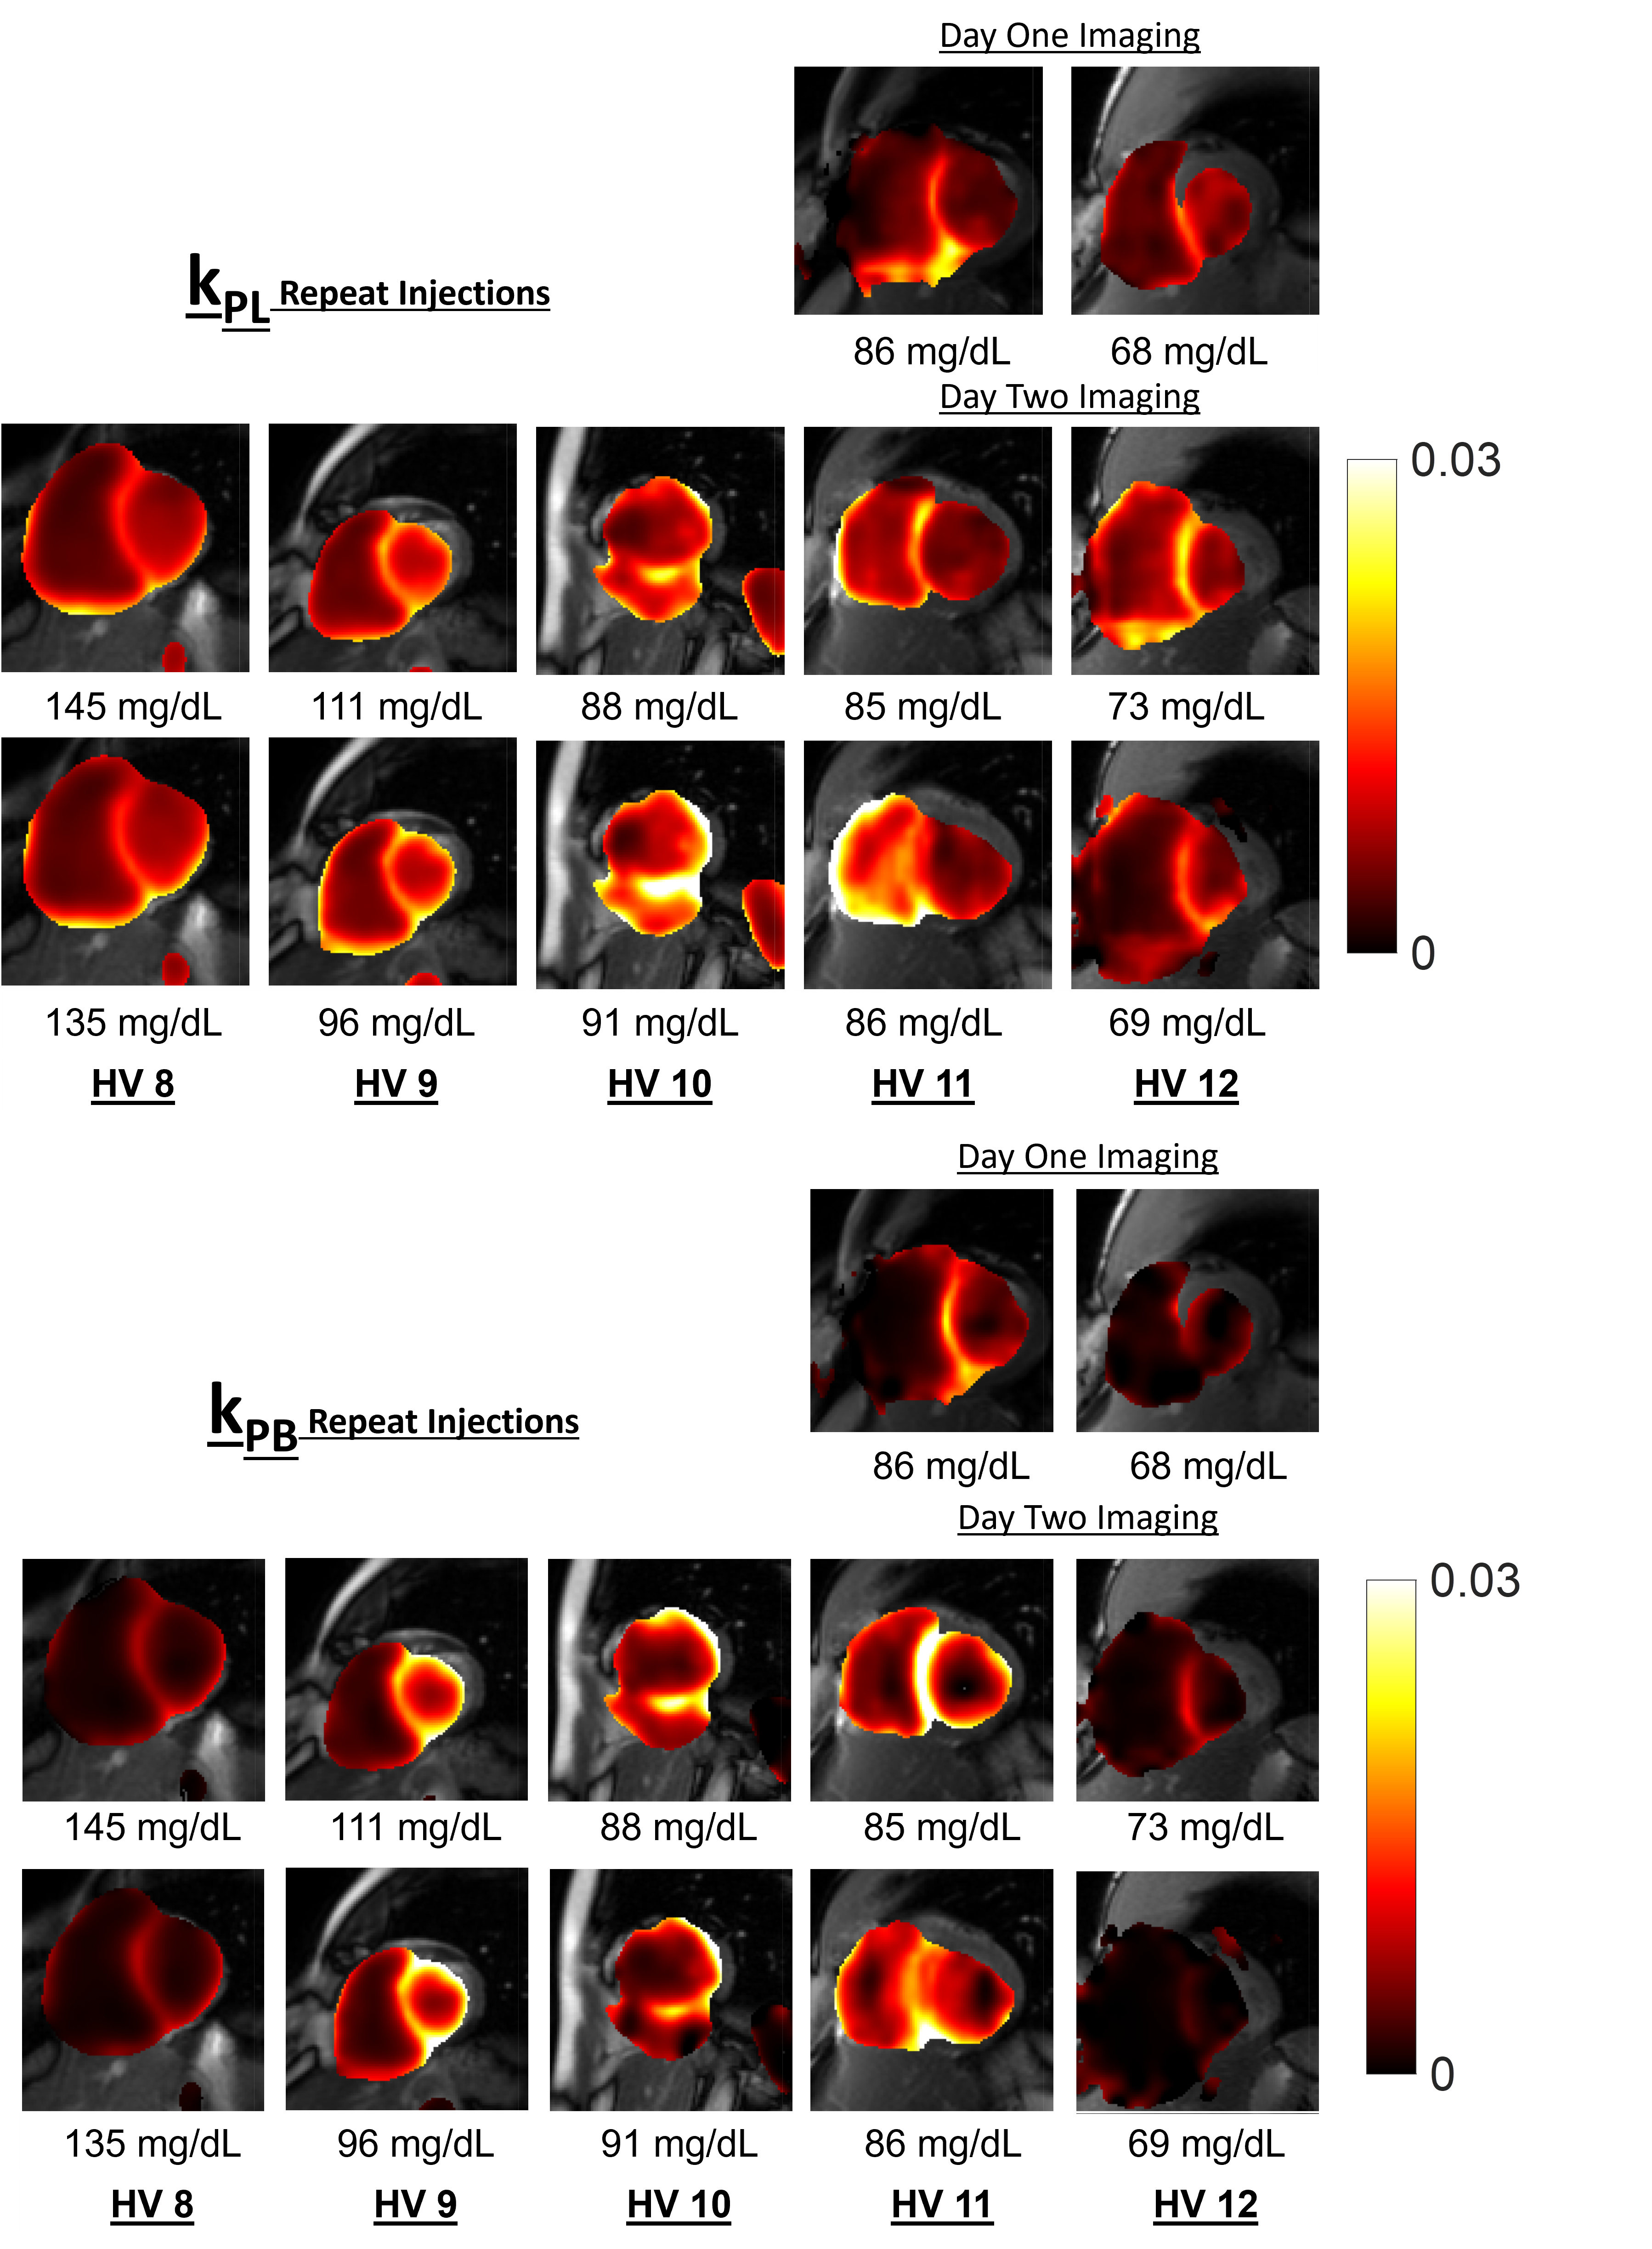
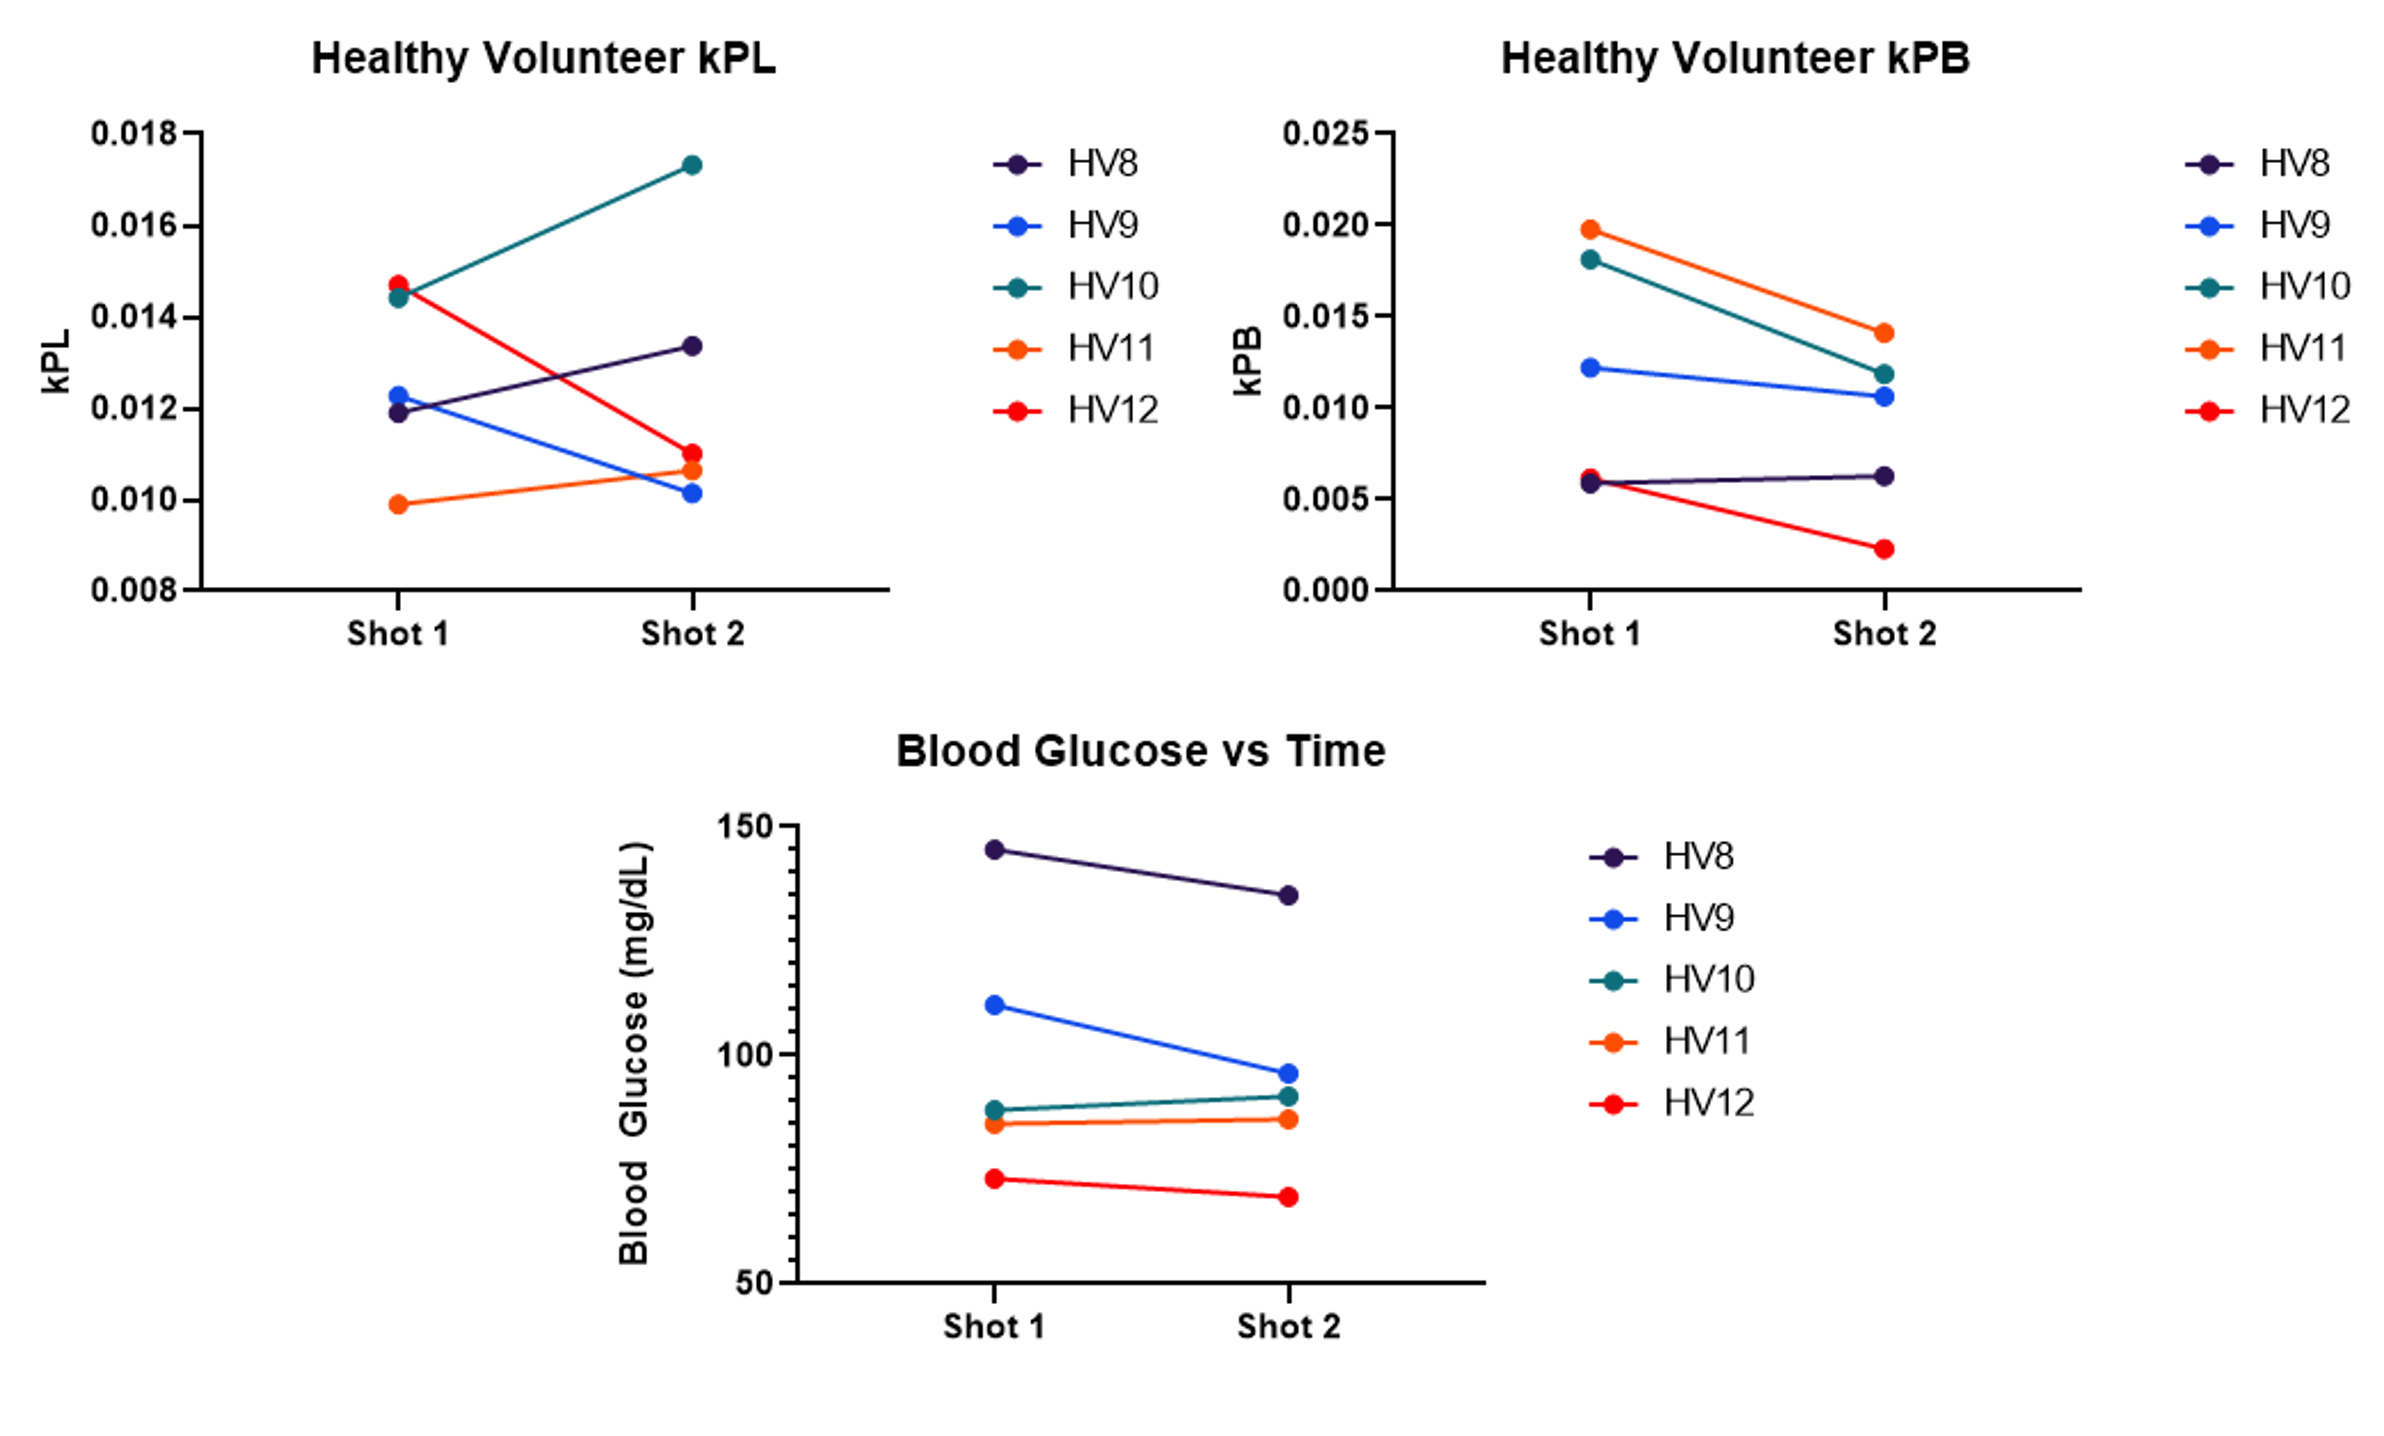
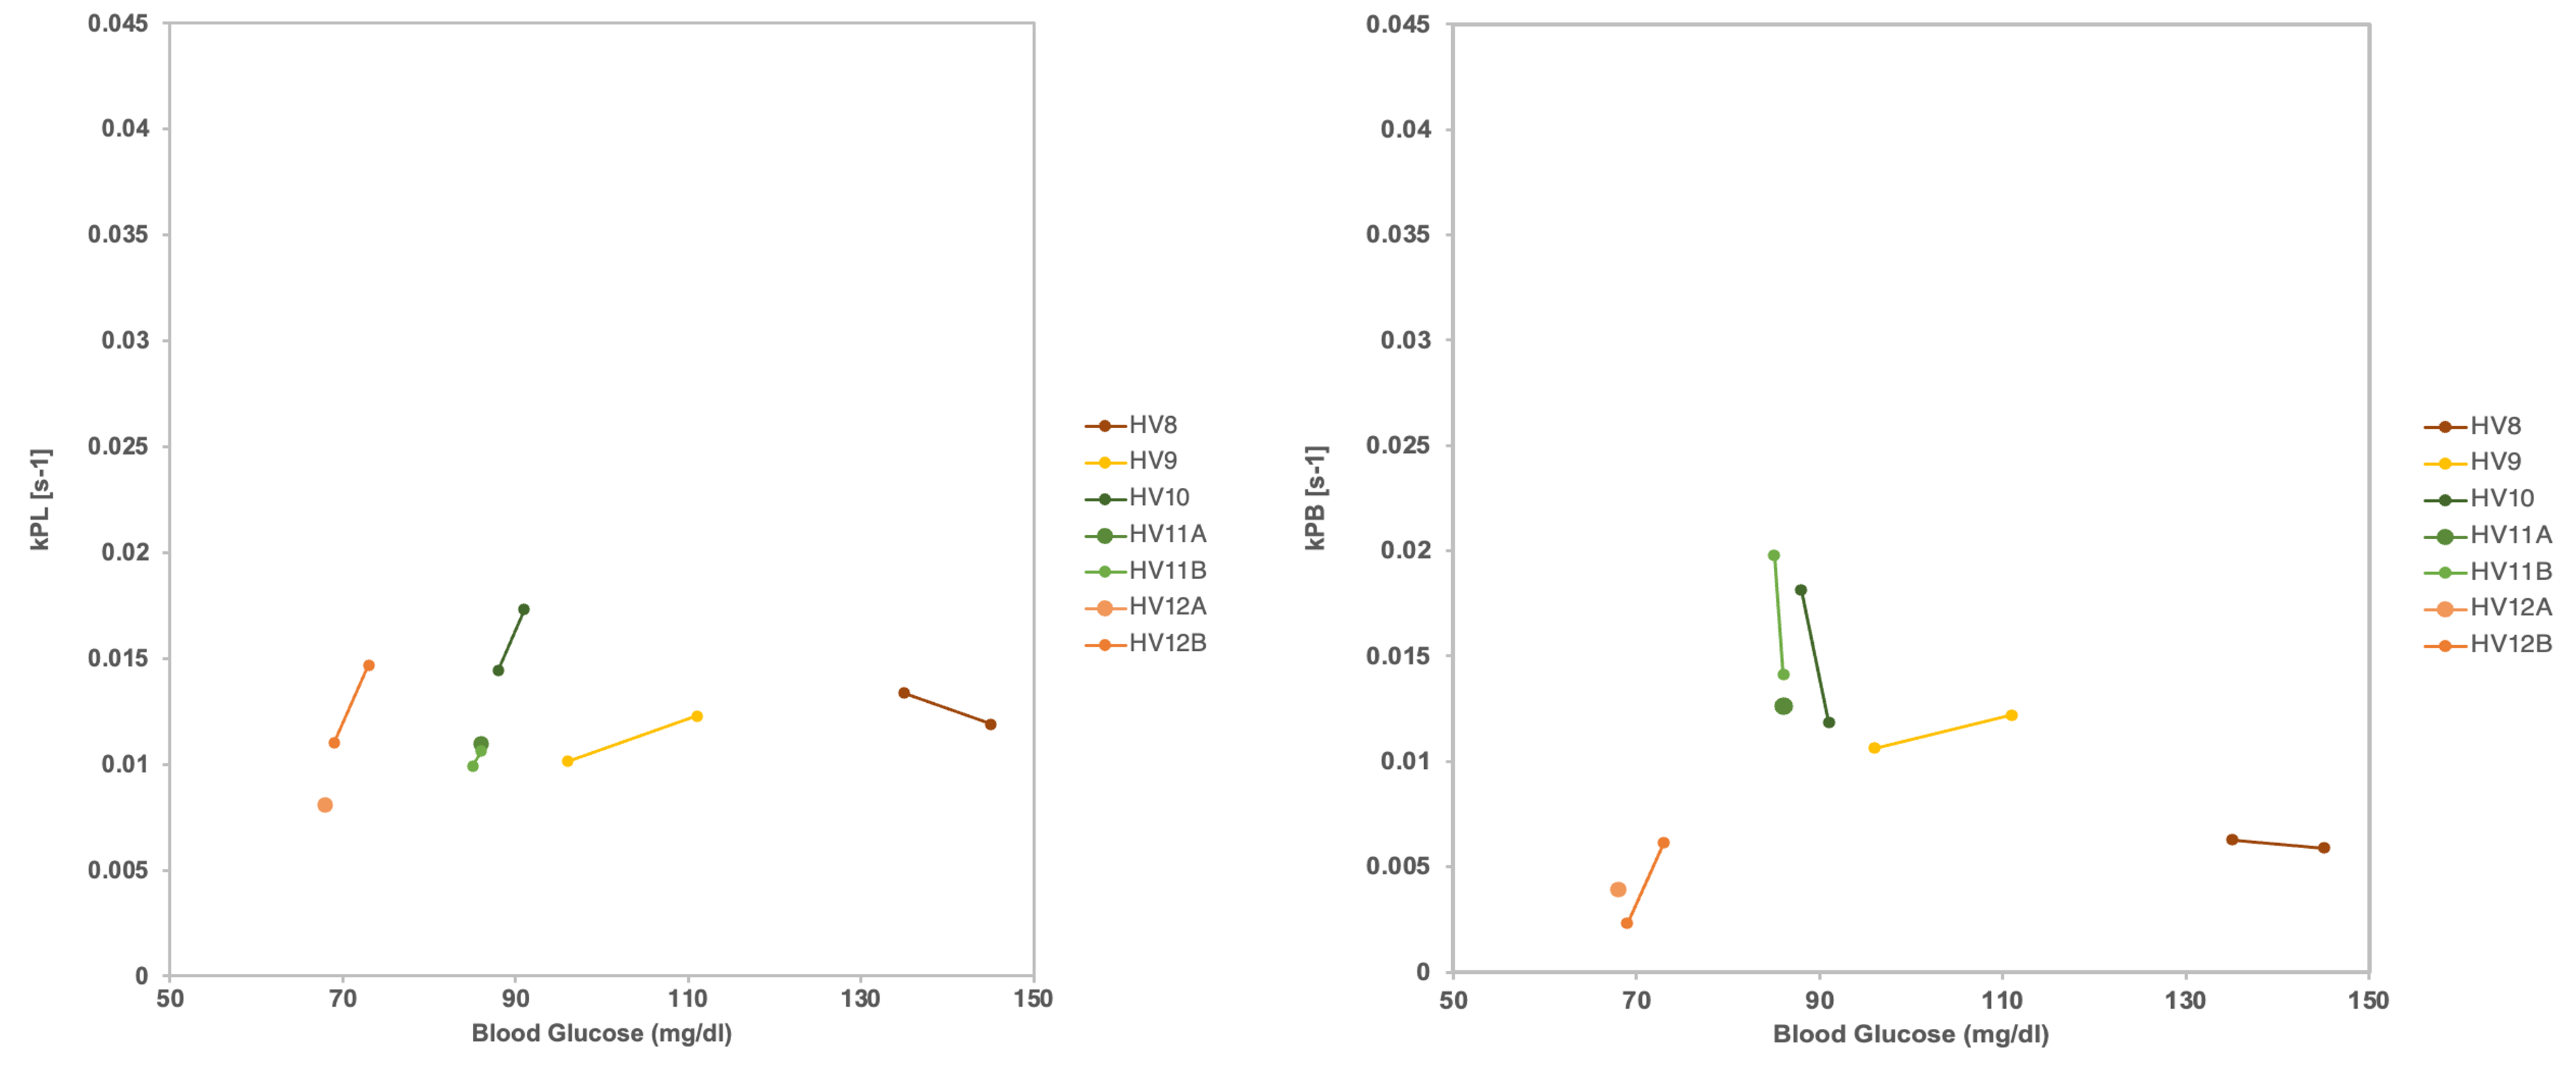
Visually, the results of the repeated scans were very similar, shown in typical examples of metabolite dynamics (Fig 2) and kinetic rate maps (Fig 2/3) from different healthy volunteers with images taken 15 minutes apart.Quantification of the metabolic rates in the myocardium between injections is shown in Fig. 4 as well as the measured blood glucose values between the two shots. Blood glucose and kPB reduced from the first to the second injection, which is consistent with prior studies showing a strong dependence of kPB on blood glucose levels. There was less consistent response in kPL. This is consistent with a reduced dependence of kPL on blood glucose levels. A paired T-test showed no statistically significant differences between injections in kPL (p = 0.9117), and kPB (p = 0.0529). From this data we also measured the coefficient of variance, which was 13.1% for kPL and 33.2% for kPB.
The relationship between blood glucose measurements and kPL and kPB in these subjects is shown in Fig. 5, more clearly illustrating the dependence particularly of kPB on blood glucose levels. This data also includes two subjects who received a 3rd HP pyruvate injection on another day (HV11 and HV12). They showed remarkably similar kPL, kPB, and blood glucose levels between the two days.
Discussion and Conclusion
This study provides novel repeatability data for measuring human heart metabolism using HP 13C-pyruvate MRI. Overall, we observed similar spatial distributions and dynamic time courses from same-day HP 13C-pyruvate injections, performed approximately 15 minutes apart. Metabolism was quantified with a pharmacokinetic model, and the resulting kPL and kPB values were quantified across the injections. We observed trends for reduced kPB in the second injection, which is expected given the reduced blood glucose measured prior to the second injection. We had 2 subjects who returned for a second HP study, and the metabolic rate constants as well as the blood glucose measurements were quite similar, indicating the preparation into the fed state maybe reproducible for an individual(12). However, our results show a broad range of blood glucose in the fed state, highlighting the potential importance of blood glucose measurements for normalization of the metabolic imaging data based on substrate availability.Acknowledgements
We would like to acknowledge: assistance with hyperpolarized experiments from Kimberly Okamoto, Mary Frost, Heather Daniel, James Slater, Duy Dang, Evelyn Escobar, Stacy Andosca; and research support from NIH grants R33HL161816, P41EB013598 and a UCSF Team Science Award.References
1. Golman K, Petersson JS, Magnusson P, et al. Cardiac metabolism measured noninvasively by hyperpolarized 13C MRI. Magn Reson Med. 2008;59(5):1005-1013. doi:10.1002/mrm.21460
2. Timm KN, Miller JJ, Henry JA, Tyler DJ. Cardiac applications of hyperpolarised magnetic resonance. Progress in Nuclear Magnetic Resonance Spectroscopy. 2018;106-107:66-87. doi:10.1016/j.pnmrs.2018.05.002
3. Miller JJ, Lau J, Tyler D. 9 - Hyperpolarized MR in cardiology: probing the heart of life. In: Larson PEZ, ed. Advances in Magnetic Resonance Technology and Applications. Vol 3. Hyperpolarized Carbon-13 Magnetic Resonance Imaging and Spectroscopy. Academic Press; 2021:217-256. doi:10.1016/B978-0-12-822269-0.00006-3
4. Cunningham CH, Lau JYC, Chen AP, et al. Hyperpolarized 13C Metabolic MRI of the Human HeartNovelty and Significance: Initial Experience. Circ Res. 2016;119(11):1177-1182. doi:10.1161/CIRCRESAHA.116.309769
5. Larson PEZ, Tang S, Liu X, et al. Regional quantification of cardiac metabolism with hyperpolarized [1-13C]-pyruvate MRI evaluated in an oral glucose challenge. Published online October 19, 2023:2023.10.16.23297052. doi:10.1101/2023.10.16.23297052
6. Park Jae Mo, Reed Galen D, Liticker Jeff, et al. Effect of Doxorubicin on Myocardial Bicarbonate Production from Pyruvate Dehydrogenase in Women with Breast Cancer. Circulation Research. 0(0). doi:10.1161/CIRCRESAHA.120.317970
7. Rider OJ, Apps A, Miller JJJJ, et al. Noninvasive In Vivo Assessment of Cardiac Metabolism in the Healthy and Diabetic Human Heart Using Hyperpolarized 13C MRI. Circulation Research. 2020;126(6):725-736. doi:10.1161/CIRCRESAHA.119.316260
8. Apps A, Lau JYC, Miller JJJJ, et al. Proof-of-Principle Demonstration of Direct Metabolic Imaging Following Myocardial Infarction Using Hyperpolarized 13C CMR. JACC Cardiovasc Imaging. 2021;14(6):1285-1288. doi:10.1016/j.jcmg.2020.12.023
9. Tougaard RS, Szocska Hansen ES, Laustsen C, et al. Hyperpolarized [1-13 C]pyruvate MRI can image the metabolic shift in cardiac metabolism between the fasted and fed state in a porcine model. Magn Reson Med. 2019;81(4):2655-2665. doi:10.1002/mrm.27560
10. Tang S, Milshteyn E, Reed G, et al. A regional bolus tracking and real-time B1 calibration method for hyperpolarized 13 C MRI. Magn Reson Med. 2019;81(2):839-851. doi:10.1002/mrm.27391
11. Hyperpolarized-MRI-Toolbox. doi:10.5281/zenodo.1198915
12. Timm KN, Apps A, Miller JJ, et al. Assessing the optimal preparation strategy to minimize the variability of cardiac pyruvate dehydrogenase flux measurements with hyperpolarized MRS. NMR in Biomedicine. 2018;31(9):e3992. doi:10.1002/nbm.3992
Figures