3068
Comparison of Hyperpolarized 13C Pyruvate MRI and 1H MRI for Predicting Renal Tumor Aggressiveness1Radiology & Biomedical Imaging, University of California San Francisco, San Francisco, CA, United States, 2Vista.ai Inc., Los Altos, CA, United States, 3Life Sciences Institute, University of Michigan, Ann Arbor, MI, United States, 4Department of Epidemiology and Biostatistics, University of California San Francisco, San Francisco, CA, United States, 5Department of Urology, University of California San Francisco, San Francisco, CA, United States, 6Graduate Program in Bioengineering, University of California, Berkeley and San Francisco, San Francisco, CA, United States
Synopsis
Keywords: Hyperpolarized MR (Non-Gas), Cancer
Motivation: Current imaging methods have limitations in predicting localized renal tumor aggressiveness.
Goal(s): Comparing the performance of predicting high grade ccRCCs, typically considering as aggressive RCCs, by different MR imaging methods.
Approach: We compared the performance of hyperpolarized 13C pyruvate MRI and 1H MRI for predicting high-grade ccRCCs in 22 localized renal tumors.
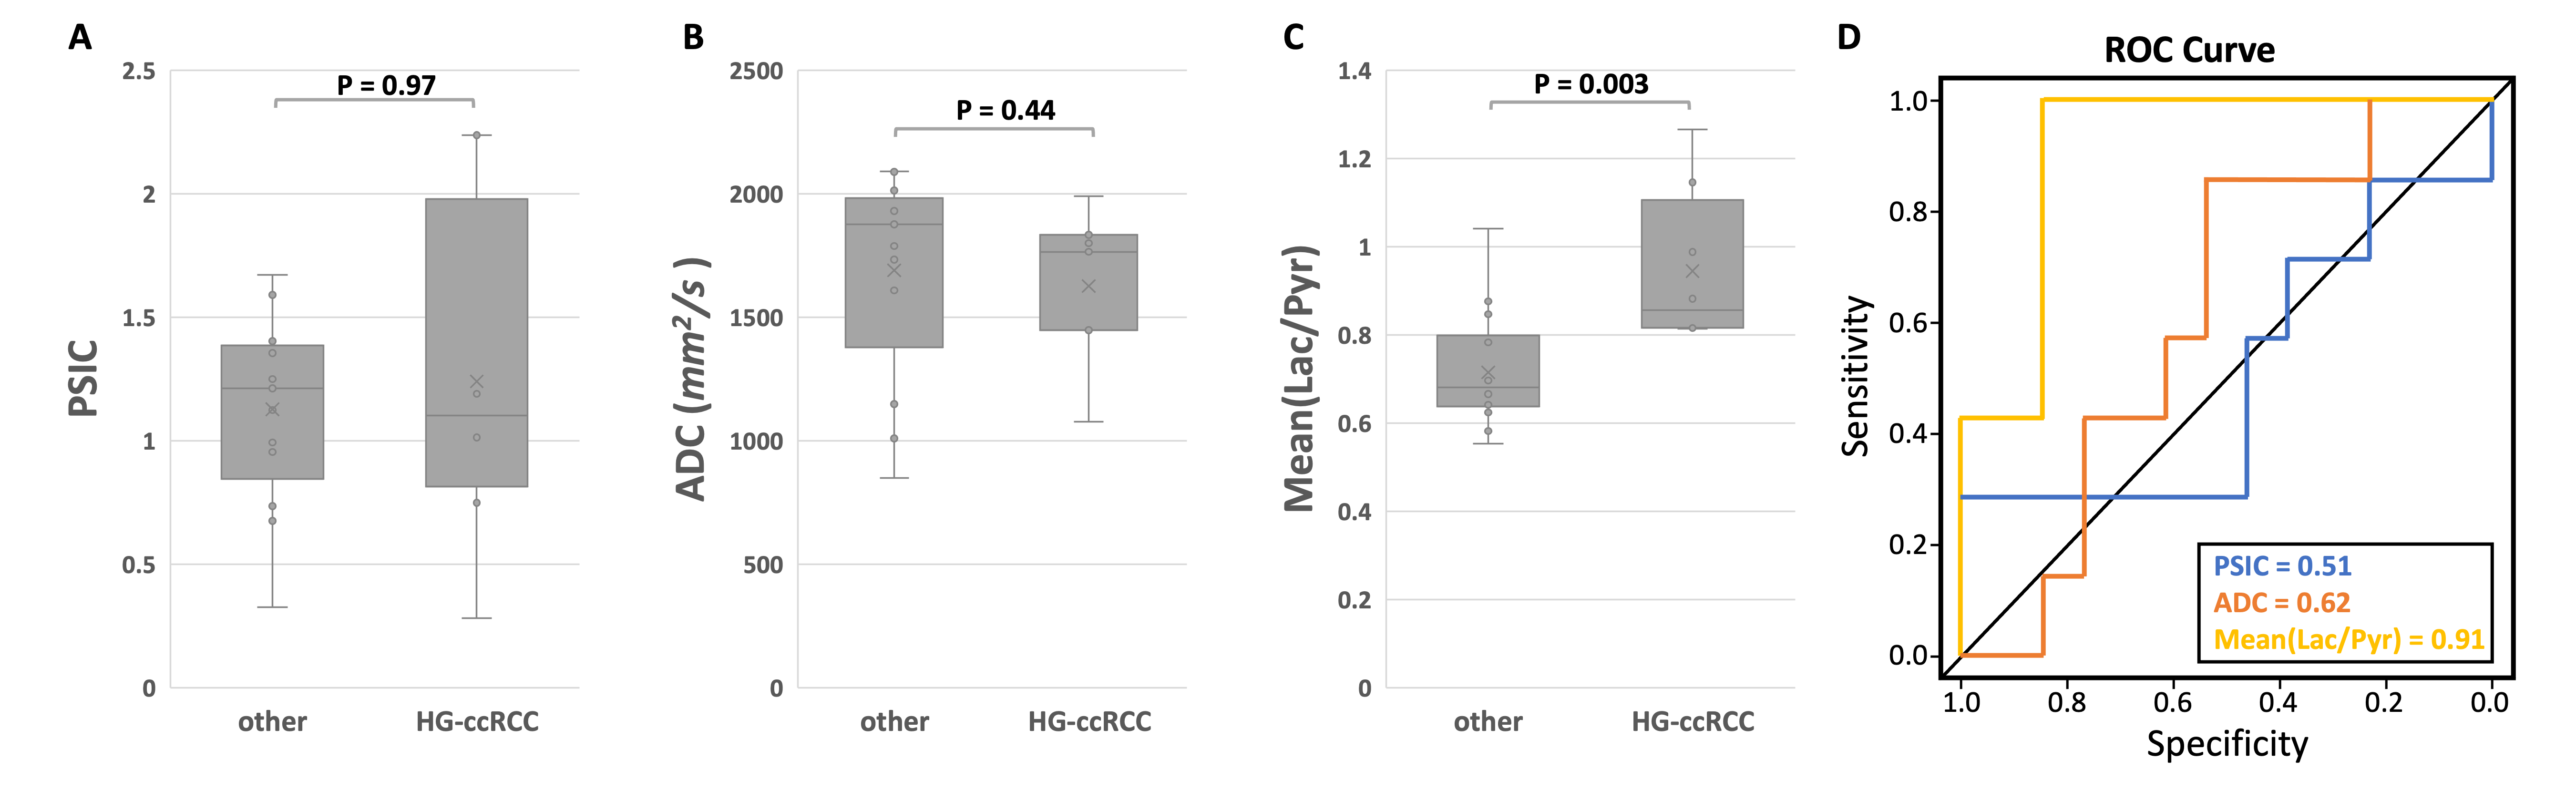
Results: Hyperpolarized 13C-labelled lactate-to-pyruvate ratio was significantly higher in high-grade ccRCCs compared to other renal tumor group(benign renal tumors, chromophobe RCCs, and low grade ccRCCs, P=0.003). Neither the percentage signal intensity change from contrast-enhanced MRI nor the apparent diffusion coefficient from diffusion-weighted MRI was able to differentiate between the two groups.
Impact: Compared to 1H MRI, HP 13C MRI enables improved prediction of high-grade clear cell renal cell carcinomas.
Introduction
Current imaging methods have limitations in predicting localized renal tumor aggressiveness.1,2 Improved risk stratification of these tumors is needed to guide patient management and avoid unnecessary surgery.3–6 Renal cell carcinomas (RCCs) are increasingly recognized as a metabolic disease with increased lactate production (“Warburg effect”) in aggressive RCCs7–10. The emerging hyperpolarized (HP) 13C pyruvate MRI technique can provide dynamic pyruvate-to-lactate metabolism in real time7,10 and may be useful for renal tumor risk stratification. In this study, we applied a multi-parametric MRI protocol including both HP 13C pyruvate MRI and 1H contrast-enhanced and diffusion-weighted MRI in patients with localized renal tumors and compared the performance of predicting high grade ccRCCs, typically considered as aggressive RCCs, by different MR imaging methods.Methods
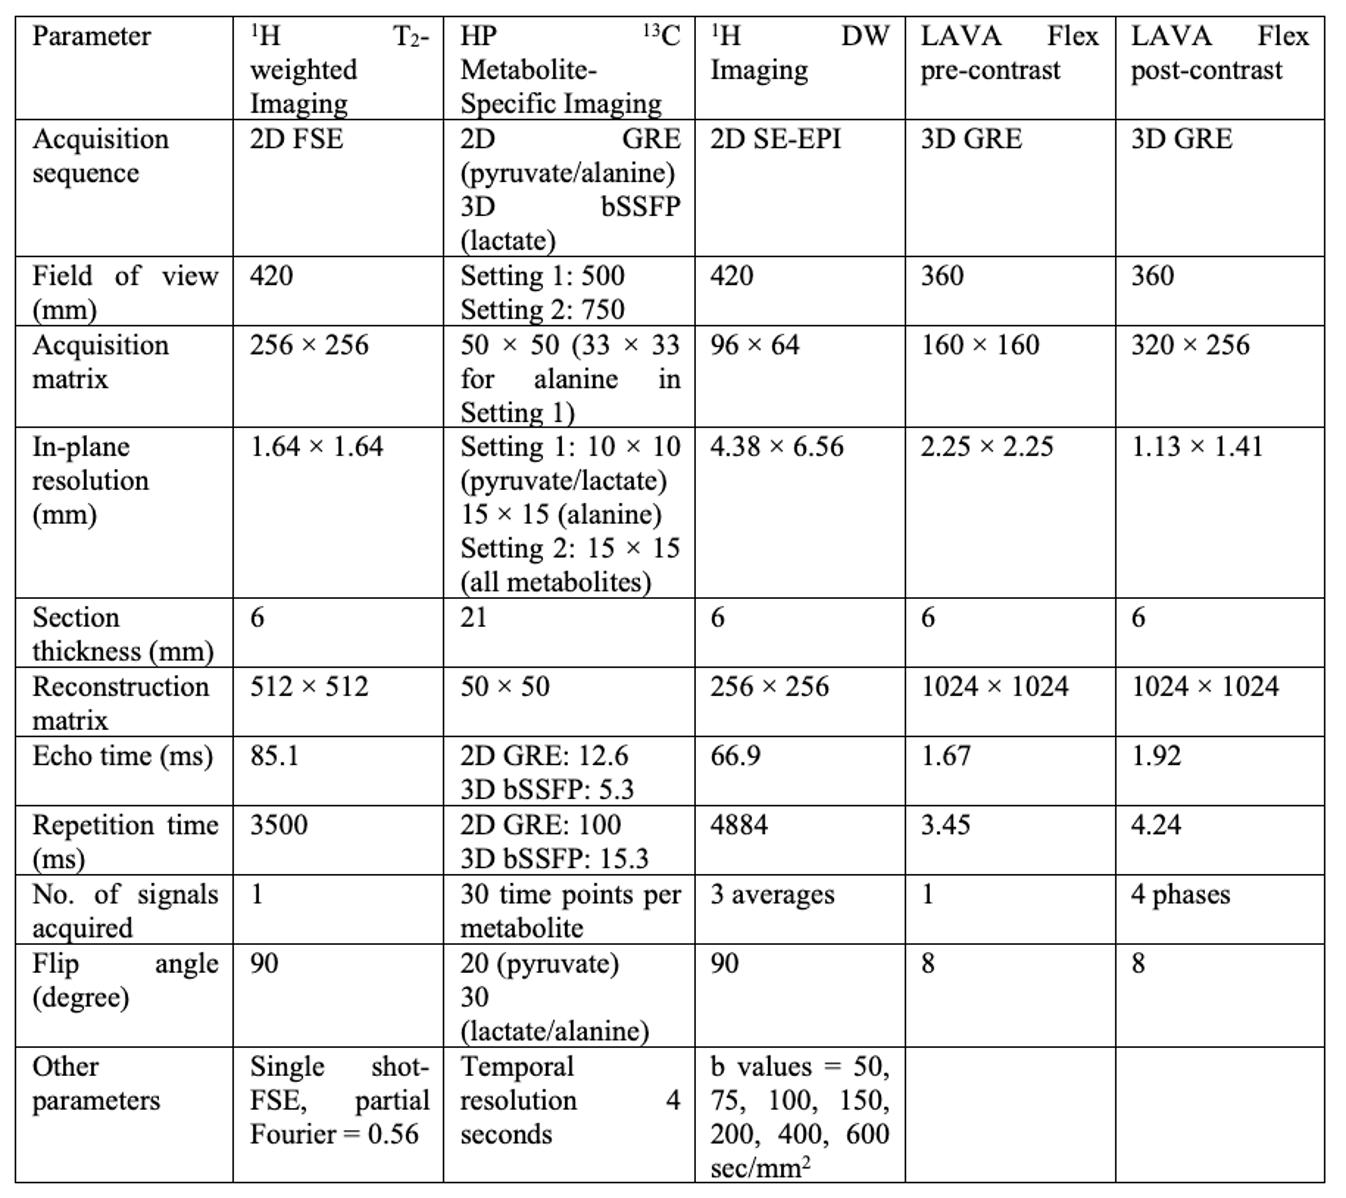
Twenty-two patients (15 male; mean age: 60 years-old) with localized renal tumors were recruited to undergo HP 13C and 1H MRI under an Institutional Review Board approved protocol. MRI scans were performed on a GE 3T scanner. The parameters11 of HP 13C and 1H MRI are shown in Table 1. HP [1-13C] pyruvate was administered at a 0.43 mL/kg body weight dosage followed by a 20 mL saline flush at 5 mL/s. Regions-of-interest (ROIs) for the solid-appearing regions tumors and adjacent normal renal parenchyma were manually drawn on the 1H MR images. The HP 13C metabolite AUC ratios for the solid-appearing regions of the tumor and normal renal parenchyma were calculated11. For the 1H MRI data, apparent diffusion coefficient (ADC) and percentage signal intensity change (PSIC) from contrast-enhanced MRI were obtained from the ROIs. ADC maps were processed using MRtrix3 software12. PSIC values were calculated for each contrast-enhanced phase using the equation4 PSIC = [(Spost - Spre)/Spre] × 100%, where Spre and Spost were the signals from the ROIs before and after the injection of Gd-based contrast agent, respectively. To account for any difference in the amount of contrast delivery among different patients, the PSIC of the tumor was normalized by the PSIC of the kidney parenchyma at the same phase. The maximum PSIC from all four phases was used for the quantitative assessment of tumor enhancement. Wilcoxon rank sum test was used to compare HP 13C lactate/pyruvate AUC ratios, ADC, and PSIC between high grade ccRCCs and other renal tumors. A (P < 0.05) was considered statistically significant.Results and Discussion
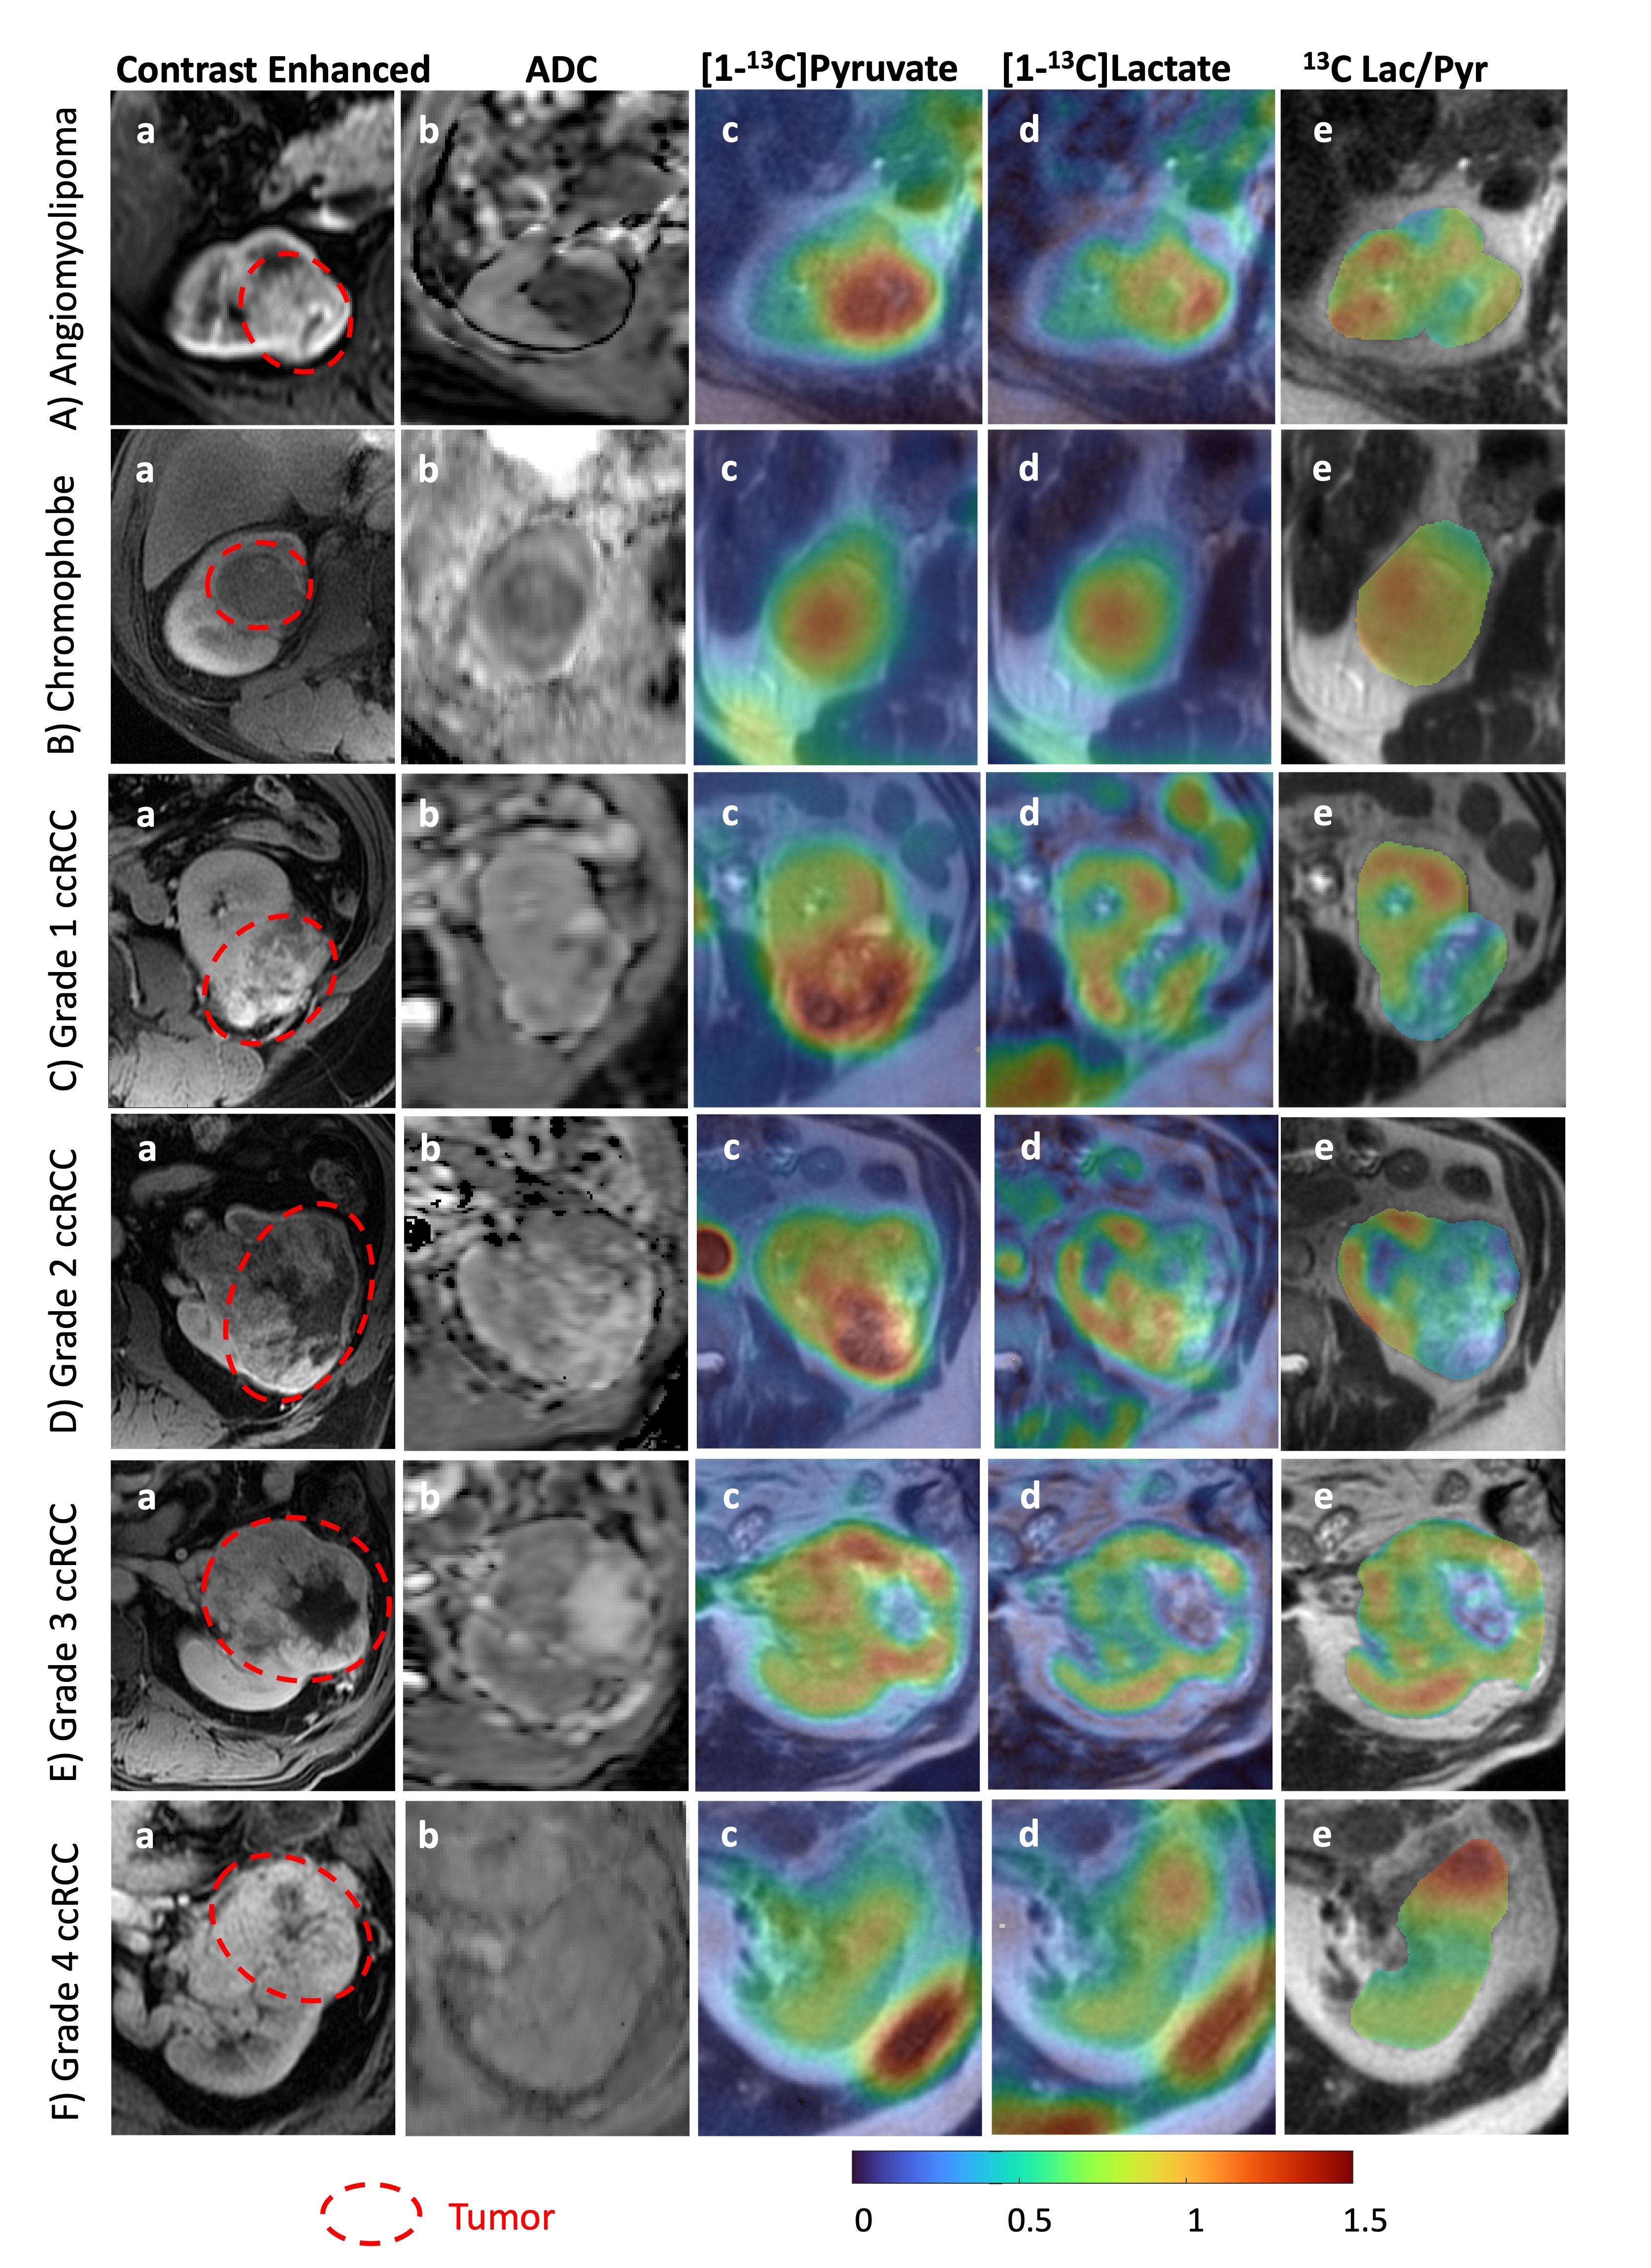
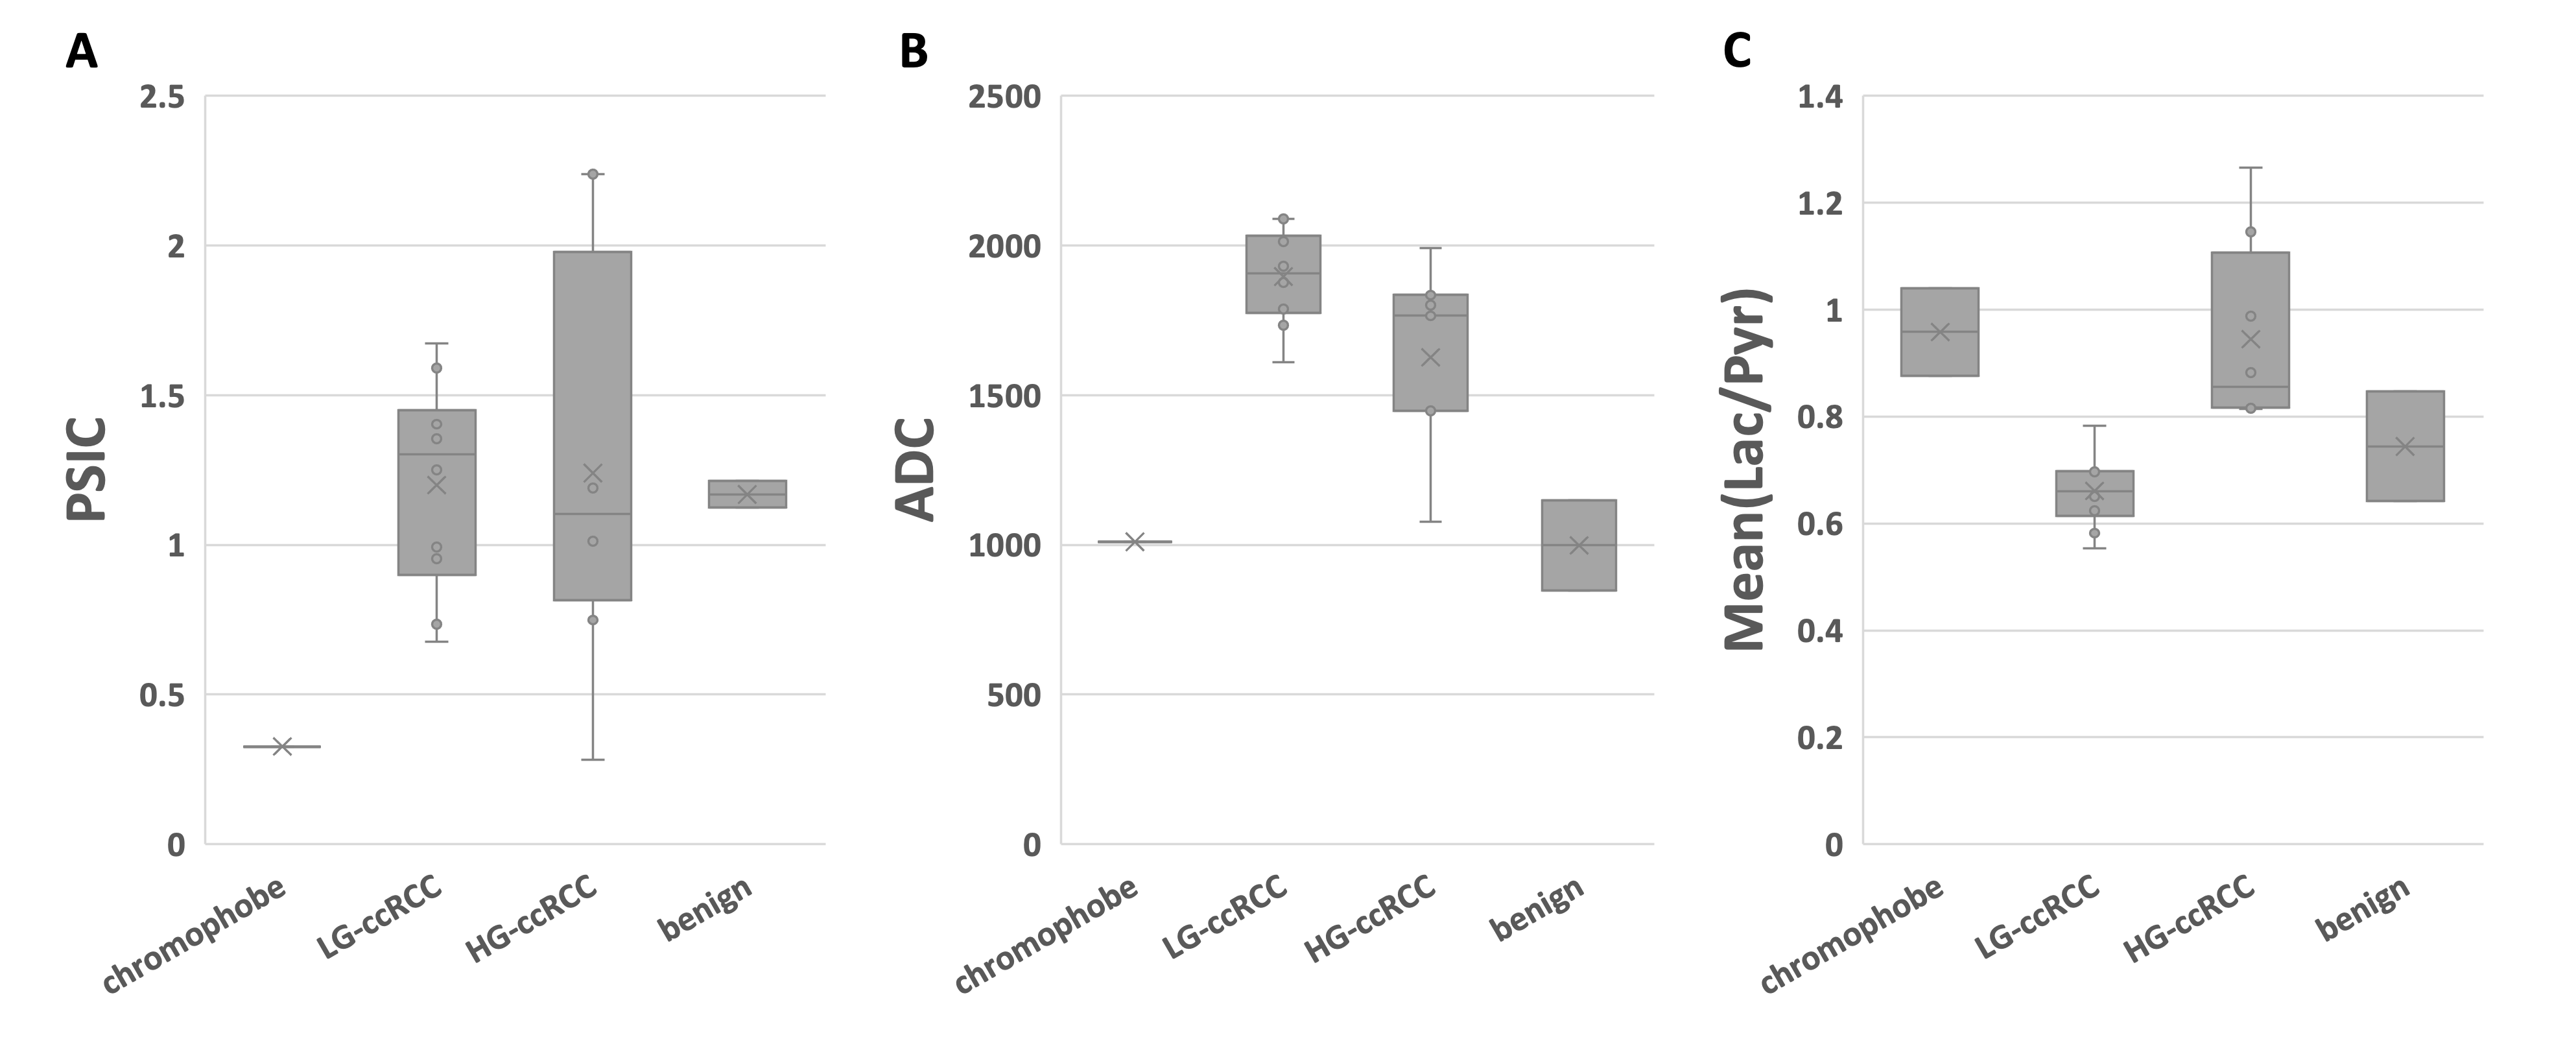
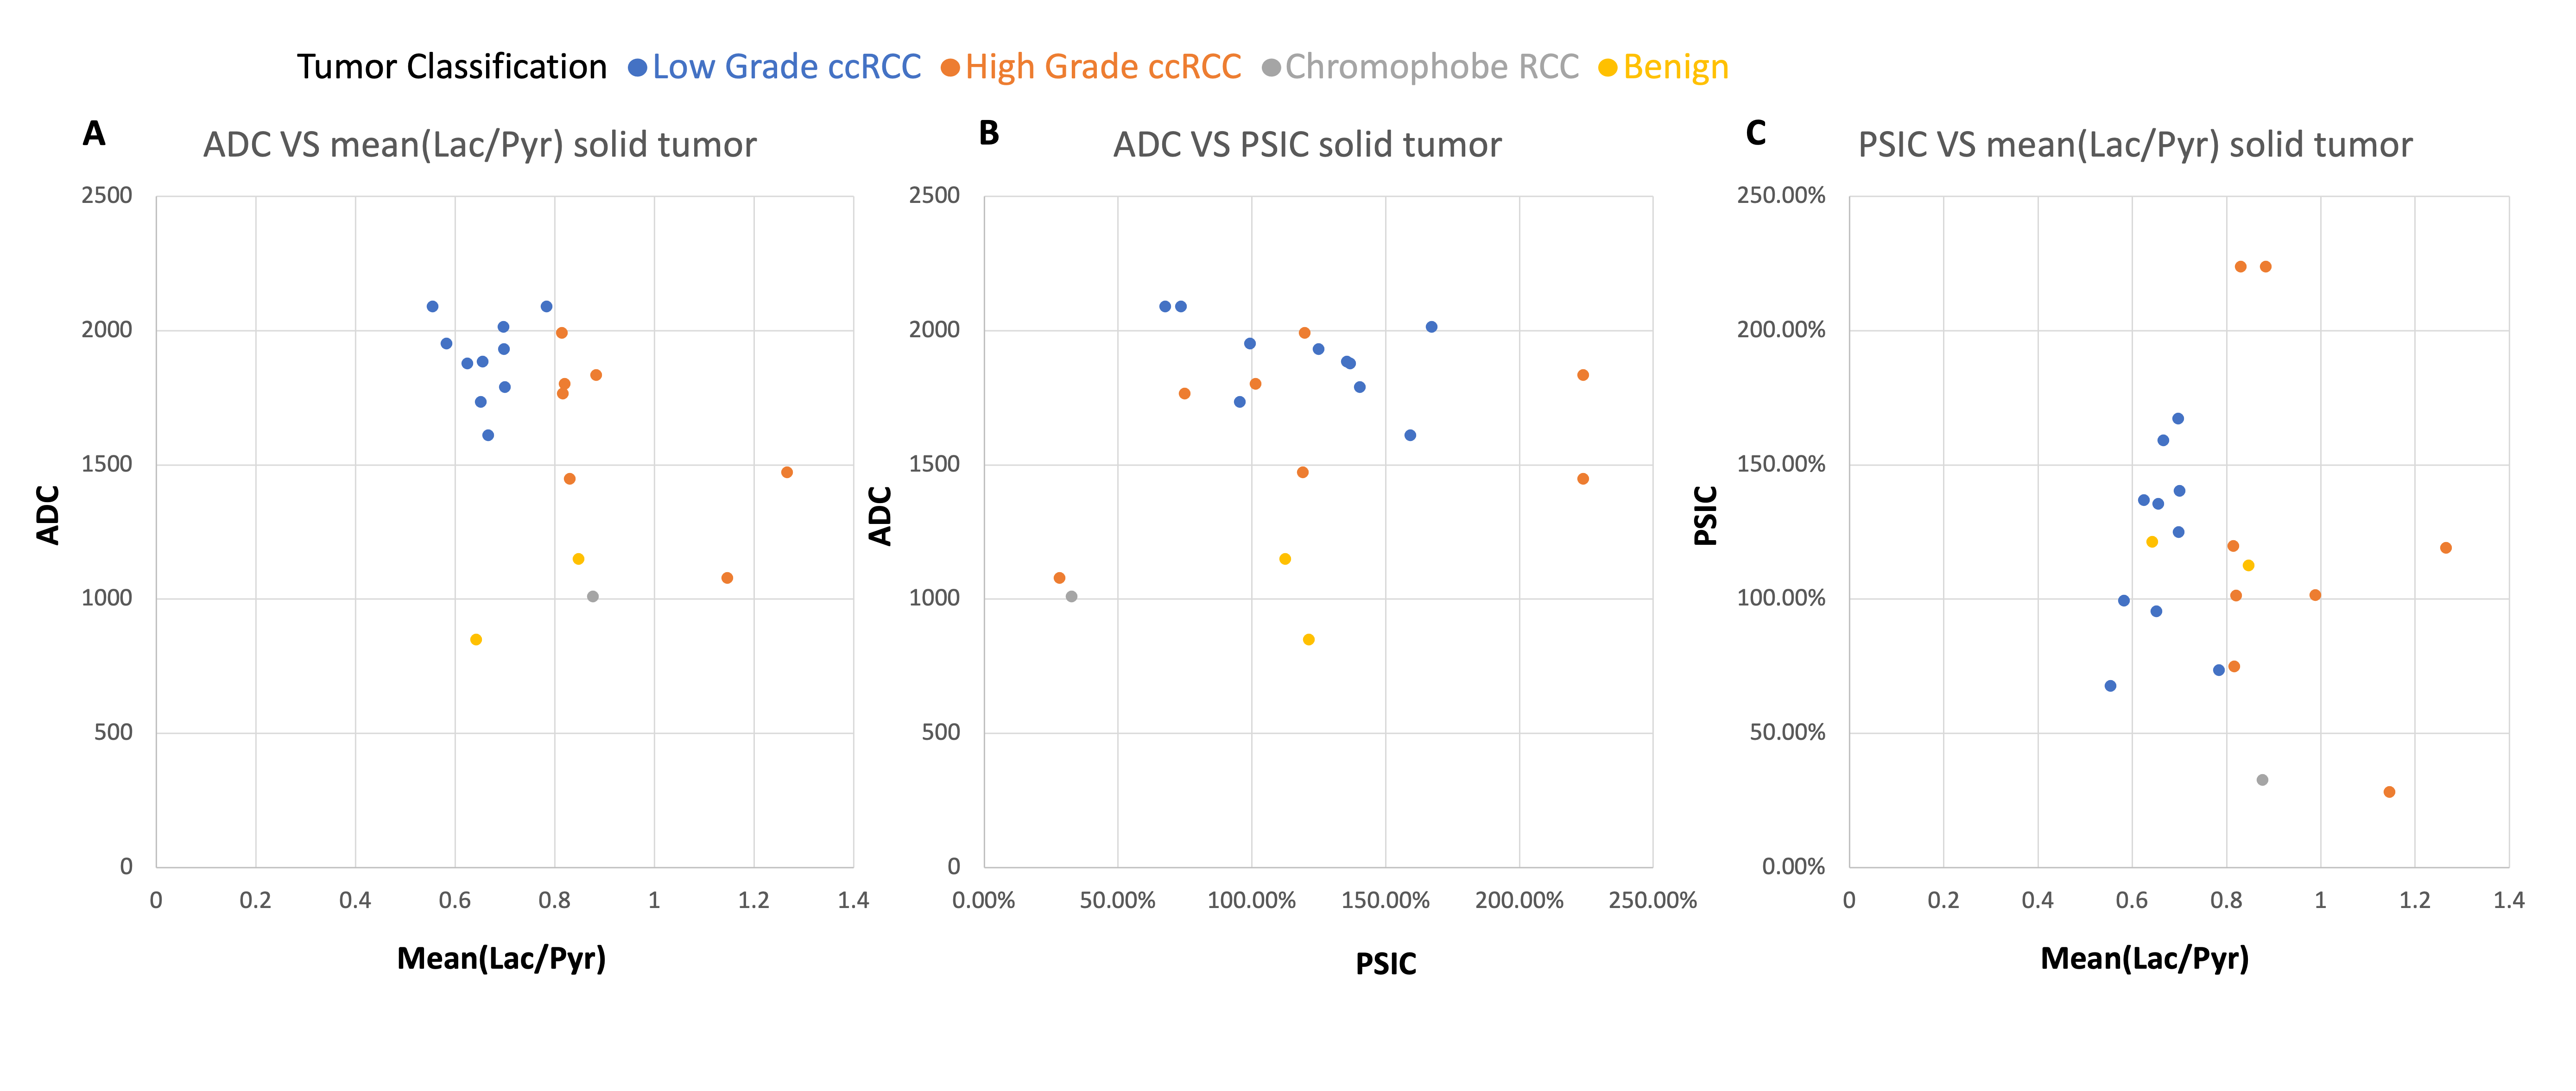
Data from 22 renal tumors in 22 patients were evaluated. These include two benign tumors (oncocytoma and angiomyolipoma), two chromophobe RCCs, 10 low grade (Fuhrman grade 1 and 2) ccRCCs, and 8 high grade (Fuhrman grade 3 and 4) ccRCCs. We also imaged 2 patients on an active surveillance protocol who were not included since their tumor classification was not known. Examples of multi-parametric MR images of different tumors are shown in Figure 1. Figure 2 shows the distribution of PSIC, ADC and metabolite ratio values stratified by renal tumor histology and grade. Figure 3(A-C) shows the comparison of PSIC, ADC and lactate-to-pyruvate ratios in high grade ccRCCs versus all other renal tumors (benign renal tumors, chromophobe RCCs, and low grade ccRCCs). HP 13C-labelled lactate-to-pyruvate ratio was significantly higher in high-grade ccRCCs compared to other renal tumor group (P = 0.003). Neither PSIC nor ADC was significantly different between the two groups (P = 0.97 and 0.44 respectively). In Figure 3(D), the area under the receiver operating characteristics (ROC) curves for predicting high grade ccRCCs using HP 13C MRI was 0.91 (95% confidence interval: 0.78-1), which is higher than using ADC (AUC = 0.62, 95% confidence interval: 0.36-0.87) or using PSIC (AUC = 0.51, 95% confidence interval: 0.20-0.82). Figure 4 shows joint distributions of the various imaging values. While we are currently limited by sample size to make statistically significant conclusions, we can observe trends: there is clustering of both the low-grade and high-grade ccRCC in the ADC-mean(lac/pyr); and similar values for the 2 benign tumors in both ADC-mean(lac/pyr) and ADC-PSIC. This suggests that multi-parametric assessments may provide further differentiation of renal tumors.Conclusion
We showed that compared to 1H MRI, HP 13C MRI enables improved prediction of high-grade ccRCCs. Our findings show the potential of incorporating metabolism information from HP 13C MRI to improve the prediction of aggressive renal tumors.Acknowledgements
This work was supported by NIH grants P41EB013598, R21DK130002 and R01CA249099. We thank Robert Bok, Mary Frost, Heather Daniel, Kimberly Okamoto, Duy Dang, Evelyn Escobar, Stacy Andosca, Hsin-Yu Chen, Lucas Carvajal, and Romelyn Delos Santos for assistance with the human study.References
1. Welch HG, Skinner JS, Schroeck FR, Zhou W, Black WC. Regional variation of computed tomographic imaging in the United States and the risk of nephrectomy. JAMA Intern Med. 2018;178(2):221-227. doi:10.1001/jamainternmed.2017.7508
2. Hollingsworth JM, Miller DC, Daignault S, Hollenbeck BK. Rising incidence of small renal masses: A need to reassess treatment effect. J Natl Cancer Inst. 2006;98(18):1331-1334. doi:10.1093/jnci/djj362
3. Rosenkrantz AB, Niver BE, Fitzgerald EF, Babb JS, Chandarana H, Melamed J. Utility of the apparent diffusion coefficient for distinguishing clear cell renal cell carcinoma of low and high nuclear grade. American Journal of Roentgenology. 2010;195(5). doi:10.2214/AJR.10.4688
4. Sun MRM, Nao L, Genega EM, et al. Renal cell carcinoma: Dynamic contrast-enhanced MR imaging for differentiation of tumor subtypes-correlation with pathologic findings. Radiology. 2009;250(3):793-802. doi:10.1148/radiol.2503080995
5. Lee-Felker SA, Felker ER, Tan N, et al. Qualitative and quantitative MDCT features for differentiating clear cell renal cell carcinoma from other solid renal cortical masses. American Journal of Roentgenology. 2014;203(5):W516-W524. doi:10.2214/AJR.14.12460
6. Woo S, Suh CH, Kim SY, Cho JY, Kim SH. Diagnostic performance of DWI for differentiating high- from low-grade clear cell renal cell carcinoma: A systematic review and meta-analysis. American Journal of Roentgenology. 2017;209(6):W374-W381. doi:10.2214/AJR.17.18283
7. Wettersten HI, Hakimi AA, Morin D, et al. Grade-dependent metabolic reprogramming in kidney cancer revealed by combined proteomics and metabolomics analysis. Cancer Res. 2015;75(12):2541-2552. doi:10.1158/0008-5472.CAN-14-1703
8. Linehan WM, Srinivasan R, Schmidt LS. The genetic basis of kidney cancer: A metabolic disease. Nat Rev Urol. 2010;7(5):277-285. doi:10.1038/nrurol.2010.47
9. Van der Mijn JC, Panka DJ, Geissler AK, Verheul HenkM, Mier JW. Novel drugs that target the metabolic reprogramming in renal cell cancer. Cancer Metab. 2016;4(1). doi:10.1186/s40170-016-0154-8
10. Kimryn Rathmell W, Rathmell JC, Marston Linehan W. Metabolic pathways in kidney cancer: Current therapies and future directions. Journal of Clinical Oncology. 2018;36(36):3540-3546. doi:10.1200/JCO.2018.79.2309
11. Tang S, Meng M V., Slater JB, et al. Metabolic imaging with hyperpolarized 13C pyruvate magnetic resonance imaging in patients with renal tumors—Initial experience. Cancer. 2021;127(15):2693-2704. doi:10.1002/cncr.33554
12. Tournier JD, Smith R, Raffelt D, et al. MRtrix3: A fast, flexible and open software framework for medical image processing and visualisation. Neuroimage. 2019;202. doi:10.1016/j.neuroimage.2019.116137
Figures