3059
Measuring Tissue-Specific Relaxation Times of Deuterium (2H) Labeled Resonances in the Human Brain at 7T1High Field MR Center, Department of Biomedical Imaging and Image-Guided Therapy, Medical University of Vienna, Vienna, Austria, 2Christian Doppler Laboratory for MR Imaging Biomarkers (BIOMAK), Vienna, Austria, 3Wellcome Centre for Integrative Neuroimaging, FMRIB, Nuffield Department of Clinical Neurosciences, University of Oxford, Oxford, United Kingdom, 4Department of Medicine III, Division of Endocrinology and Metabolism, Medical University of Vienna, Vienna, Austria, 5Institute for Clinical Molecular MRI, Karl Landsteiner Society, St. Pölten, Austria, 6Department of Psychiatry and Psychotherapy, Comprehensive Center for Clinical Neurosciences and Mental Health (C3NMH), Medical University of Vienna, Vienna, Austria
Synopsis
Keywords: Deuterium, Deuterium, Relaxation Times, Brain, 7T, Deuterium Metabolic Imaging
Motivation: Deuterium metabolic imaging (DMI) is an emerging Magnetic Resonance technique to non-invasively map the cellular glucose uptake and downstream metabolism. For a reliable concentration estimation, tissue-specific relaxation times are essential, yet only unlocalized relaxation time constants of deuterium labeled resonances are reported.
Goal(s): Measure tissue-specific relaxation times of deuterated resonances (glucose, glutamate+glutamine).
Approach: Inversion recovery and Hahn spin-echo acquisition schemes were implemented into 3D FID 2H-MRSI using concentric ring trajectory readout.
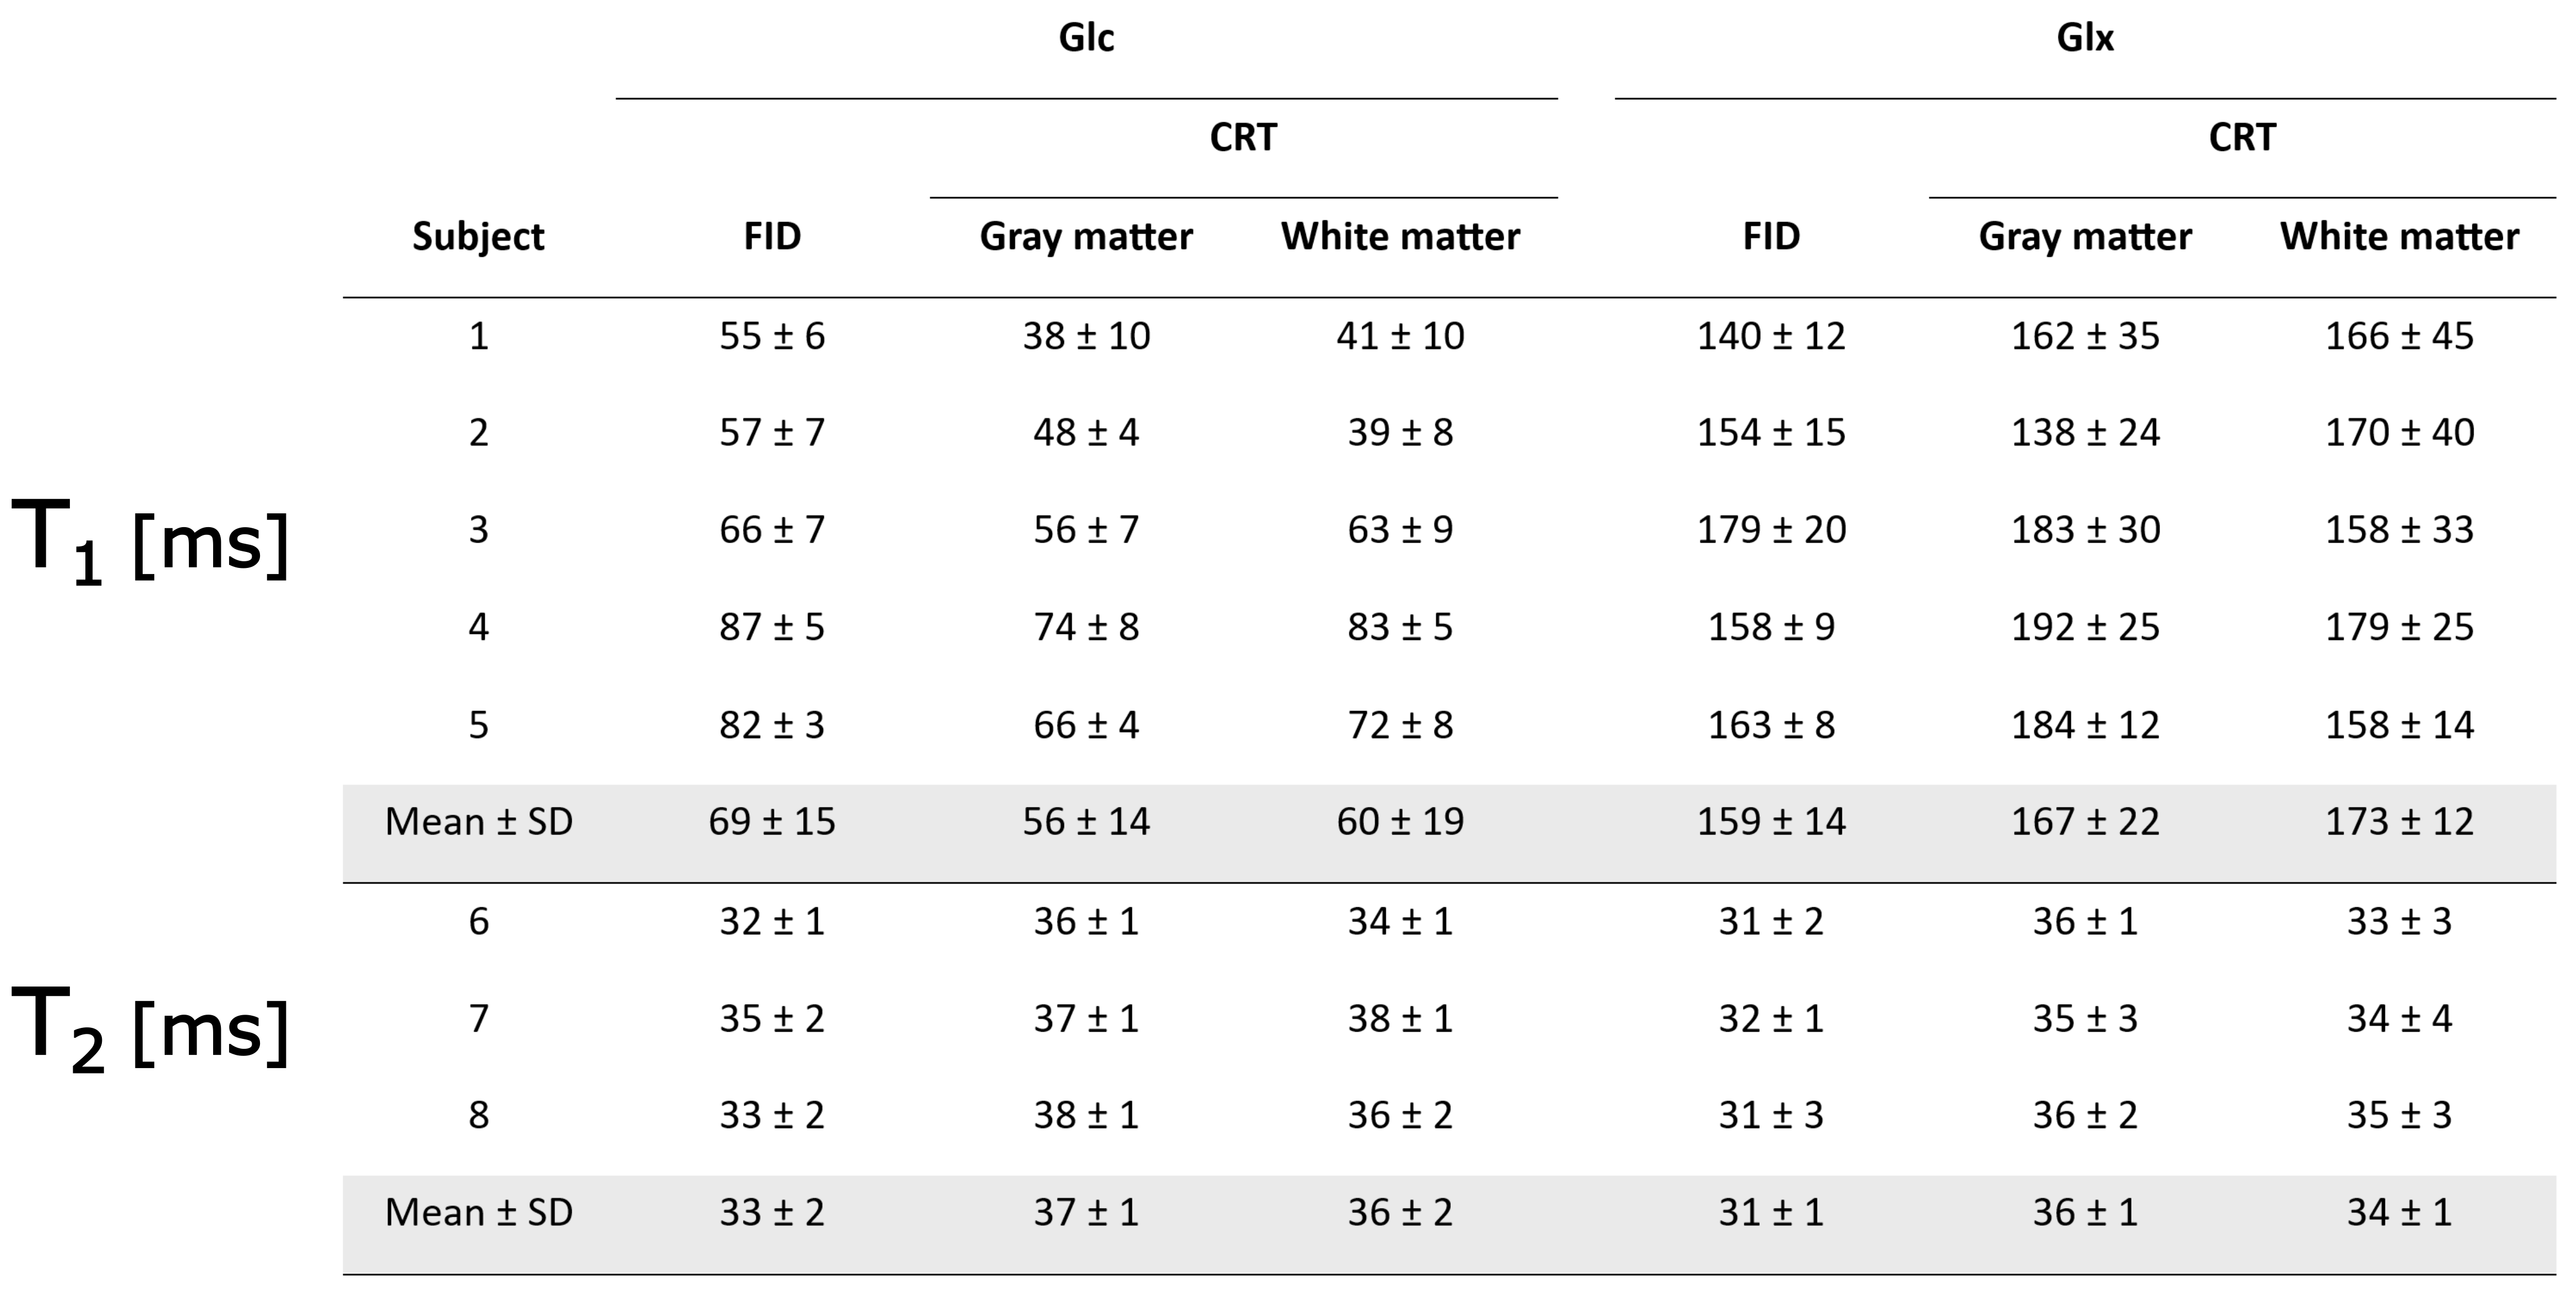
Results: Measured T1 and T2 relaxation time constants of Glc (T1GM=56±14ms; T1WM=60±19ms; T2GM=37±1ms; T2WM=36±2ms) and Glx (T1WM=167±22ms; T1GM=173±12ms; T2GM=36±1ms; T2WM=34±1ms) were not significantly different between GM and WM.
Impact: Many severe brain pathologies feature regional differences in brain glucose metabolism, therefore tissue-specific (grey and white matter) relaxation times (T1 and T2) of deuterium labeled resonances are needed for accurate concentration estimation of the kinetics of energy metabolites (Glc,Glx).
Introduction
Impaired glucose metabolism plays an important role in many common brain diseases such as cancer, neurodegenerative diseases or diabetes1–3. Deuterium Metabolic Imaging (DMI) maps brain glucose (Glc) uptake and synthesis of downstream metabolites (e.g. glutamate+glutamine (Glx), lactate (Lac)) using deuterium labeled (2H) Glc as a harmless and stable tracer4–10.To estimate metabolite concentrations accurately tissue specific T1/T2 relaxation times of 2H-Glc and 2H-Glx would be desirable. However, only unlocalized relaxation constants of deuterium resonances (e.g. Glc, Glx, Lac) have been reported4,5,7,8, as prolonged acquisition times of conventional MRSI sequences limit the achievable spatial resolution and single-voxel localization is not feasible.
The aim of this study was to measure tissue-specific T1/T2 relaxation times of deuterium resonances in the human brain by implementing Inversion recovery and Hahn spin-echo acquisition schemes in a 3D FID 2H-MRSI sequence11 with concentric ring trajectory (CRT) readout.
Methods
A 3D 2H-FID-MRSI sequence using hamming-weighted CRT11 sampling was modified to implement Inversion recovery and Hahn spin-echo acquisitions. Each trajectory was repeatedly acquired with variable inversion/echo time, see Figure1b. Unlocalized FID acquisitions were additionally temporally interleaved (every 70th TR) to monitor Glc and Glx levels and allow a direct within-session comparison.All measurements were performed on an experimental 7T (Terra-dot-Plus) Siemens MR system using a 2H/1H dual-tuned quadrature bird-cage head coil (Stark Contrast MRI). The sequence was validated on a water phantom to detect natural abundance water (voxel volume=1.96ml, TR=1500ms, TE=2ms; six TIs: 5-1500ms; seven TEs: 10-1000ms) and results were compared with values obtained by a non-localized FID sequence.
Eight healthy volunteers (7m/1f) were scanned in the morning after overnight fasting and 90min after oral [6,6’]-²H glucose administration (0.8 g/kg body weight) during steady state, see Figure1a. Following anatomical MP2RAGE acquisitions, the 3D-MRSI (either T1 or T2) protocol was employed using the following parameters: FOV=200x200x192mm; nominal isotropic volume=0.77ml; TRT1/T2=500/400ms; six TIs: 5-500ms; eight TEs: 6-60ms, TAT1/T2=40/30min.
Additionally, one subject was remeasured without glucose administration to measure relaxation times of natural abundance water (TRT1/T2=900/400ms; five TIs: 5-900ms; six TEs: 6-60ms).
Data was reconstructed using in-house post-processing (MATLAB R2021, LCModel, Python3.10). WM and GM voxels were segmented based on MP2RAGE images considering partial volume effects (threshold>60%), and spectra were averaged before spectral fitting. Relaxation times were obtained assuming a 2/3 variable fit (T1: $$$f_1(t)=a*(1–b*e^{-\frac{TI}{T_1}})$$$, T2: $$$f_2(t)=a*e^{-\frac{TE}{T_2}}$$$).
Results
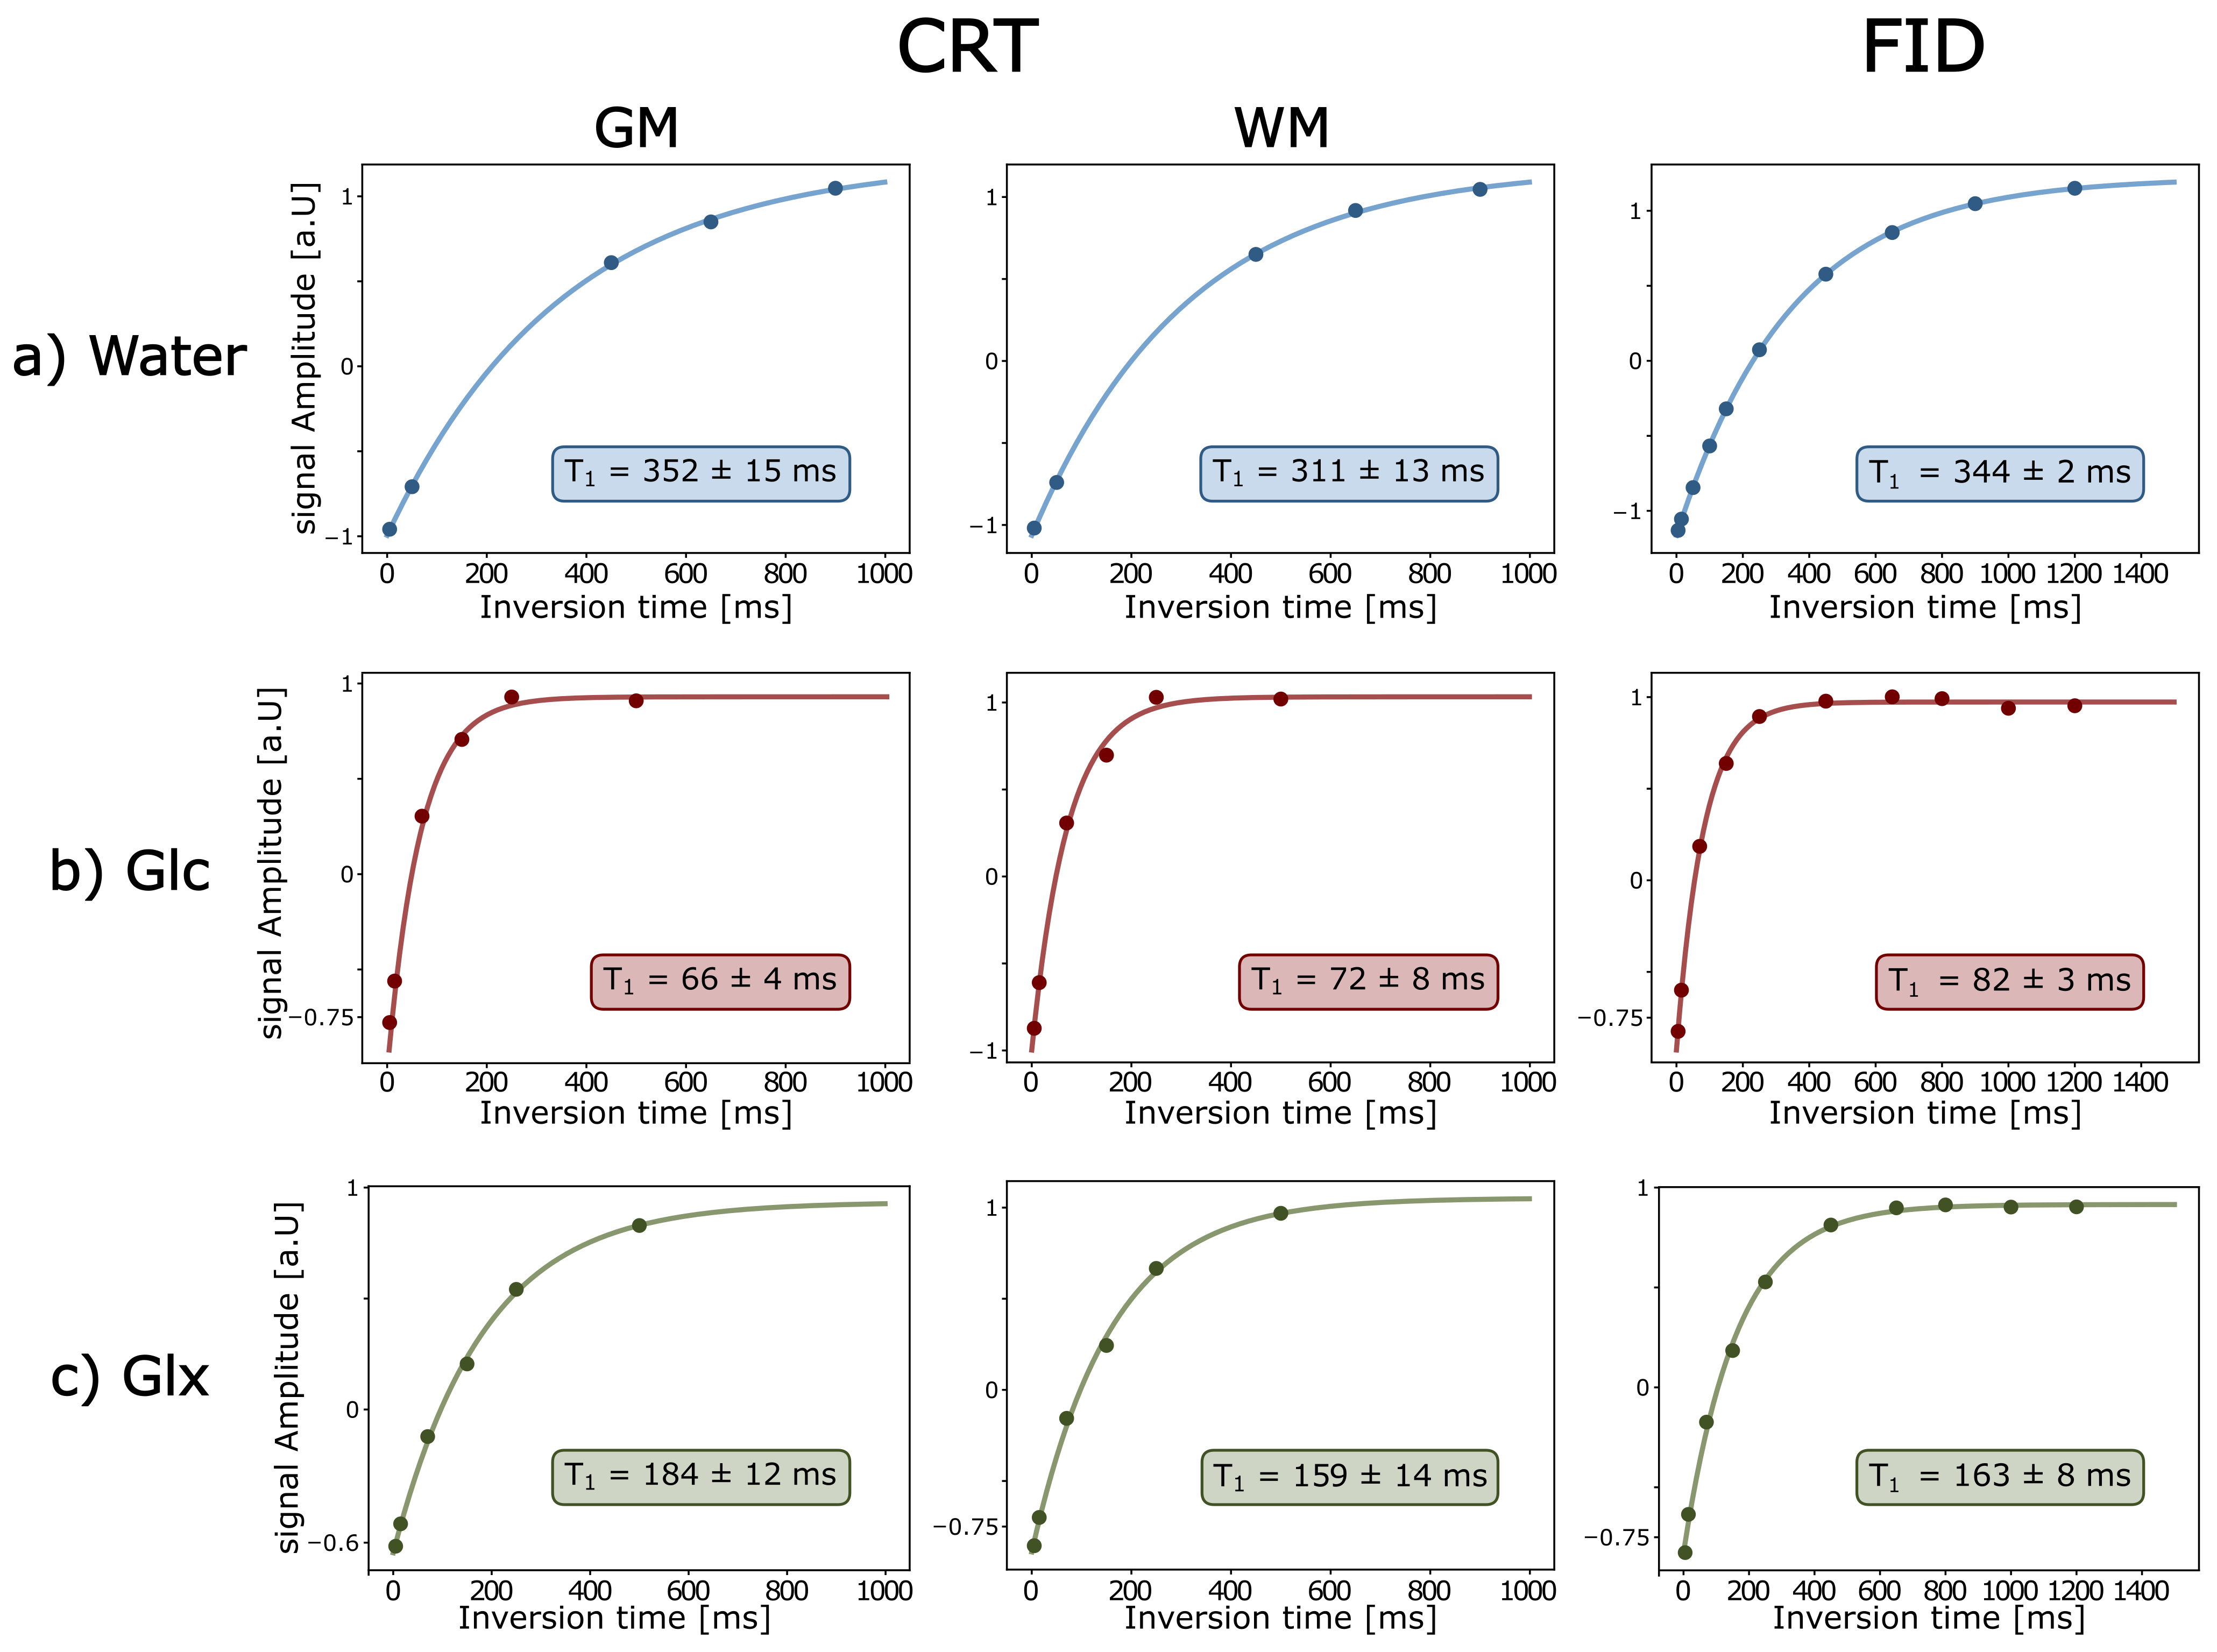
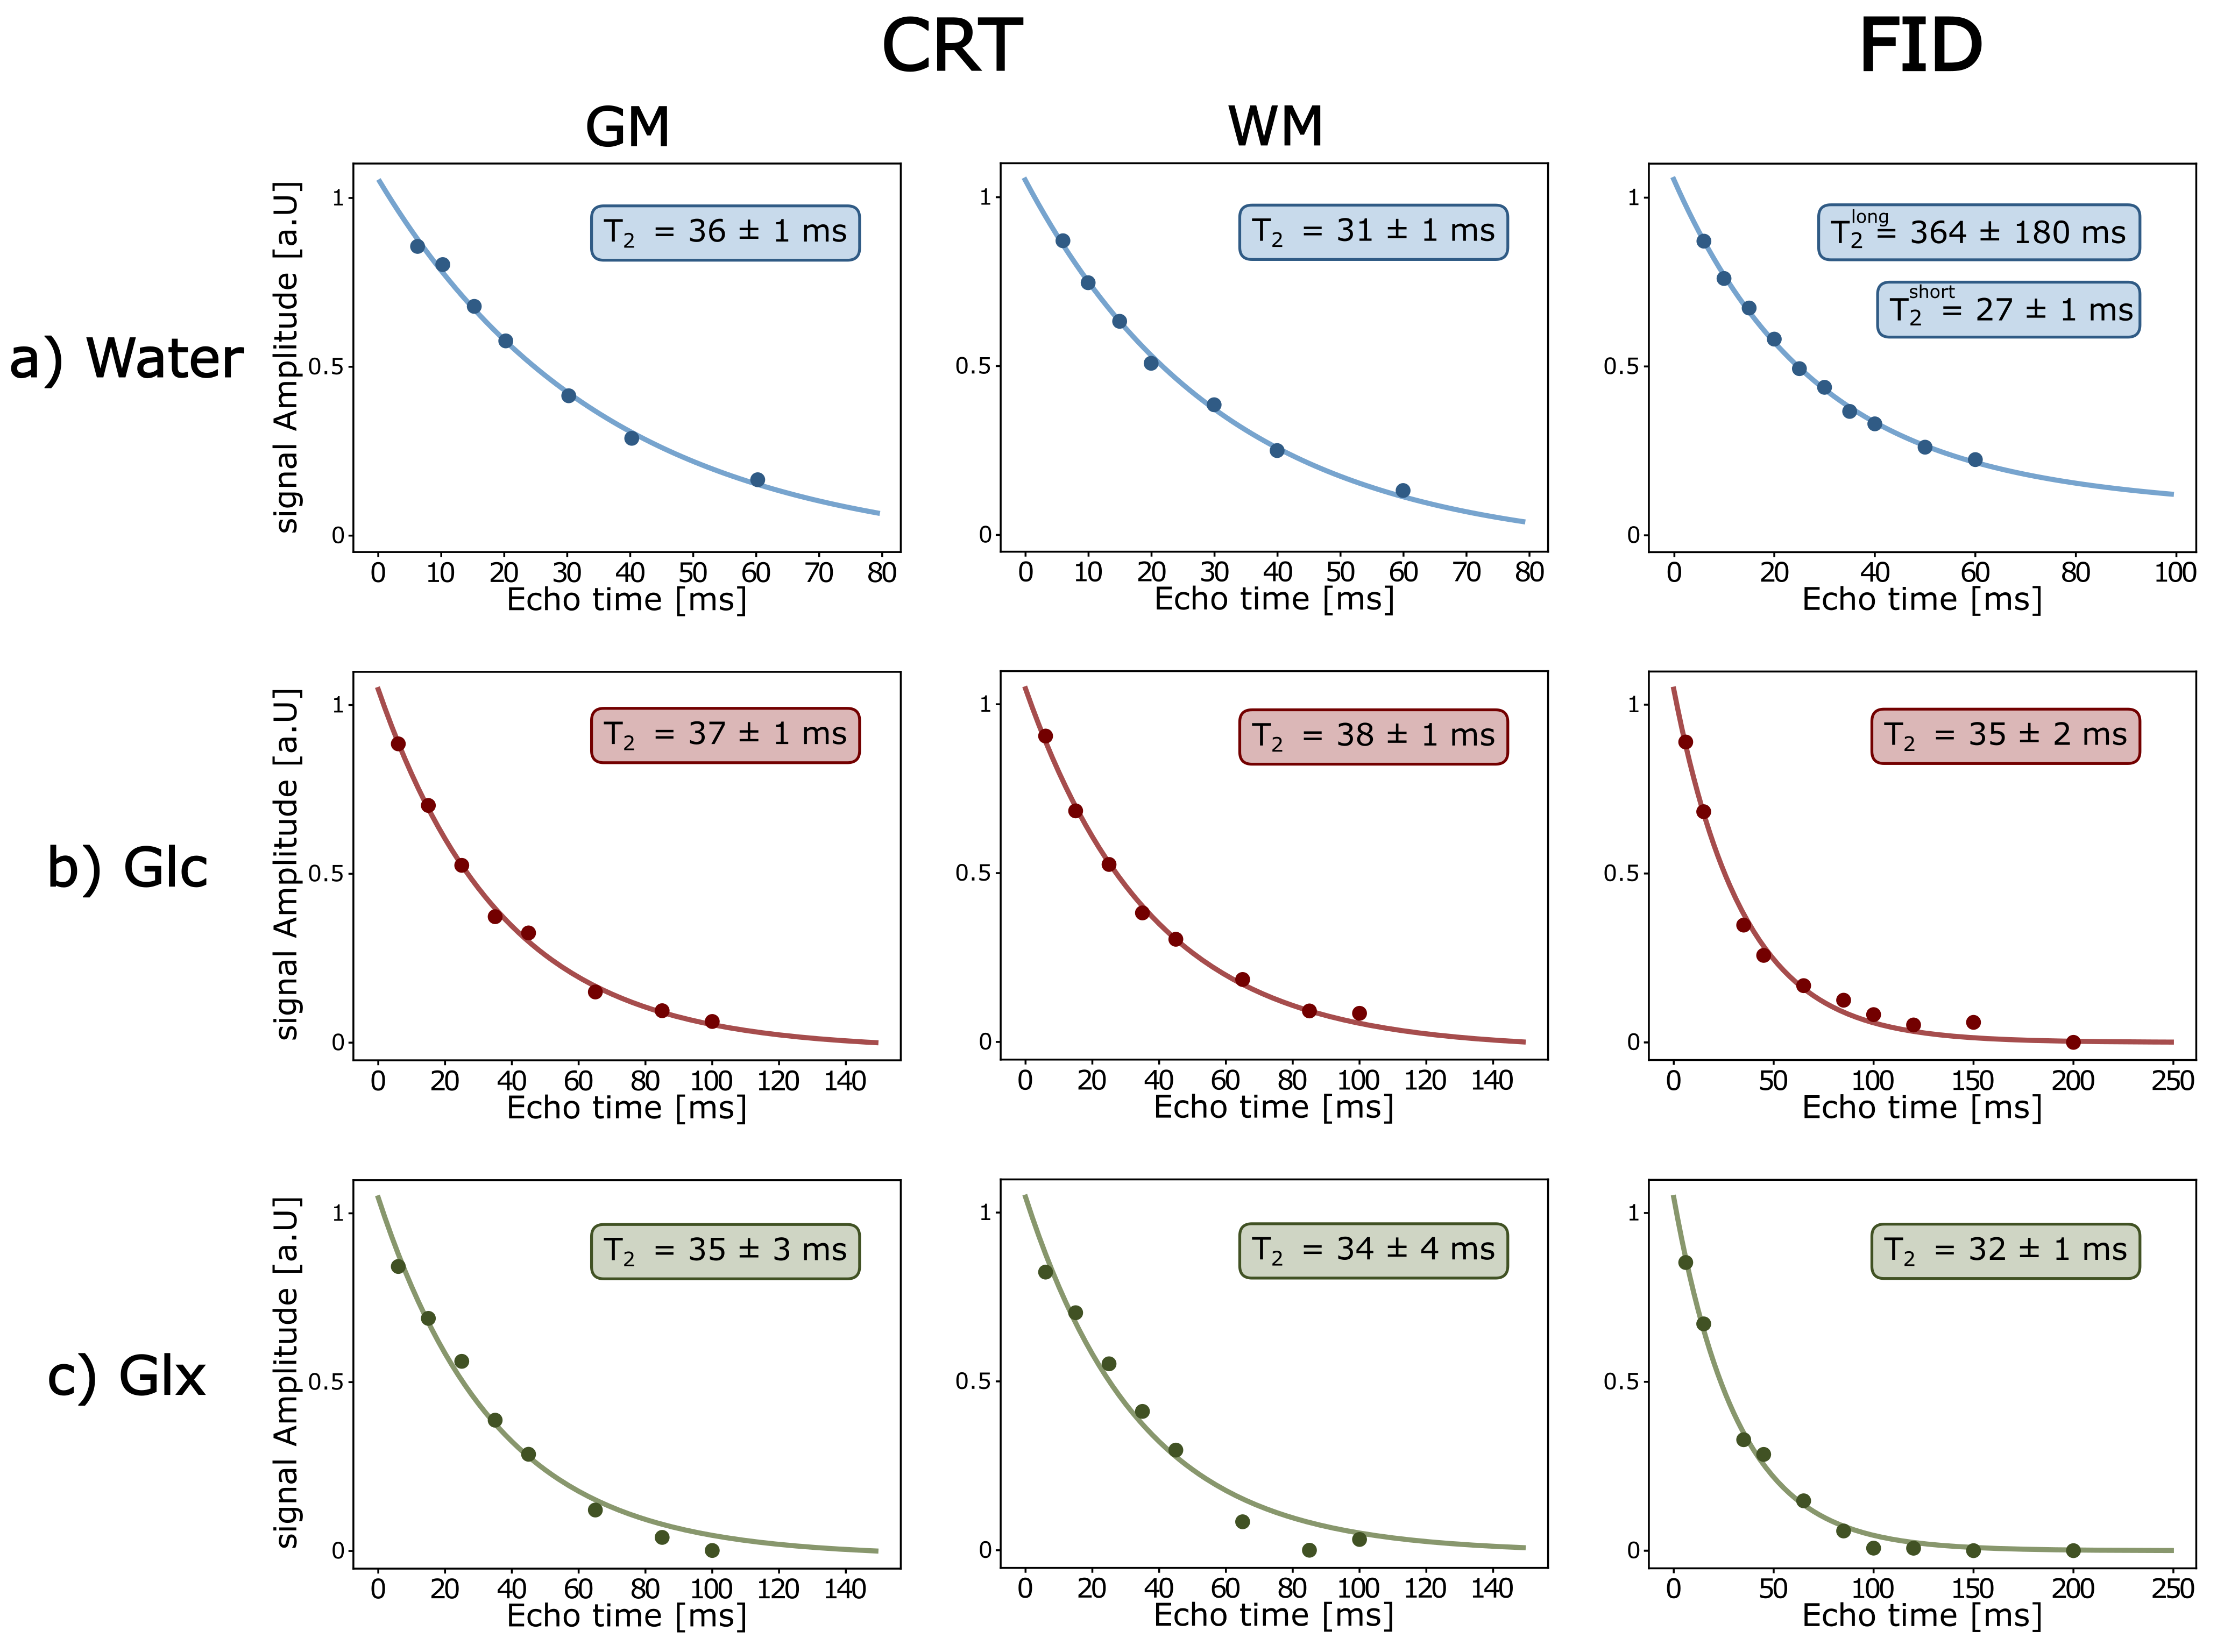
Relaxation times acquired in phantom were consistent between CRT-based 3D-MRSI and non-localized FID acquisitions (T1CRT=423±3ms, T1FID=428±3ms; T2CRT=421±11ms, T2FID=442±4ms).In vivo relaxation times were not significantly different between GM and WM dominated regions for Glc (T1GM/T1WM=56±14/60±19ms, p=0.37; T2GM/T2WM=37±1/36±2ms, p=0.42) and Glx (T1GM/T1WM=167±22/173±12ms, p=0.58; T2GM/T2WM=36±1/34±1ms, p=0.13). Differences between CRT and FID acquisition could be observed for GM (T1: pGlc=0.001; T2: pGlx=0.02) and WM (T1: pGlc=0.03; T2: pGlc=0.02). Individual results are listed in Table1 and representative exponential fits of T1/T2 constants are shown in Figure2-3. Interleaved FID acquisitions revealed relatively stable Glc/Glx levels throughout the measurements with a coefficient of variation of 6±1% and 7±1%, respectively.
T1/T2 values of the natural abundance water measured in one volunteer (T1GM=352±15ms; T2GM=36±1ms, T1WM=311±13ms; T2WM=31±1ms) were in line with results obtained with non-localized FID scans (T1FID=344±2ms; T2FID/short=27±1ms, T2FID/long=364±180ms). For the latter, a bi-exponential fit was used.
Discussion and Conclusion
In this study, we successfully implemented Inversion recovery and Hahn Spin-Echo acquisition schemes into a 3D-CRT-MRSI sequence to measure tissue-specific T1/T2 relaxation times of deuterium resonances (water, Glc, Glx) in the human brain.Tissue-specific relaxation times of Glc and Glx for GM and WM regions are in good agreement with literature4,5, yet no differences were found between GM and WM values. Although, differences between CRT and FID acquisition schemes were found, values were within the standard deviation and on average 5-19% different. This could presumably be caused by differences in the acquisition protocol for FID scans (longer TR, higher number of TI/TE). However, a reliable statistical analysis is difficult given the relatively low sample size of this study (nT1=6, nT2=3).
Natural abundance T1/T2 relaxation values in GM and WM acquired from one volunteer were in the same range as reported T1 values12 for GM and WM and unlocalized T2 values4,5,8.
In this study, we presented a novel 3D MRSI sequence to measure T1/T2 relaxation time constants dynamically with sub-milliliter isotropic resolution and measured tissue-specific relaxation times of deuterium resonances (water, Glc, Glx) in phantom and in vivo after oral 2H labeled glucose administration. The sequence is not limited to a specific nucleus and could help to detect local variations in relaxation times, as often observed for certain pathologies and ultimately improve accuracy of concentration estimation in future studies.
Acknowledgements
Austrian Science Fund: KLI 1106, WEAVE I 6037
Christian Doppler Laboratory for MR Imaging Biomarkers (BIOMAK)
References
1. Koppenol WH, Bounds PL, Dang CV. Otto Warburg’s contributions to current concepts of cancer metabolism. Nat Rev Cancer. 2011;11(5):325-337. doi:10.1038/nrc3038
2. Norat P, Soldozy S, Sokolowski JD, et al. Mitochondrial dysfunction in neurological disorders: Exploring mitochondrial transplantation. Npj Regen Med. 2020;5(1):1-9. doi:10.1038/s41536-020-00107-x
3. Manji H, Kato T, Di Prospero NA, et al. Impaired mitochondrial function in psychiatric disorders. Nat Rev Neurosci. 2012;13(5):293-307. doi:10.1038/nrn3229
4. De Feyter HM, de Graaf RA. Deuterium metabolic imaging – Back to the future. J Magn Reson. 2021;326:106932. doi:10.1016/j.jmr.2021.106932
5. De Feyter HM, Behar KL, Corbin ZA, et al. Deuterium metabolic imaging (DMI) for MRI-based 3D mapping of metabolism in vivo. Sci Adv. 2018;4(8):eaat7314. doi:10.1126/sciadv.aat7314
6. Lu M, Zhu XH, Zhang Y, Mateescu G, Chen W. Quantitative assessment of brain glucose metabolic rates using in vivo deuterium magnetic resonance spectroscopy. J Cereb Blood Flow Metab. 2017;37(11):3518-3530. doi:10.1177/0271678X17706444
7. Ruhm L, Avdievich N, Ziegs T, et al. Deuterium metabolic imaging in the human brain at 9.4 Tesla with high spatial and temporal resolution. NeuroImage. 2021;244:118639. doi:10.1016/j.neuroimage.2021.118639
8. Serés Roig E, De Feyter HM, Nixon TW, et al. Deuterium metabolic imaging of the human brain in vivo at 7 T. Magn Reson Med. 2023;89(1):29-39. doi:10.1002/mrm.29439
9. Bednarik P, Goranovic D, Svatkova A, et al. 1H magnetic resonance spectroscopic imaging of deuterated glucose and of neurotransmitter metabolism at 7 T in the human brain. Nat Biomed Eng. 2023;7(8):1001-1013. doi:10.1038/s41551-023-01035-z
10. Niess F, Strasser B, Hingerl L, et al. Reproducibility of 3D MRSI for imaging human brain glucose metabolism using direct (2H) and indirect (1H) detection of deuterium labeled compounds at 7T and clinical 3T. NeuroImage. 2023;277:120250. doi:10.1016/j.neuroimage.2023.120250
11. Clarke WT, Hingerl L, Strasser B, Bogner W, Valkovič L, Rodgers CT. Three-dimensional, 2.5-minute, 7T phosphorus magnetic resonance spectroscopic imaging of the human heart using concentric rings. NMR Biomed. 2023;36(1):e4813. doi:10.1002/nbm.4813
12. Cocking D, Damion RA, Franks H, et al. Deuterium brain imaging at 7T during D 2 O dosing. Magn Reson Med. 2023;89(4):1514-1521. doi:10.1002/mrm.29539
Figures
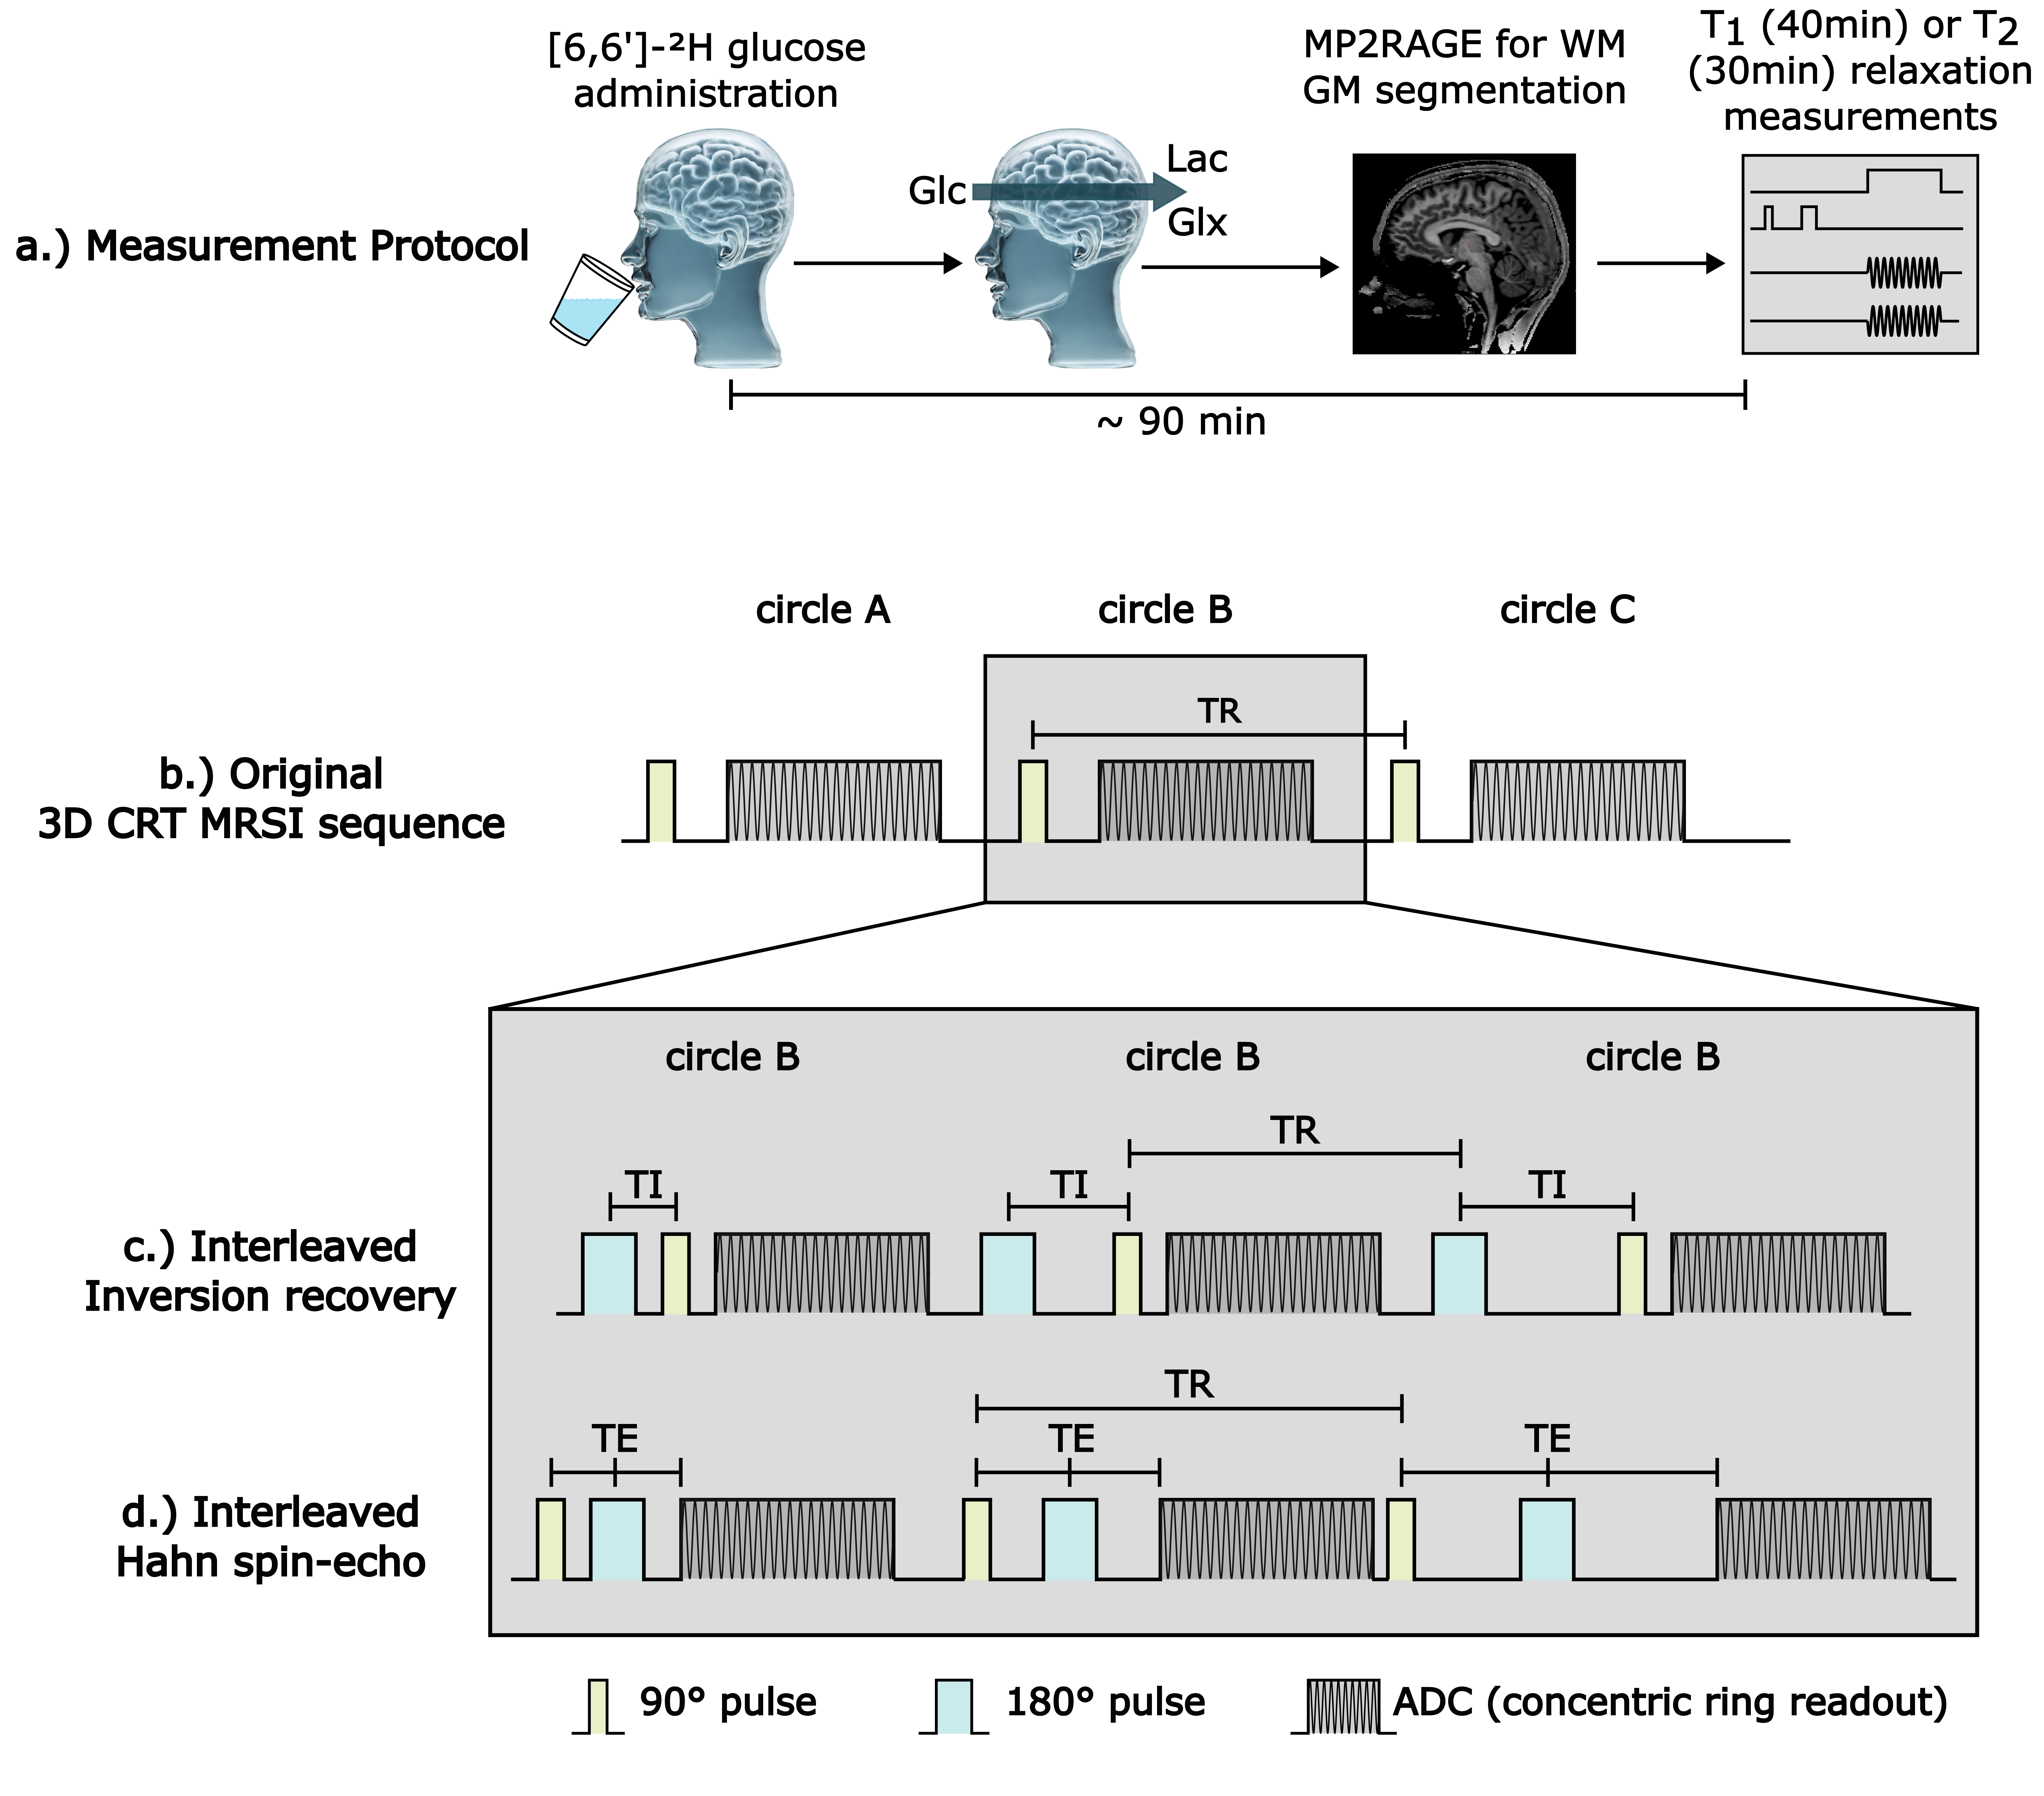
Figure 1: Illustration of the in vivo measurement protocol (a). Relaxation measurements were performed ~90min after oral glucose administration. Simplified illustration of the original 3D FID 2H-MRSI sequence with three representative concentric ring trajectories A-C (b). Inversion recovery (c) and Hahn spin-echo (d) acquisition schemes were implemented in an interleaved manner. Each ring trajectory is measured consecutively with variable TI/TE while k-space is sampled from k-space center outwards.