3056
Metabolic response of paediatric-type diffuse high grade glioma cells to PI3K inhibition detected by 2H-MRS1Division of Radiotherapy & Imaging, Institute of Cancer Research, London, United Kingdom, 2School of Biomedical Engineering and Imaging Sciences, Kings College London, London, United Kingdom, 3Division of Molecular Pathology, Institute of Cancer Research, London, United Kingdom, 4Cancer Therapeutics Unit, Institute of Cancer Research, London, United Kingdom, 5Molecular Pathology, Institute of Cancer Research, London, United Kingdom
Synopsis
Keywords: Deuterium, Deuterium, Preclinical
Motivation: Effective treatment response seen in paediatric-type diffuse high grade glioma with conventional MRI can take months to manifest.
Goal(s): Evaluation of 2H-MRS for monitoring the metabolism of deuterated glucose in PDHGG cells and assessing early metabolic response to PI3K inhibition.
Approach: PIK3R1 mutant neurospheres were treated with a dual PI3K/mTOR inhibitor for 72 and 24 hours, and 2H spectra dynamically acquired in the presence of [6,6-2H2]-glucose.
Results: Treatment significantly reduced glycolytic rates at both timepoints. At 24 hours there was no difference in cell number or viability, highlighting the potential of 2H-MRS to provide an early biomarker of response.
Impact: Establishing acute treatment-induced changes in the glycolytic rate of PDHGG neurospheres using 2H-MRS provides confidence in the sensitivity of deuterium metabolic imaging for assessing the early response of orthotopic PDHGG models to PI3K inhibition in vivo.
Introduction
Paediatric-type diffuse high grade glioma (PDHGG) is a devastating childhood cancer with a dismal average survival of 9-15 months[1]. Recent advances in the understanding of the underlying disease biology have revealed dysregulated signalling pathways and druggable targets. One such pathway is PI3K/AKT/mTOR[2], which upregulates many glycolytic enzymes, contributing to abnormal lactate production from glucose metabolism even when oxygen is abundant[3]. Hence, successful inhibition of the pathway would be expected to result in a reduction in glucose consumption and lactate production.Deuterium metabolic imaging (DMI) is an MR spectroscopic imaging technique which, coupled with judicious choice of 2H-labelled substrates, can inform on specific metabolic pathways in vivo[4]. The glycolytic metabolism of both in vivo adult brain tumour models and glioma patients has been investigated by DMI using [6,6-2H2]-glucose[4-8].
As a prelude to in vivo DMI studies, a novel in vitro 2H-MRS approach was developed and used to characterise and confirm the anticipated effects of the dual PI3K/mTOR inhibitor paxalisib (GDC-0084) on glycolysis in PDHGG cells harbouring a PIK3R1 mutation.
Methods
Patient-derived PDHGG ICR-B181_3D cells, grown as neurospheres in stem cell culture medium, were initially treated for 72 hours with either 0.36µM paxalisib (GI50 established in a 192hr assay, data not shown, n=9) or vehicle (0.0036% DMSO, n=8), to confirm that the drug elicited a metabolic response. A second experiment was performed using the same conditions but for just 24 hours (paxalisib n=8, vehicle n=9) to assess any acute metabolic response.Cells were counted on a haemocytometer, and viability scored with trypan blue. Cells were dissociated and resuspended in glucose-free medium containing paxalisib or DMSO, plus [6,6-2H2]-glucose at a final concentration of 10mM, and immediately placed into a 600MHz vertical bore NMR magnet (Bruker). 2H spectra (AQ_mod=DQD, TR=500ms, averages=64, TD=1024, SW=20.1ppm) were acquired over ~48 minutes, with all spectra being apodized to 2 Hz and zero filled to 4096 points. Peak integrals of each metabolite were calculated in TopSpin. Metabolite integrals were then calibrated to 10mM using the maximal integral of glucose to give metabolite concentrations in mM. Least squares fitting using the MATLAB function lsqcurvefit was used to obtain metrics of the rate of metabolic conversion of glucose into lactate in pmol per million cells per second (kgl[Glu]). If the linewidth of the deuterated water peak surpassed 0.125ppm at the intermediate point of the acquisition, the shim was deemed insufficient to achieve reliable quantification, and the data was excluded (n=2).
Results and Discussion
From the 2H spectra, metabolite peaks for semi-heavy water (HDO), glucose (Glu) and lactate (Lac) were readily resolved at 4.7ppm, 3.8ppm and 1.3ppm respectively, allowing for their integral to be determined (Figures 2A&B/3A&B). Once calibrated to mM concentrations, a clear reduction in both glucose consumption and lactate production was evident in paxalisib-treated ICR-B181_3D cells at both 72 and 24hrs (Figures 1C/2C).The summation of lactate divided by the summation of glucose can give a good approximation of the glycolytic rate without the need for fitting[9]. For both timepoints, the ratio of lactate to glucose normalised to cell number was significantly lower in the paxalisib-treated cells (Figure 1D/2D). Similarly, a significant decrease in kgl[Glu] was determined in cells treated with paxalisib at both 72 (Figure 1E) and 24 hours (Figure 2E). Both these metrics of glycolysis were higher at 24 hours than after 72 hours treatment, but the magnitude of the effect size between the treated and control cells remained consistent (3.6x and 3.7x lower at 24 and 72 hours, respectively).
The culture medium was not replenished during the 72hr experiments, therefore nutrient depletion and an accumulation of inhibitory metabolites could put these neurospheres under additional stress, compared with 24hr incubations, and potentially alter their metabolism. Further experiments are required to validate this hypothesis.
After 24hrs there was no significant difference in cell viability (treated 91.4±2.8%, control 91.3±3.3%, mean±SD, p=0.82, Mann-Whitney) or cell number (treated 3.0±1.5x10⁶, control 3.7±1.8x10⁶ cells, p=0.34) between treated and control neurospheres. This implies that cellular metabolism has been altered by PI3K inhibition prior to any alteration in cell proliferation or viability, and is quantifiable by 2H-MRS.
Conclusion
PI3K inhibition with paxalisib resulted in a significant reduction in the rate of metabolism of glucose into lactate in ICR-B181_3D PDHGG cells at both 24 and 72hrs. At 24hrs there was no clear difference in cell number or viability between treated and control cells. 2H-MRS holds great potential for assessing early treatment response to PI3K inhibition in PDHGG.Acknowledgements
We acknowledgement support from the Cancer Research UK Centre at the ICR, Cancer Research UK grant C16412/A27725 and a Children with Cancer UK Research Fellowship.References
1. Cloughesy, T.F., W.K. Cavenee, and P.S. Mischel, Glioblastoma: from molecular pathology to targeted treatment. Annu Rev Pathol, 2014. 9: p. 1-25.
2. Mackay, A., et al., Integrated Molecular Meta-Analysis of 1,000 Pediatric High-Grade and Diffuse Intrinsic Pontine Glioma. Cancer Cell, 2017. 32(4): p. 520-537 e5.
3. Barzegar Behrooz, A., et al., Wnt and PI3K/Akt/mTOR Survival Pathways as Therapeutic Targets in Glioblastoma. Int J Mol Sci, 2022. 23(3).
4. De Feyter, H.M., et al., Deuterium metabolic imaging (DMI) for MRI-based 3D mapping of metabolism in vivo. Sci Adv, 2018. 4(8): p. eaat7314.
5. Simoes, R.V., et al., Glucose fluxes in glycolytic and oxidative pathways detected in vivo by deuterium magnetic resonance spectroscopy reflect proliferation in mouse glioblastoma. Neuroimage Clin, 2022. 33: p. 102932.
6. Taglang, C., et al., Deuterium magnetic resonance spectroscopy enables noninvasive metabolic imaging of tumor burden and response to therapy in low-grade gliomas. Neuro Oncol, 2022. 24(7): p. 1101-1112.
7. Hesse, F., et al., Imaging Glioblastoma Response to Radiotherapy Using 2H Magnetic Resonance Spectroscopy Measurements of Fumarate Metabolism. Cancer Res, 2022. 82(19): p. 3622-3633.
8. Rich, L.J., et al., (1)H magnetic resonance spectroscopy of (2)H-to-(1)H exchange quantifies the dynamics of cellular metabolism in vivo. Nat Biomed Eng, 2020. 4(3): p. 335-342.
9. Hill, D.K., et al., Model free approach to kinetic analysis of real-time hyperpolarized 13C magnetic resonance spectroscopy data. PLoS One, 2013. 8(9): p. e71996.
Figures
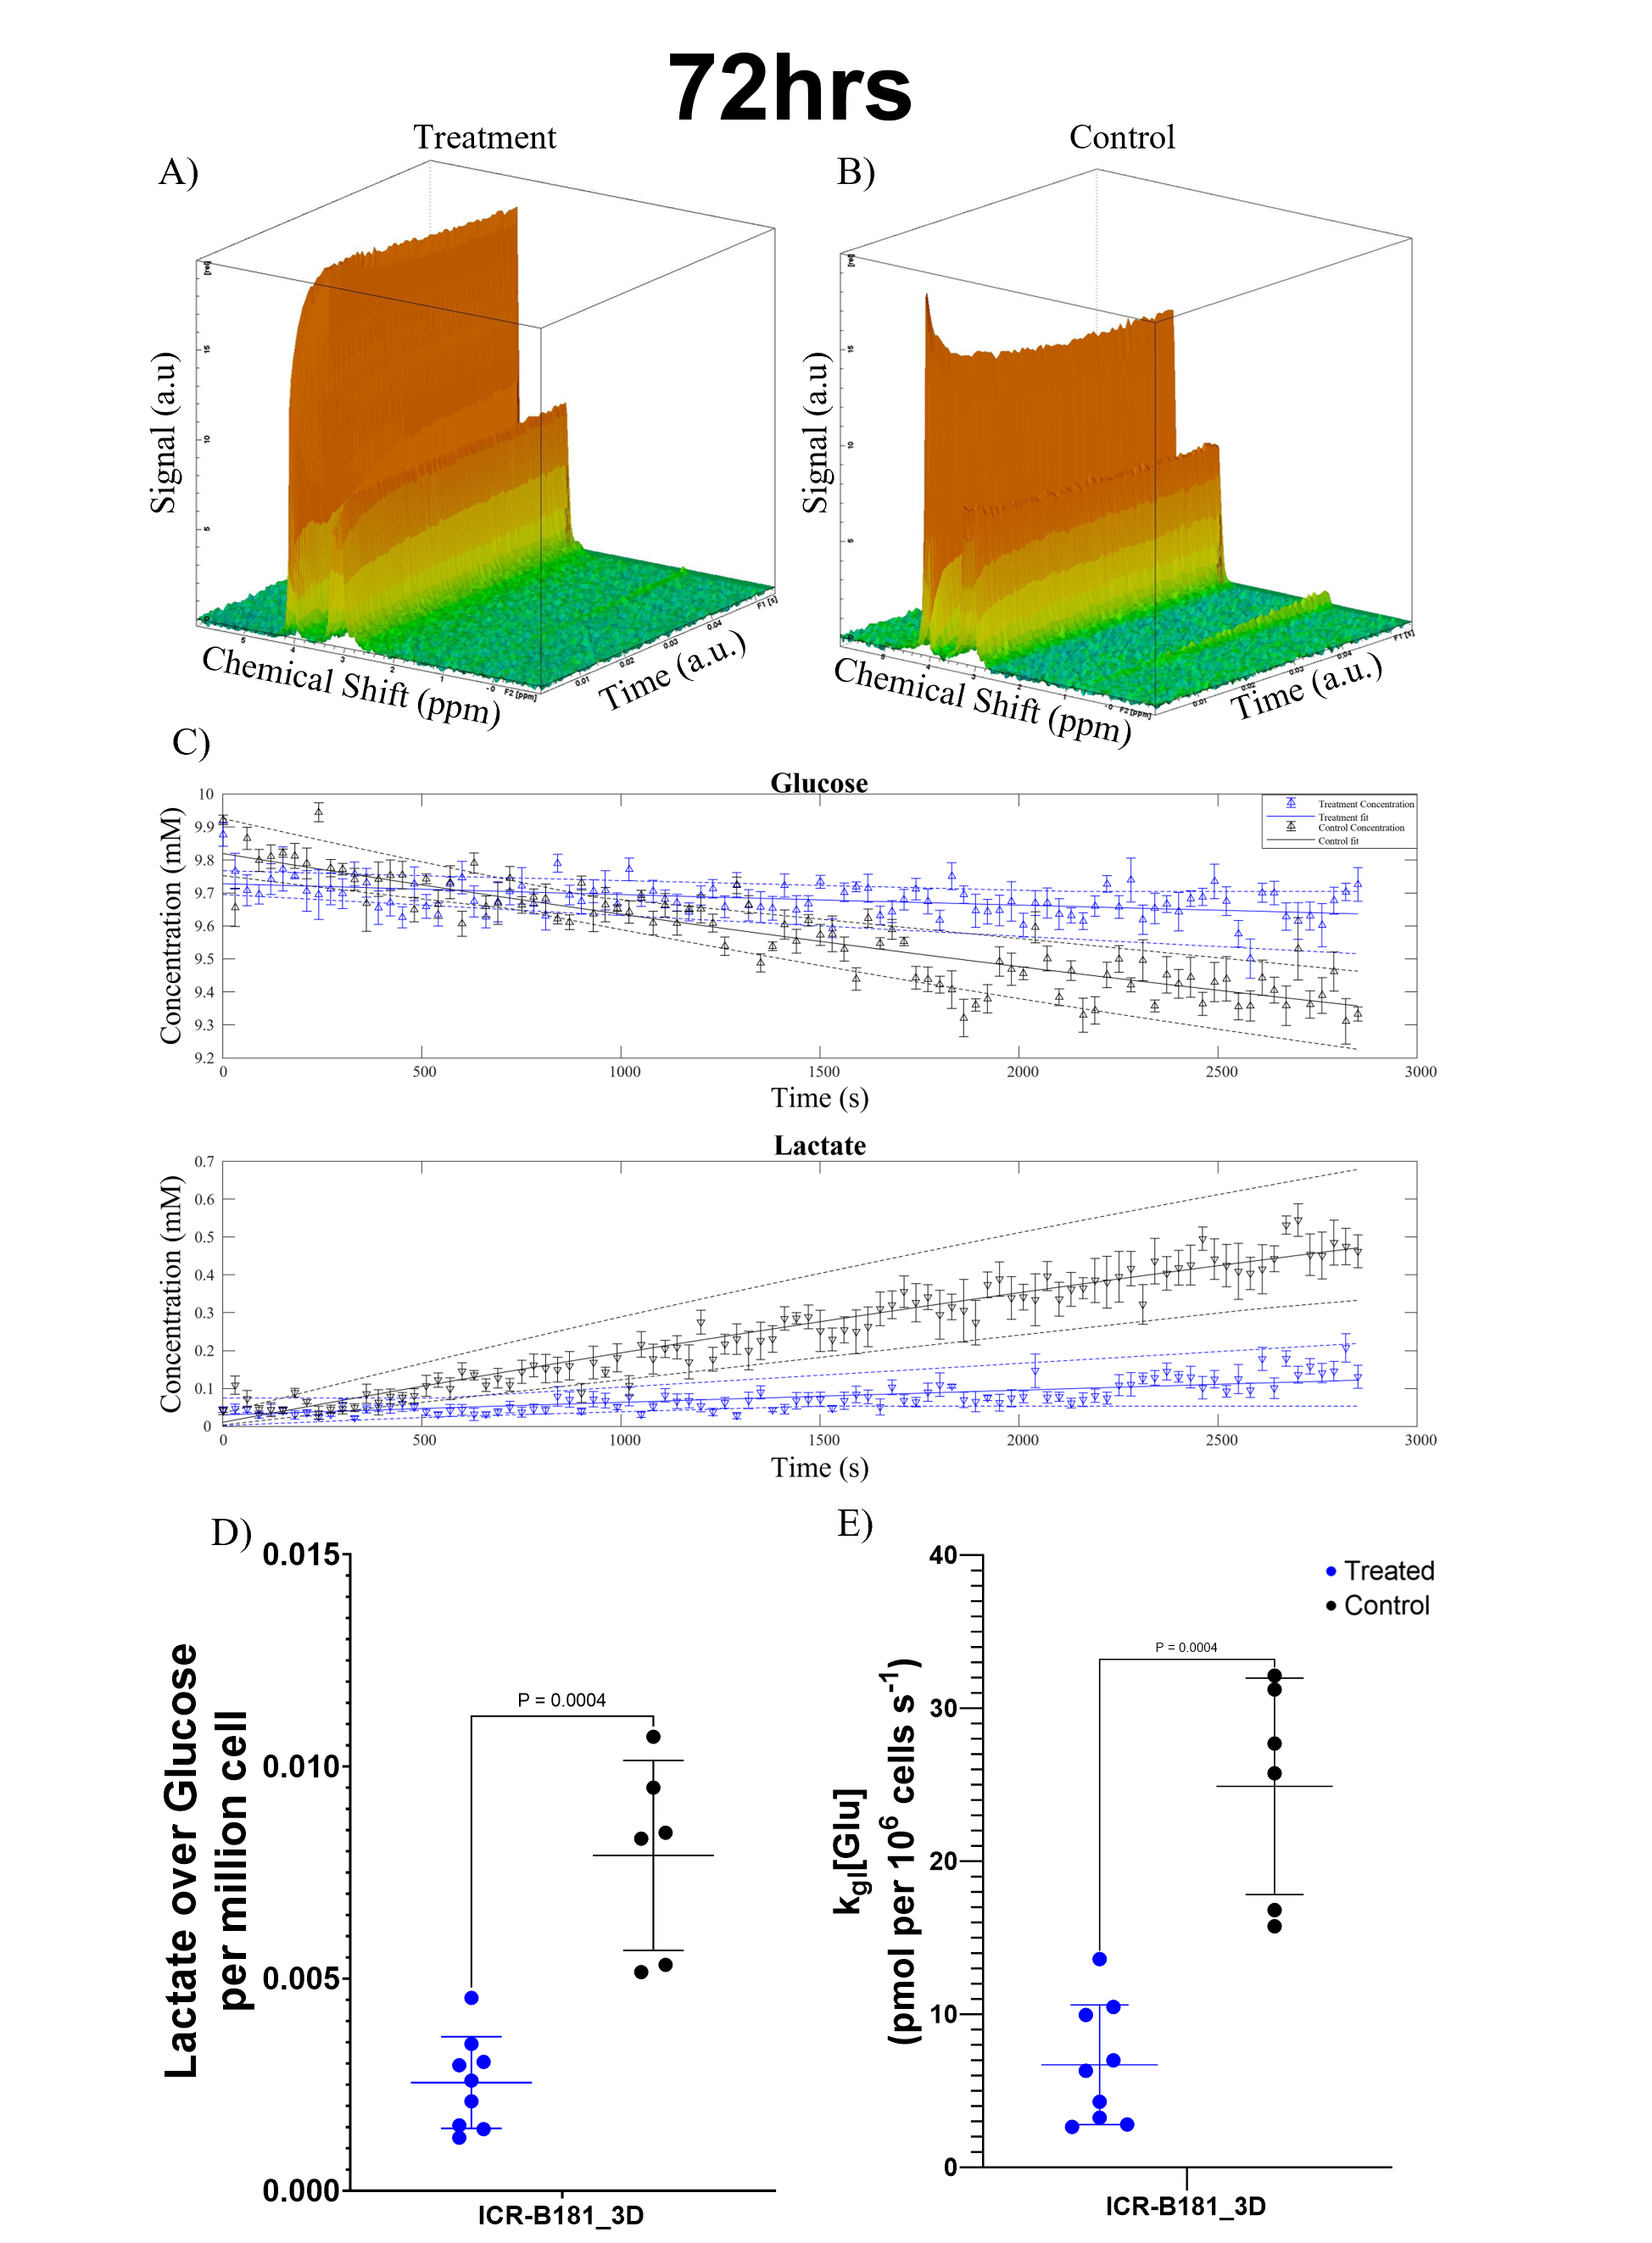
Figure 1: 2H NMR results from ICR-B181_3D cells treated with paxalisib or vehicle for 72 hours. Representative spectra from dynamic 2H NMR of A) treated and B) control cells. C) Summation of glucose and lactate concentrations from n=6 repeats expressed as mean ± standard deviation. Also shown is the mean fit (solid line) and minimum and max fit (dotted lines). D) Lactate over glucose ratio, normalised to cell number. E) kgl[Glu] expressed in pmol per 106 cells s-1. Treated cells are depicted in blue and controls in black throughout, p values calculated with a Mann-Whitney test.
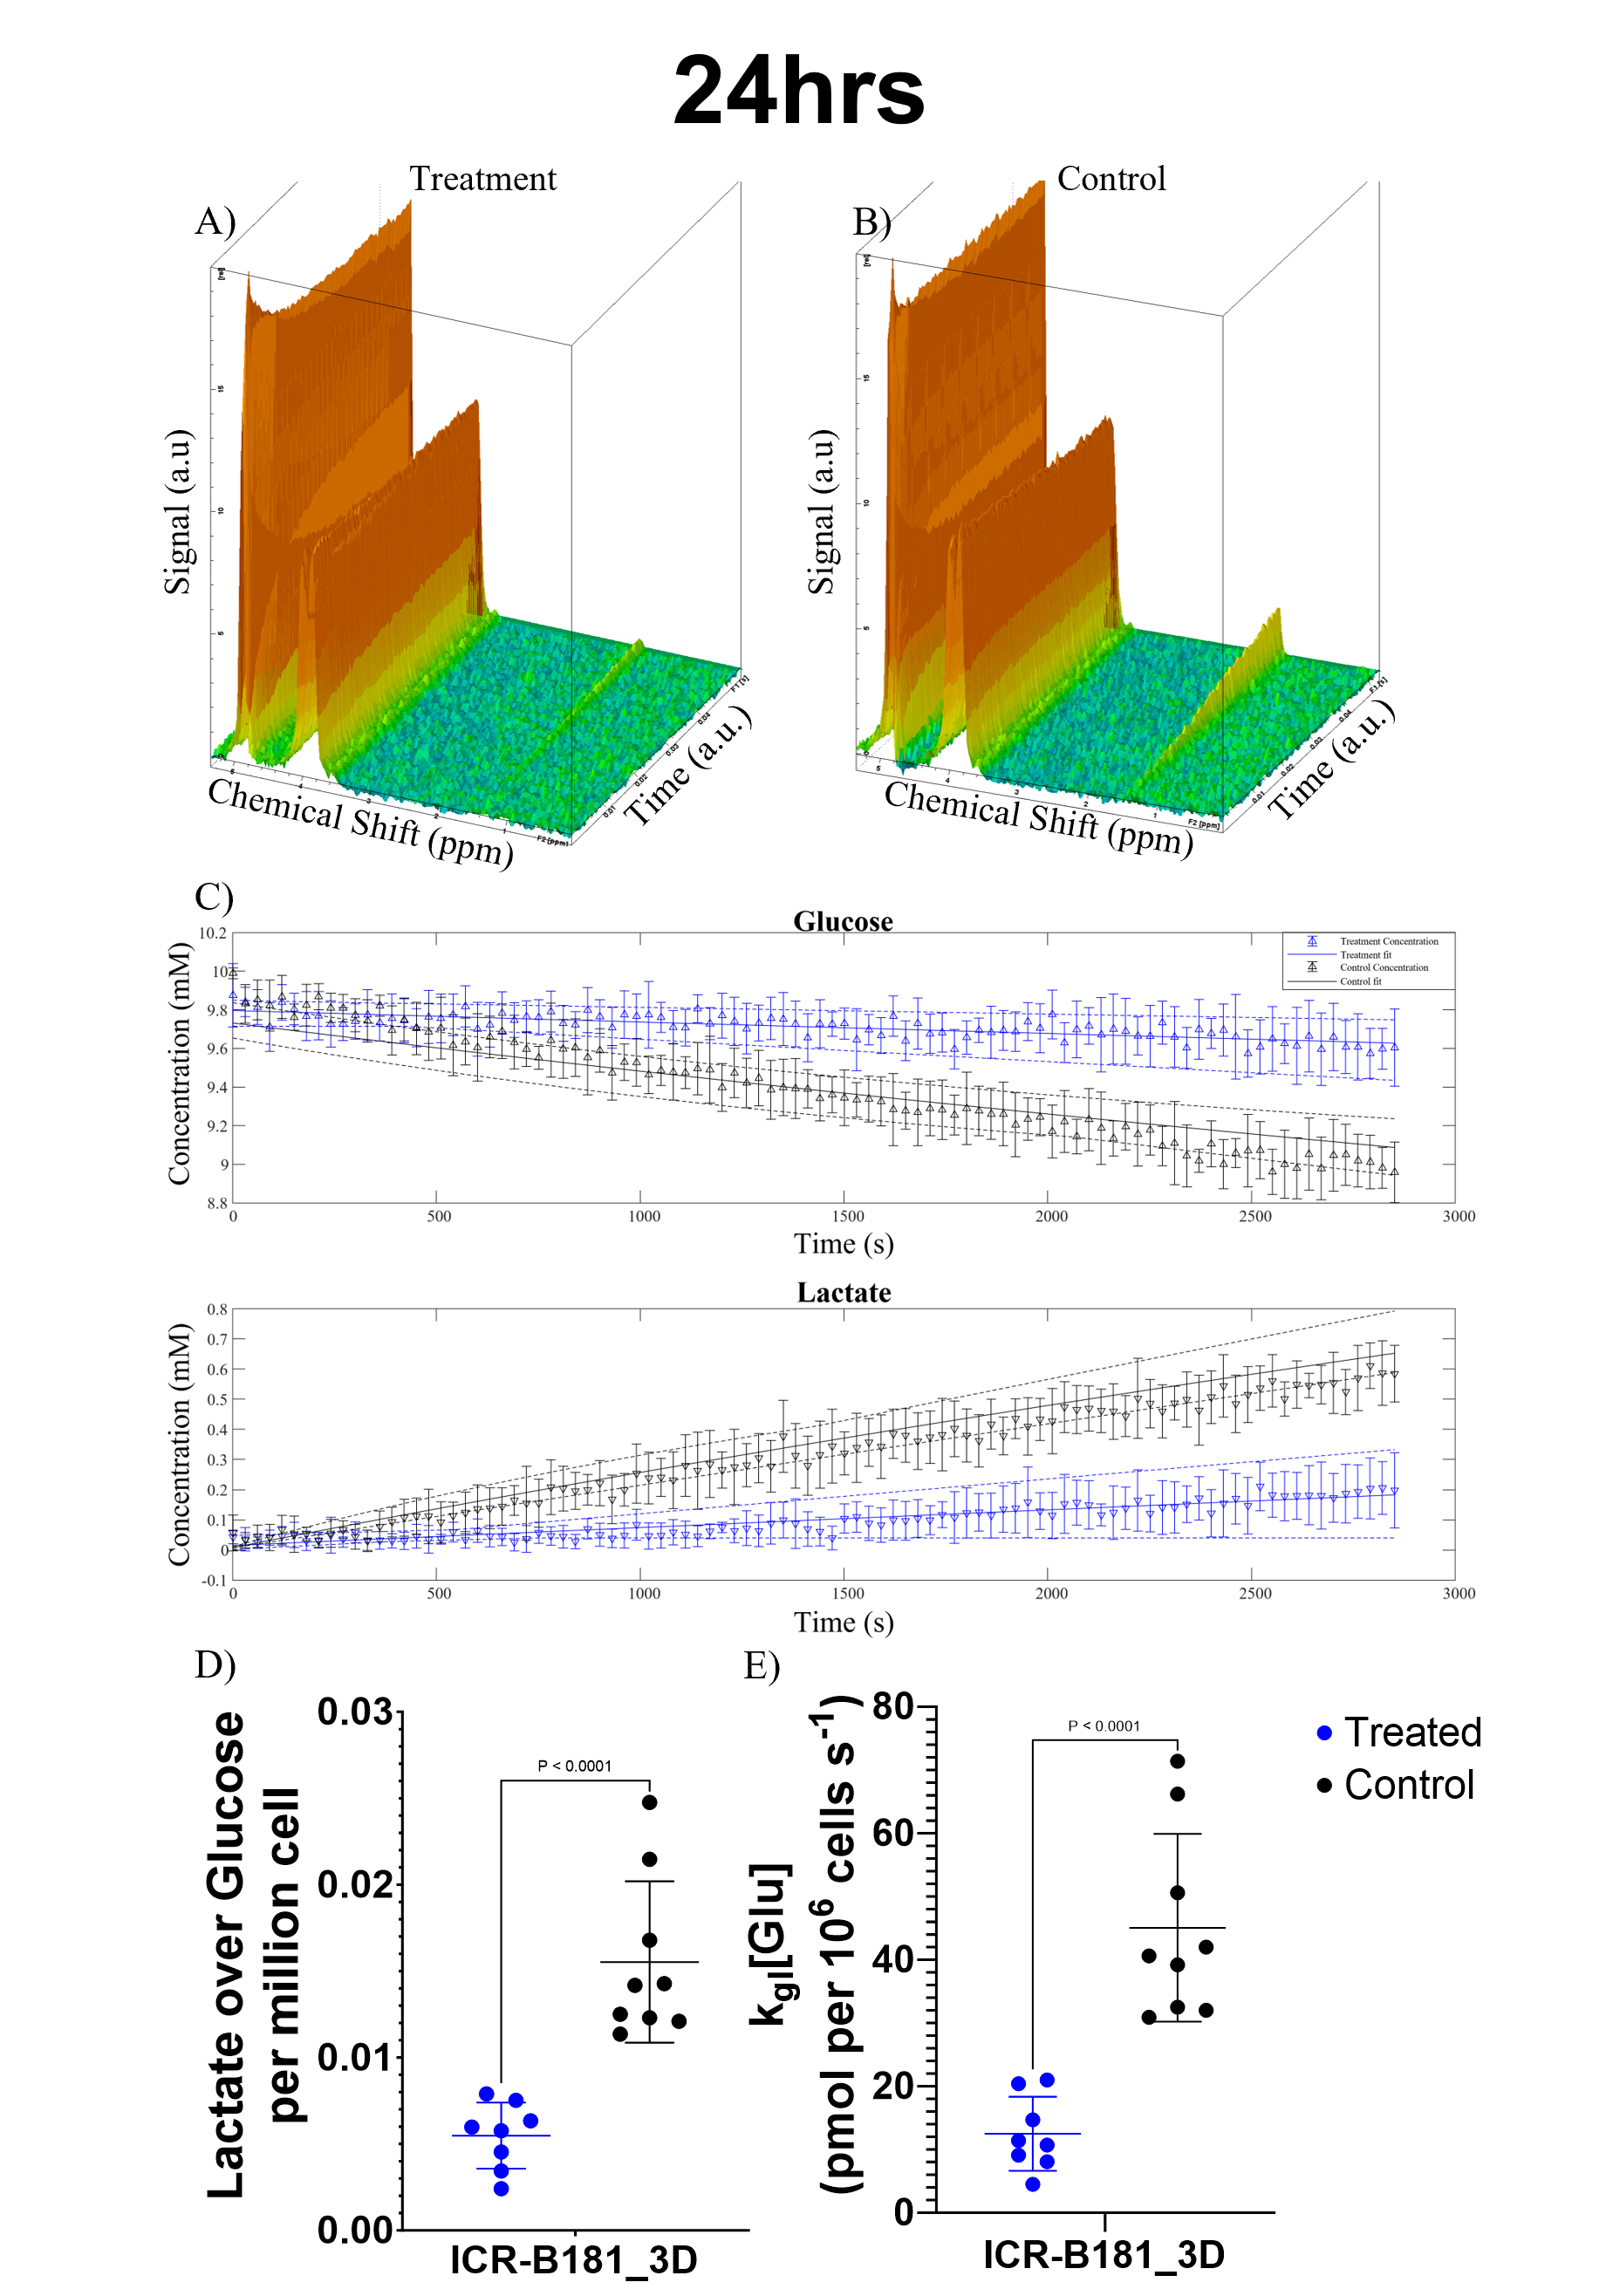
Figure 2: 2H NMR results from ICR-B181_3D cells treated with paxalisib or vehicle for 24 hours. Representative spectra from dynamic 2H NMR of A) treated and B) control cells. C) Summation of glucose and lactate concentrations from n=8 repeats expressed as mean ± standard deviation. Also shown is the mean fit (solid line) and minimum and max fit (dotted lines). D) Lactate over glucose ratio, normalised to cell number. E) kgl[Glu] expressed in pmol per 106 cells s-1. Treated cells are depicted in blue and controls in black throughout, p values calculated with a Mann-Whitney test.