3055
Evaluation of Anatomical Guided Reconstruction for Improving the Spatial Resolution of Deuterium Metabolic Imaging1Department of Radiology, Stanford University, Stanford, CA, United States, 2Department of Electrical Engineering, Stanford University, Stanford, CA, United States, 3Department of Imaging and Pathology, KU Leuven, Leuven, Belgium
Synopsis
Keywords: Deuterium, Deuterium
Motivation: The inherently low SNR of DMI hinders clinical viability at 3T.
Goal(s): We evaluate an anatomically guided reconstruction (AGR) approach to enhance the spatial resolution of DMI scans via exploiting correlated anatomic information in corresponding 1H images.
Approach: We used segmented MRI scans of patients with CNS tumors to simulate DMI metabolic maps and corresponding ground truth, which were then used to evaluate AGR performance with respect to both SNR and the targeted spatial resolution.
Results: Findings demonstrated that this AGR approach is largely robust to noise and most successful at upsampling factors between 2-4, after which the reconstructions starts to fail.
Impact: DMI can uncover novel metabolic information about CNS lesions. We demonstrate that mutual anatomic information from 1H MRI can bring 3T DMI closer to clinically-viable spatial resolutions. Further work is needed to assess its utility across lesion sizes and pathologies.
Introduction
The Warburg effect, in which lactate production via glycolysis is favored over oxidative phosphorylation,1 is a critical element of tumor growth2 and serves as the target of several novel therapies to treat cancer, particularly in the brain.3,4,5 Deuterium Metabolic Imaging (DMI) is an emerging method to image the Warburg effect through the oral consumption of [6,6'-2H2]Glc.6 but is limited by low signal-to-noise ratio (SNR) and poor spatial resolution. Anatomical-guided reconstruction (AGR) is a method that uses a higher resolution structural prior to aid in the reconstruction of lower resolution data.8,9 Previous research utilizing AGR has shown promising results for improving the spatial resolution of PET8 and multinuclear (13C and 23Na) MRI scans,9,15 improving input spatial resolutions of 4-6 mm up to 2 mm. However the current ~2.4 cm isotropic resolution of 3T DMI scans7 motivates the investigation of AGR for enhancing these lower spatial resolution images. In this work we assess the performance AGR on both simulated and in vivo DMI data as a function of input and target resolution and SNR.Methods
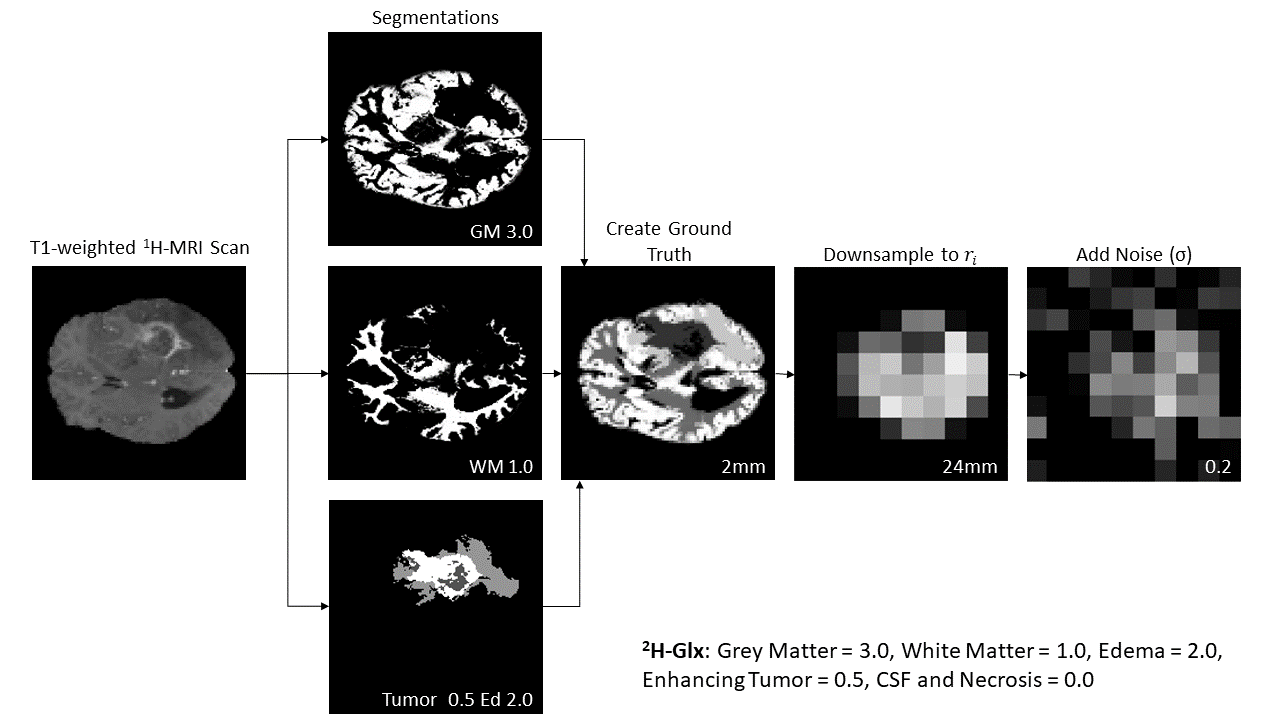
We sought to evaluate AGR’s potential for improving DMI spatial resolution through both in silico and in vivo experiments. Our DMI simulation pipeline is described in Figure 1. We used scans from the BraTS’20 dataset,11,12,13 a multi-parametric MRI dataset with CNS lesions segmented into enhancing tumor, edema and necrotic regions across a variety of pathologies. We first resampled the scans and lesion segmentations to 2 mm isotropic resolution, and then segmented areas of white matter (WM), grey matter (GM) and CSF using SPM12.14 Ground truth 2H-Lac and 2H-Glx DMI metabolite values were then assigned to each tissue type (Figure 1). The GM/WM ratio was determined from known glucose uptake ratios from FDG- PET literature,16 while enhancing tumor values were chosen based on typical values observed in DMI scans.7 Ground truth metabolic maps were then downsampled to 1) simulated 3T DMI scans with 24 mm isotropic spatial resolution, and 2) simulated 7T DMI scans with 12 mm isotropic spatial resolution. Finally, Gaussian noise was added to the low-resolution data to match SNR levels of an in vivo 40-minute DMI scan.7Input simulated DMI scans (resolution $$$r_i$$$) and anatomical 1H MRI were then used to reconstruct a higher-resolution DMI scan ($$$r_t$$$) with upsampling factor $$$f = r_t/r_i$$$ using an AGR algorithm. We approximated the solution to the following inverse problem using the structure-guided regularization algorithm from Ehrhardt et al.10
$$ \min_x \lVert Ax - d\rVert_2^2 + \lambda\lvert D(∇x)\rvert$$$$ D(x) = I − ξ(x)ξ^\top(x)$$$$ ξ(x) = \frac{∇v(x)} {\sqrt{η2 + |∇v(x)|^2}}$$ Where $$$∇x \in ℝ^{M\times N\times K\times 3}$$$ is the finite-difference approximation of the gradient of $$$x$$$, $$$v$$$ is the structural prior, and $$$\lambda$$$ and $$$\eta$$$ are tunable hyperparameters. All reconstructions were run with $$$\lambda = 6e{-3}$$$ and $$$\eta = 1e{-3}$$$, chosen empirically based on in silico experiments.
Results and Discussion
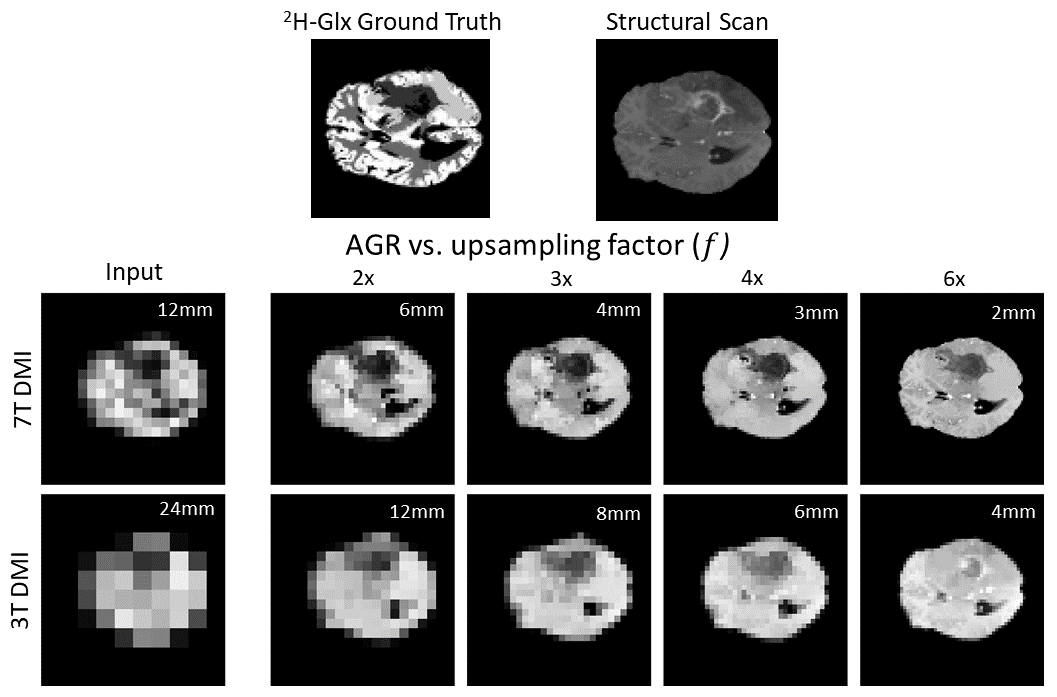
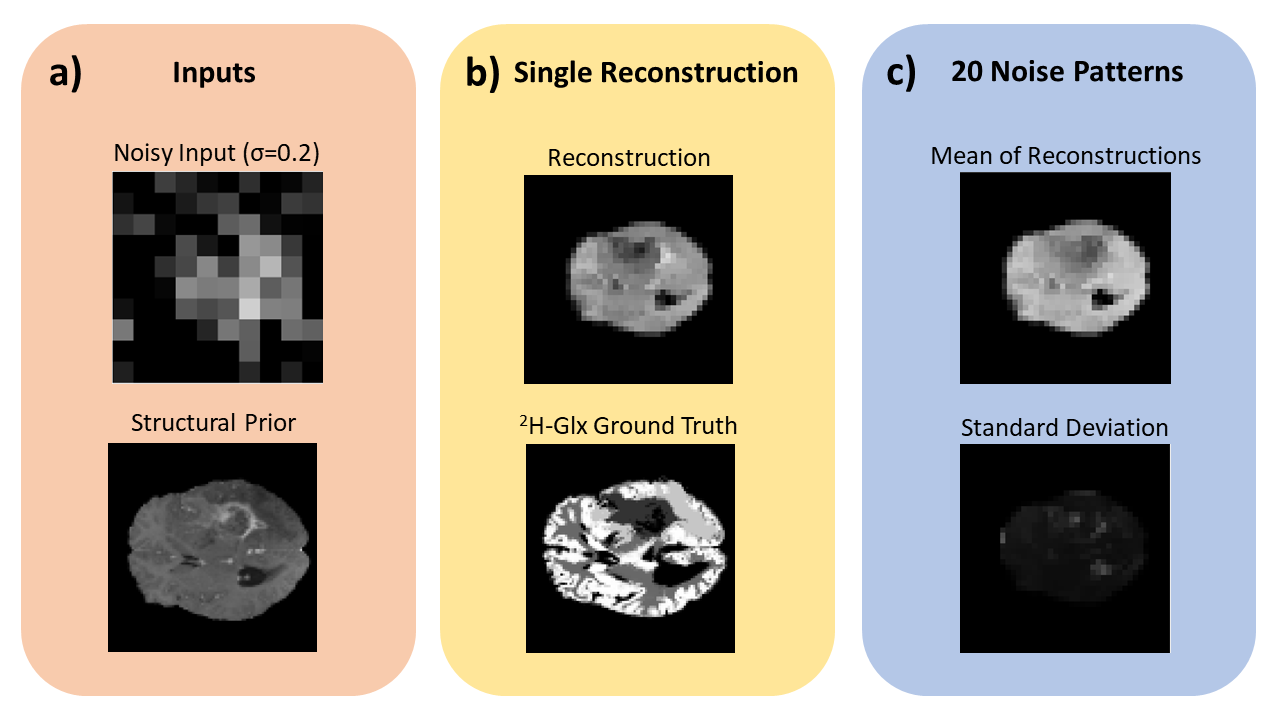
The impact of $$$r_i$$$ and $$$r_t$$$ on qualitative AGR reconstruction performance can be seen in Figure 2. As the upsampling factor $$$f$$$ increases, the reconstruction relies more heavily on the structural prior, with less fidelity to the input DMI data. With $$$r_i$$$ = 24 mm (3T DMI), the reconstruction quality is robust up to a $$$r_t$$$ = 6 mm resolution ($$$f=4$$$), but loses fidelity to the data at higher upsampling values. For a simulated 7T DMI scan ($$$r_i$$$ = 12 mm), however, AGR is reliably able to reconstruct all the way up to $$$r_t$$$ = 2mm. While the contrast between areas of tumor and normal brain tissue was sufficient for all the reconstructions, even at 7T, the AGR approach was unable to robustly separate GM and WM.AGR additionally seems to be robust to the level of noise expected from a standard 40-minute scan, evidenced by the mean reconstruction closeness to the noise-free reconstruction, and the low variance across reconstructions using 20 different noise patterns (Figure 3).
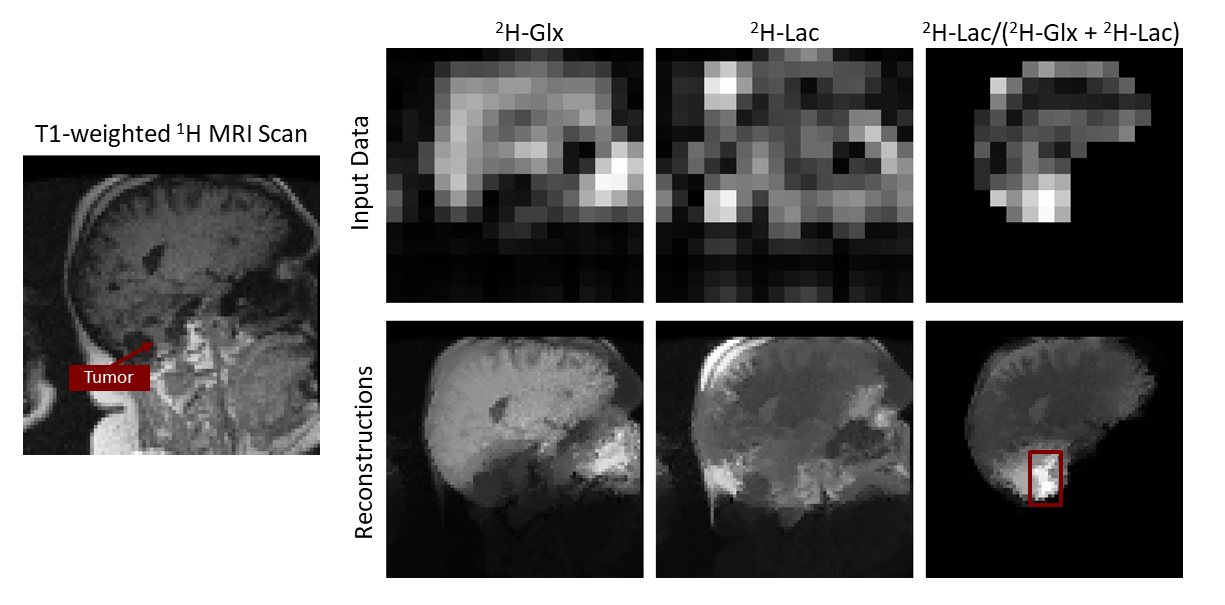
Finally, we tested AGR on an in vivo 3T DMI scan of a patient with an elevated 2H-Lac/(2H-Glx+2H-Lac) ratio,7 with the results shown in Figure 4. The AGR reconstruction assigns these elevated values to the region of enhancing tumor in the ratio image, consistent with the hypothesis that this enhancement reflects the Warburg effect.
Conclusion
We demonstrate the potential of AGR to improve the spatial resolution of simulated DMI scans between 2 and 4-fold, an important step towards the clinical translation of DMI. While preliminary in vivo data also looks promising, future work should investigate the robustness of AGR across a range of tumor sizes and pathologies, both in silico and in vivo.Acknowledgements
This work is supported by the National Cancer Institute grant R01CA277832 as well as the Radiological Sciences Laboratory Research Experiences for Undergraduates Program.References
1. Vander Heiden MG, Cantley LC, Thompson CB. Understanding the Warburg effect: The metabolic requirements of cell proliferation. Science. 2009; 324: 1029-1033.
2. Mathupala SP, Ko YH, Pedersen PL. Hexokinase-2 bound to mitochondria: cancer's stygian link to the “Warburg effect” and a pivotal target for effective therapy. Semin Cancer Biol. 2009; 19: 17-24.
3. Cho A, Lau JYC, Geraghty BJ, Cunningham CH, Keshari KR. Noninvasive interrogation of cancer metabolism with hyperpolarized 13C MRI. J Nucl Med. 2017; 58: 1201-1206.
4. Smeitink JA, Zeviani M, Turnbull DM, Jacobs HT. Mitochondrial medicine: a metabolic perspective on the pathology of oxidative phosphorylation disorders. Cell Metab. 2006; 3: 9-13.
5. Mukherjee P, Abate LE, Seyfried TN. Antiangiogenic and proapoptotic effects of dietary restriction on experimental mouse and human brain tumors. Clin Cancer Res. 2004; 10: 5622-5629.
6. de Feyter HM, Behar KL, Corbin ZA, et al. Deuterium metabolic imaging (DMI) for MRI-based 3D mapping of metabolism in vivo. Sci Adv. 2018; 4:eaat7314.
7. Adamson, PM, Datta, K, Watkins, R, Recht, LD, Hurd, RE, Spielman, DM. Deuterium metabolic imaging for 3D mapping of glucose metabolism in humans with central nervous system lesions at 3T. Magn Reson Med. 2023; 1-12. doi: 10.1002/mrm.29830
8. G. Schramm et al., "Evaluation of Parallel Level Sets and Bowsher’s Method as Segmentation-Free Anatomical Priors for Time-of-Flight PET Reconstruction," in IEEE Transactions on Medical Imaging, vol. 37, no. 2, pp. 590-603, Feb. 2018, doi: 10.1109/TMI.2017.2767940.
9. Ehrhardt et al., “Enhancing the spatial resolution of hyperpolarized carbon-13 MRI of human brain metabolism using structure guidance,” in Magnetic Resonance in Medicine, vol. 87, no. 3, pp. 1301-1312, Oct. 2023, doi: 10.1002/mrm.29045
10. Ehrhardt MJ, Betcke MM. Multi-contrast MRI reconstruction with structure-guided total variation. SIAM J Imaging Sci. 2016; 9: 1084-1106.
11. B. H. Menze, A. Jakab, S. Bauer, J. Kalpathy-Cramer, K. Farahani, J. Kirby, et al. "The Multimodal Brain Tumor Image Segmentation Benchmark (BRATS)", IEEE Transactions on Medical Imaging 34(10), 1993-2024 (2015) DOI: 10.1109/TMI.2014.2377694
12. S. Bakas, H. Akbari, A. Sotiras, M. Bilello, M. Rozycki, J.S. Kirby, et al., "Advancing The Cancer Genome Atlas glioma MRI collections with expert segmentation labels and radiomic features", Nature Scientific Data, 4:170117 (2017) DOI: 10.1038/sdata.2017.117
13. S. Bakas, M. Reyes, A. Jakab, S. Bauer, M. Rempfler, A. Crimi, et al., "Identifying the Best Machine Learning Algorithms for Brain Tumor Segmentation, Progression Assessment, and Overall Survival Prediction in the BRATS Challenge", arXiv preprint arXiv:1811.02629 (2018)
14. FIL Methods Group, “SPM12 Manual”, 2014
15. G. Schramm et al., “Resolution enhancement, noise suppression, and joint T2* decay estimation in dual-echo sodium-23 MR imaging using anatomically-guided reconstruction”, in Magnetic Resonance in Medicine.
16. Berti, Valentina et al. “Brain: normal variations and benign findings in fluorodeoxyglucose-PET/computed tomography imaging.” PET clinics vol. 9,2 (2014): 129-40. doi:10.1016/j.cpet.2013.10.006
Figures