3053
Detecting glucose metabolism abnormality in Six-Month-Old AD mice using deuterium magnetic resonance imaging1Paul C. Lauterbur Research Center for Biomedical Imaging, Shenzhen Institute of Advanced Technology, Chinese Academy of Sciences, Shenzhen, China, 2College of Engineering, Southern University of Science and Technology, Shenzhen, China
Synopsis
Keywords: Deuterium, Deuterium, Alzheimer's Disase
Motivation: Impaired brain energy metabolism at early stage is found to be the driving factor of Alzheimer’s Disease (AD) progression.
Goal(s): The study aim to investigate the potential of using deuterium magnetic resonance imaging to characterize the glucose metabolism in AD mouse model.
Approach: Deuterium magnetic resonance spectroscopic imaging with the administration of [2,3,4,6,6’-2H5]-D-Glucose in 5xFAD and C57 mice.
Results: Our preliminary results indicate higher glutamine/glutamate (Glx) production rate in 5xFAD mice compared to normal mice, especially in the hypothalamus region.
Impact: Our work may shed light on developing new method in the early detection of AD based on the glucose metabolism abnormality.
Introduction
Alzheimer's disease (AD) is a neurodegenerative disease with a high fatality and disability rate. Early diagnosis is the most effective way to manage the development of the disease, yet still a great challenge [1]. Recent studies unveil that brain energy metabolism impairment occurs many years before the onset of clinical symptoms, and plays important role in the disease progression [2]. In this study, we explore the potential of using deuterium metabolic imaging to reveal the glucose metabolism characteristics of AD through animal model [3].Methods
Animal study was conducted under the approval of IRB. Murine AD model 5xFAD (n = 3, male, six-month old) was used and compared to normal mouse of C57 (n = 3, male, six-month old). T2 weighted high resolution anatomical images were acquired at a 9.4T animal system (uMR 9.4T, United Imaging Life Science Instruments, Wuhan, China) with a dedicated mouse brain coil with parameters: TR/TE=3000ms/35.56ms, Matrix =370*370, FOV= 17mm*17mm, slice thickness = 0.2mm. Deuterium MR imaging was conducted using a Bruker 11.7T MR system with a home-built 2H/1H coil [4]. During the imaging acquisition, all mice were anesthetized with isoflurane. The dosage was dynamically adjusted in the range of 0.5-1.8% to maintain the breath rate within 30-40 per minute throughout the whole experiment. All mice were injected with [2,3,4,6,6’-2H5]-D-Glucose (Dingbang Biotechnology Co., Shenzhen , China) dissolved in saline in the dosage of 3g/kg through tail vein. T2 weighted anatomical images were also acquired at 11.7T but with decreased image quality due to the compromised performance of the coil for 1H imaging. Chemical-shift imaging (CSI) sequence was used for the detection of deuterium labeled substrates in brain. The imaging parameters were: TR = 150 ms, matrix = 8*8*8, FOV = 16mm*16mm*16mm, bandwidth = 2kHz, acquisition points = 256, average = 150, resulting in acquisition time = 16.5 minutes. The imaging sequence were repeated for seven times, once before glucose infusion for baseline, and six times after infusion. The spectroscopic data of the whole brain were exported and processed by home-written code in MATLAB with Inverse Fourier Transform, line broadening and phase correction. The spectrum was then fitted to a mixed Lorentzian model with least-square fitting algorithm [5].Signal intensities were all normalized to those of HDO acquired before glucose infusion. The anatomical localization of the 2H spectroscopic data was determined by registering the 1H images acquired at 11.7T to those at 9.4T.Results
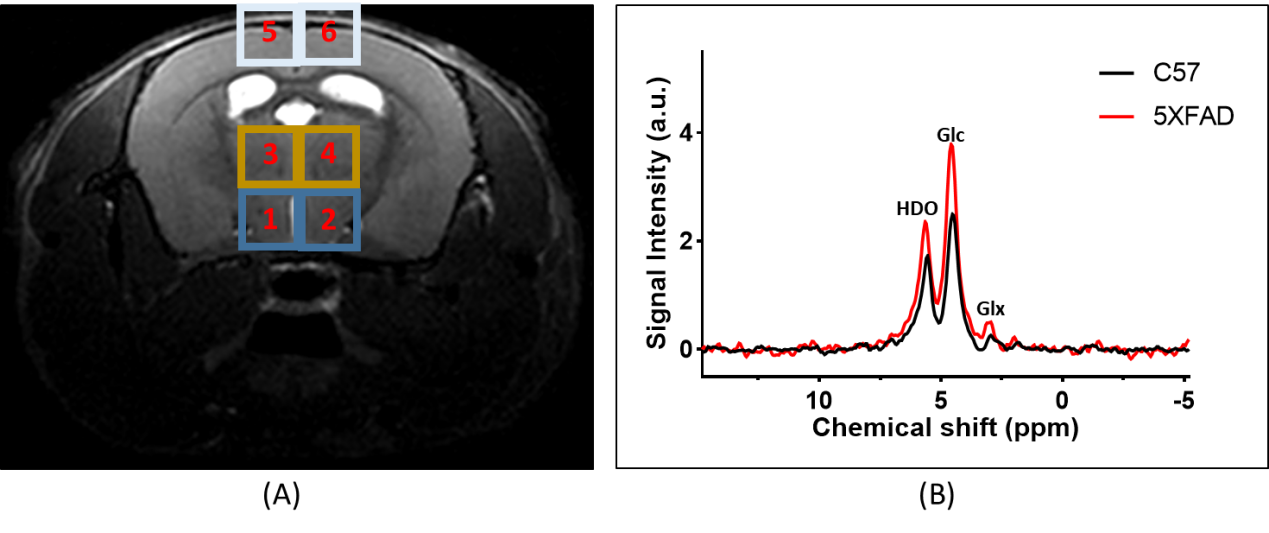
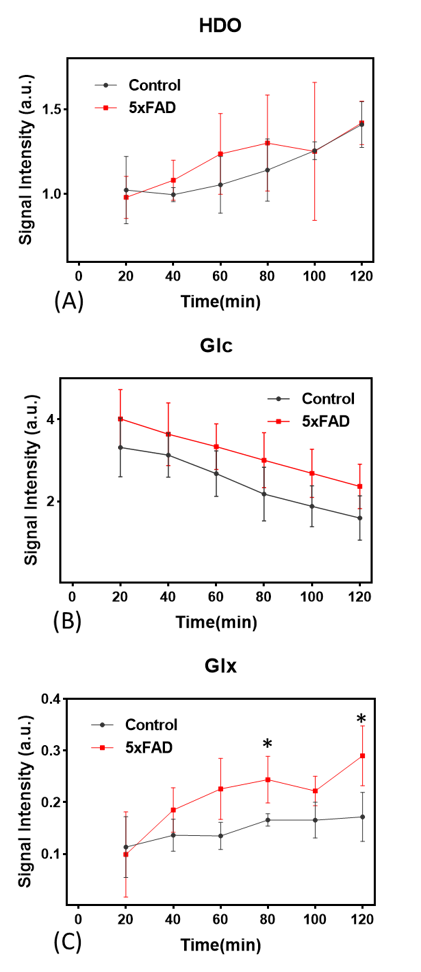
Fig. 1 shows typical deuterium spectra of 5xFAD and C57 mice in the hypothalamic region found in high resolution 1H image at 80 minutes post-infusion. Higher level of Glx can be observed in this region in 5xFAD mouse than C57 mouse.The signal intensities of HDO, glucose (Glc), and Glx are shown and compared in Fig.2. The signal intensities were averaged in all voxels of the slice containing the maximum volume of brain. A higher production of Glx was also observed in 5xFAD, especially after 80 minutes. The averaged Glc intensities were found to be higher in 5xFAD mice throughout the experiment, but the consumption rates were similar in these two groups.
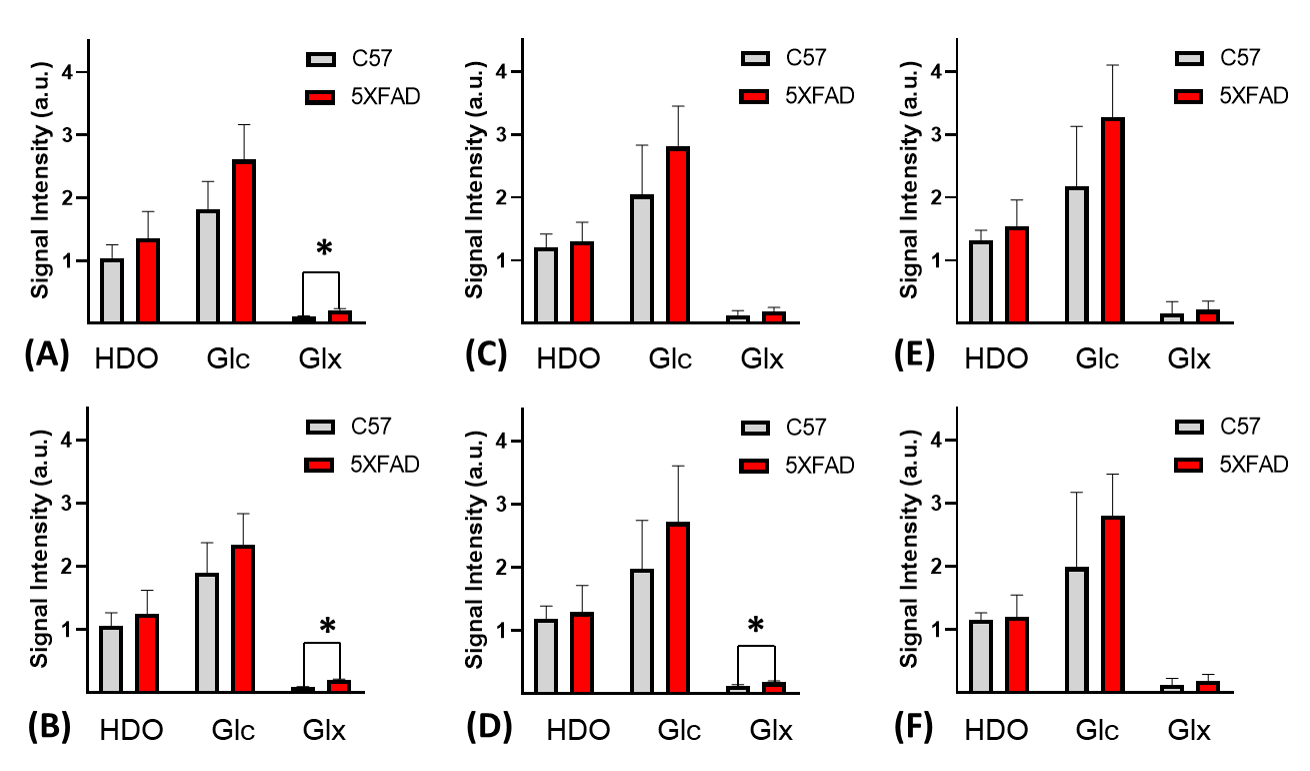
Fig.3 demonstrates a statistical plot of the signal intensities of water, glucose and Glx at 80 min in the six voxels annotated in Fig. 1A. The comparison shows that the Glx production levels are higher in 5xFAD mice, especially in both hypothalamic regions.
Discussion
Our main finding was similar to those reported in [6] where the Glx production rate in the whole brain level is higher in AD model. However, we observed this significant difference as early as six-month old rather than 14-month old in their study. Moreover, we find that the Glx production rate in hypothalamus region is consistently higher in the 5xFAD mice through 3D CSI. A similar finding was observed in another study where the hypothalamus region shows largest difference, compared to other brain regions, in energy metabolism related metabolites through NMR based metabolomics analysis in APP/PS1 mouse model [7]. Besides, no difference in glucose consumption was found in both groups. This observation might be different from 18F-FDG-PET study [8]. However, in another study using 13C labeled glucose in 7-month-old 3xTgAD mouse model, it was found that 13C labeled glucose had even higher flux than normal mice [9]. The inconsistent findings will be further investigated. Comparison will be comprehensively extended to PET and even behavior features of the animal model. Also, a larger population will be continued to complete this preliminary study.Acknowledgements
This work was supported in part by the Project on Global Common Challenges of Chinese Academy of Sciences (No. 321GJHZ2022081GC), the NSFC grant (81627901), the Key Laboratory for Magnetic Resonance and Multimodality Imaging of Guangdong Province (2023B1212060052), the Funding Program of Shenzhen, China (RCYX20200714114735123), the Chinese Academy of Sciences Youth Innovation Promotion Association funded project (Y2021098), the Funding Program of Shenzhen and Guangdong Province, China (2022B1515120068).References
[1] Anand R, Gill K D, Mahdi A A. Therapeutics of Alzheimer's disease: Past, present and future[J]. Neuropharmacology, 2014, 76: 27-50.
[2] Jagust W. Imaging the evolution and pathophysiology of Alzheimer disease [J]. Nature Reviews Neuroscience, 2018, 19(11): 687-700.
[3] De Feyter H M, Behar K L, Corbin Z A, et al. Deuterium metabolic imaging (DMI) for MRI-based 3D mapping of metabolism in vivo[J]. Science advances, 2018, 4(8): eaat7314.
[4] Du F, Yuan J, Li N, et al. Deuterium metabolism imaging of rat brain at 9.4 T using a double-nuclear transceiver[C]//Proc. Intl. Soc. Mag. Reson. Med. 2022, 3243.
[5] Zou C, Ruan Y, Li H, et al. A new deuterium‐labeled compound [2, 3, 4, 6, 6’‐2H5]‐D‐glucose for deuterium magnetic resonance metabolic imaging[J]. NMR in Biomedicine, 2023, 36(7): e4890.
[6] Gao X, Gordon J, Qiao K, et al. Exploring glucose metabolic impairment in Alzheimer’s Disease with DMI using [6,6’-2H2]-D-glucose and [2,2’-2H2]-deoxy-D-glucose at 14.1T[C]//Proc. Intl. Soc. Mag. Reson. Med. 2023, 0017.
[7] Zheng H, Zhou Q, Du Y, et al. The hypothalamus as the primary brain region of metabolic abnormalities in APP/PS1 transgenic mouse model of Alzheimer's disease[J]. Biochimica et Biophysica Acta (BBA)-Molecular Basis of Disease, 2018, 1864(1): 263-273.
[8] Bouter C, Henniges P, Franke T N, et al. 18F-FDG-PET detects drastic changes in brain metabolism in the Tg4–42 model of Alzheimer’s disease[J]. Frontiers in aging neuroscience, 2019, 10: 425.
[9] Sancheti H, Patil I, Kanamori K, et al. Hypermetabolic state in the 7-month-old triple transgenic mouse model of Alzheimer's disease and the effect of lipoic acid: a 13C-NMR study[J]. Journal of Cerebral Blood Flow & Metabolism, 2014, 34(11): 1749-1760.
Figures