3052
Towards cardiac DMI at clinical field strengths1Yale University, New Haven, CT, United States, 2Yale University School of Medicine, New Haven, CT, United States, 3Cardiovascular Medicine, Yale School of Medicine, New Haven, CT, United States
Synopsis
Keywords: Deuterium, Metabolism
Motivation: Deuterium metabolic imaging (DMI) might permit mapping of cardiac metabolism by MRI.
Goal(s): To port DMI tools developed at 11.7T for mice to 3T, and develop methods for cardiac DMI.
Approach: Simulations, phantoms, and in vivo studies were conducted to measure SNR at 3T, develop an optimized protocol, and account for B0 inhomogeneity.
Results: At 11.7T, cardiac DMI was tested in a control mouse. At 3T, phantom studies showed that multi-echo bSSFP methods yield increased SNR vs. GRE. B0-mapping helps in isolating the metabolites in phantoms.
Impact: Development of DMI tools for use in cardiac DMI at clinical field strengths.
Introduction
While there exist cardiac MR methods for evaluating myocardial perfusion and viability, edema and more, there are very few useful approaches for mapping of metabolic activity (31P, 13C and hyperpolarized 13C imaging). However, none of these have entered the clinic due to complexity requiring expert centers and resources (for 13C), and long-scan times (for 31P). However, preclinical studies indicate that cardiac metabolic mapping might be useful for early detection of disease. Deuterium metabolic imaging (DMI) (1) introduces a method for metabolic mapping, with tremendous potential for translation to clinical practice. This method uses deuterated substrates such as, [6,6’-2H2]-glucose, which is metabolized by glycolysis into deuterated water and [3,3-2H2]-lactate, if not entering the TCA cycle as pyruvate (2). A recent study of cardiac DMI at 16.4T observed metabolism of labeled glucose (3). Here, we propose to use DMI to map cardiac metabolism, with an innovative bSSFP approach (multi-echo bSSFP (4) (5) instead of conventional CSI spectroscopy) to increase SNR (based on the T1/T2 ratios of the deuterated compounds). We adapted a DMI method developed on 11.7T Bruker in mice towards imaging the human heart on a 3T clinical scanner.Methods
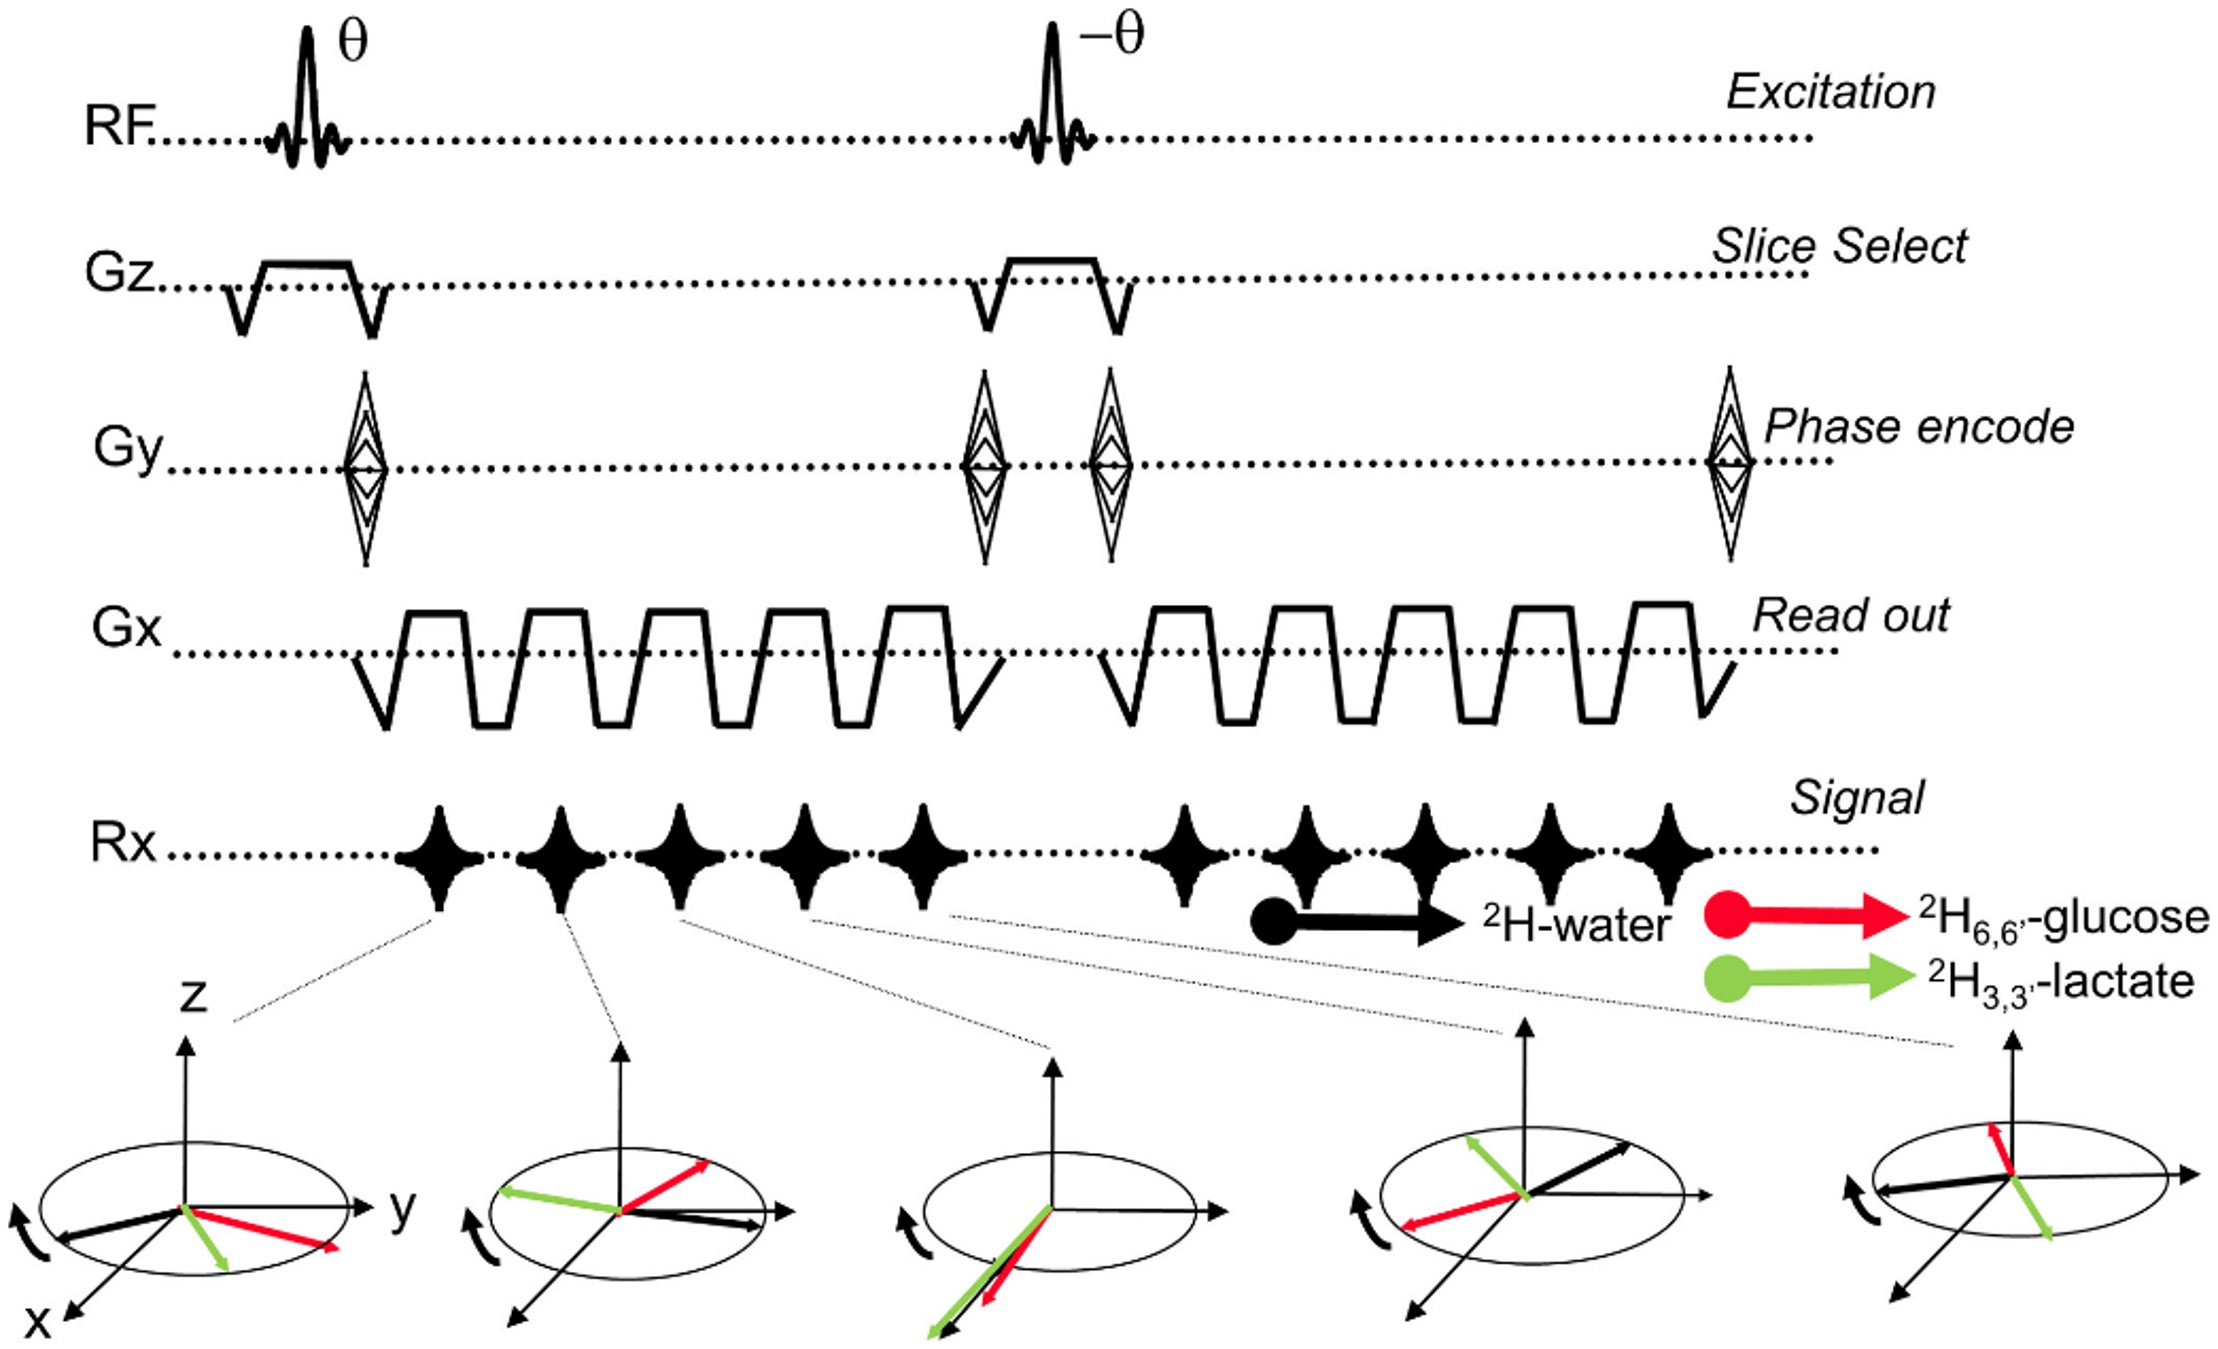
The pulse sequence uses highly averaged 2D multi-echo balanced SSFP developed at 11.7T and 3T (Siemens) (Figure 1), with 5TEs for distinguishing 3 species, deuterated water at 4.8ppm, glucose at 3.7ppm, and lactate at 1.3ppm. At 11.7 we used ΔTE=2ms, and TR=13 ms which is found to be near optimal. Reconstruction is performed using FFT, and IDEAL processing (6) based on an fat-water tool box.Mouse imaging: The mouse studies were approved by the Institutional Animal Care and Use Committee. A control mouse was imaged after IV injection of 1.5g/kg of [6,6’-2H2]-glucose (Cambridge isotope laboratories, Tewksbury, MA) over ~ 60 minutes, using the ME-bSSFP DMI sequence at 11.7T on a Bruker, with scan parameters: short-axis slice, TR/ ΔTE/θ=13/2ms/60° spatial resolution 1.5x1.5 x5mm, 10.5minute scan time, dual tuned 1H/2H surface coil.
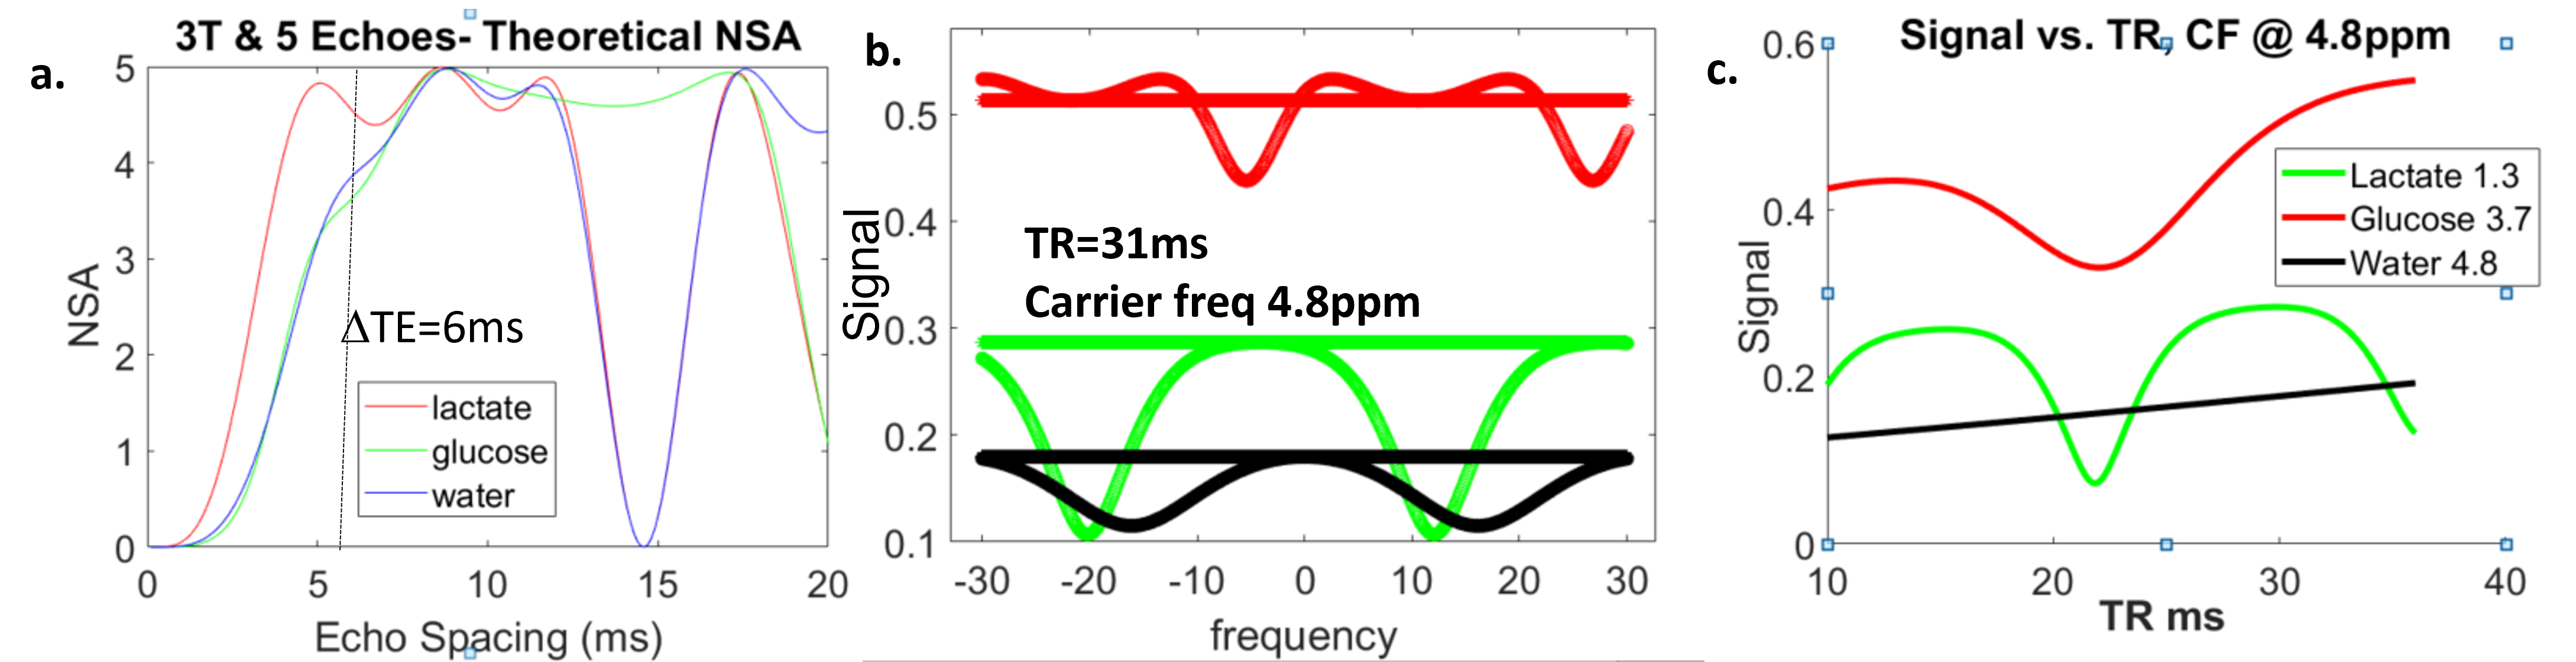
Simulations and phantom studies: Simulations analyzed the optimal TEs (7) which would provide greatest SNR after IDEAL decomposition. By simulating the bSSFP banding pattern vs. TR and frequency (8), reasonable center frequency for glucose-based DMI at 3T was found near 4.8ppm (water). Phantoms consisting of deuterated chemicals (0.2 to 0.5%) in 2% agar were constructed. A single loop 11 cm diameter deuterium tuned loop coil was used, with B1 calibration to identify optimal transmit voltage. For phantom studies, ME-bSSFP and ME-GRE acquisitions were performed, with TR/ ΔTE/θ=31/6ms/60° (15° for GRE) spatial 32x32 matrix, 5x5 x10mm, ~2 minutes scan time, using a single loop 2H coil, and 1H body coil.
Human studies: A healthy subject was imaged with 1H to obtain B0 maps (GRE, TEs of 3.1 and 5.8ms).
Results
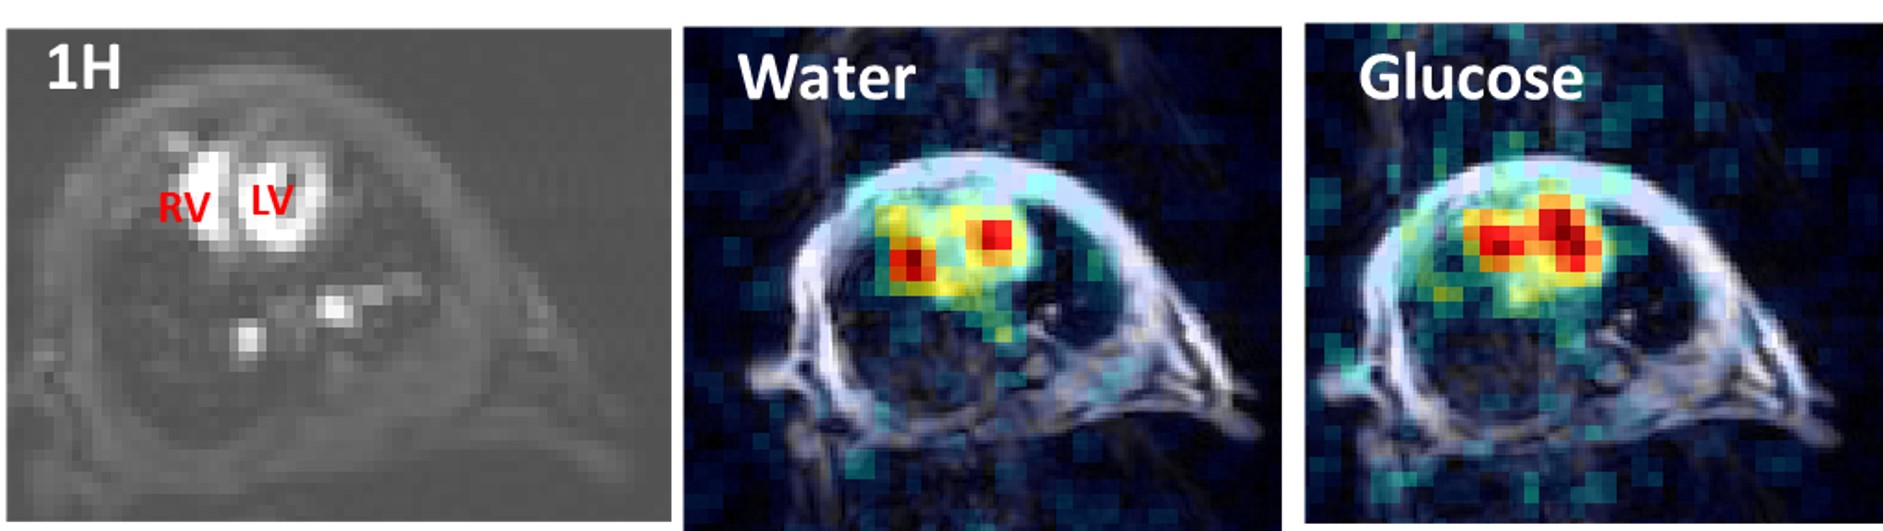
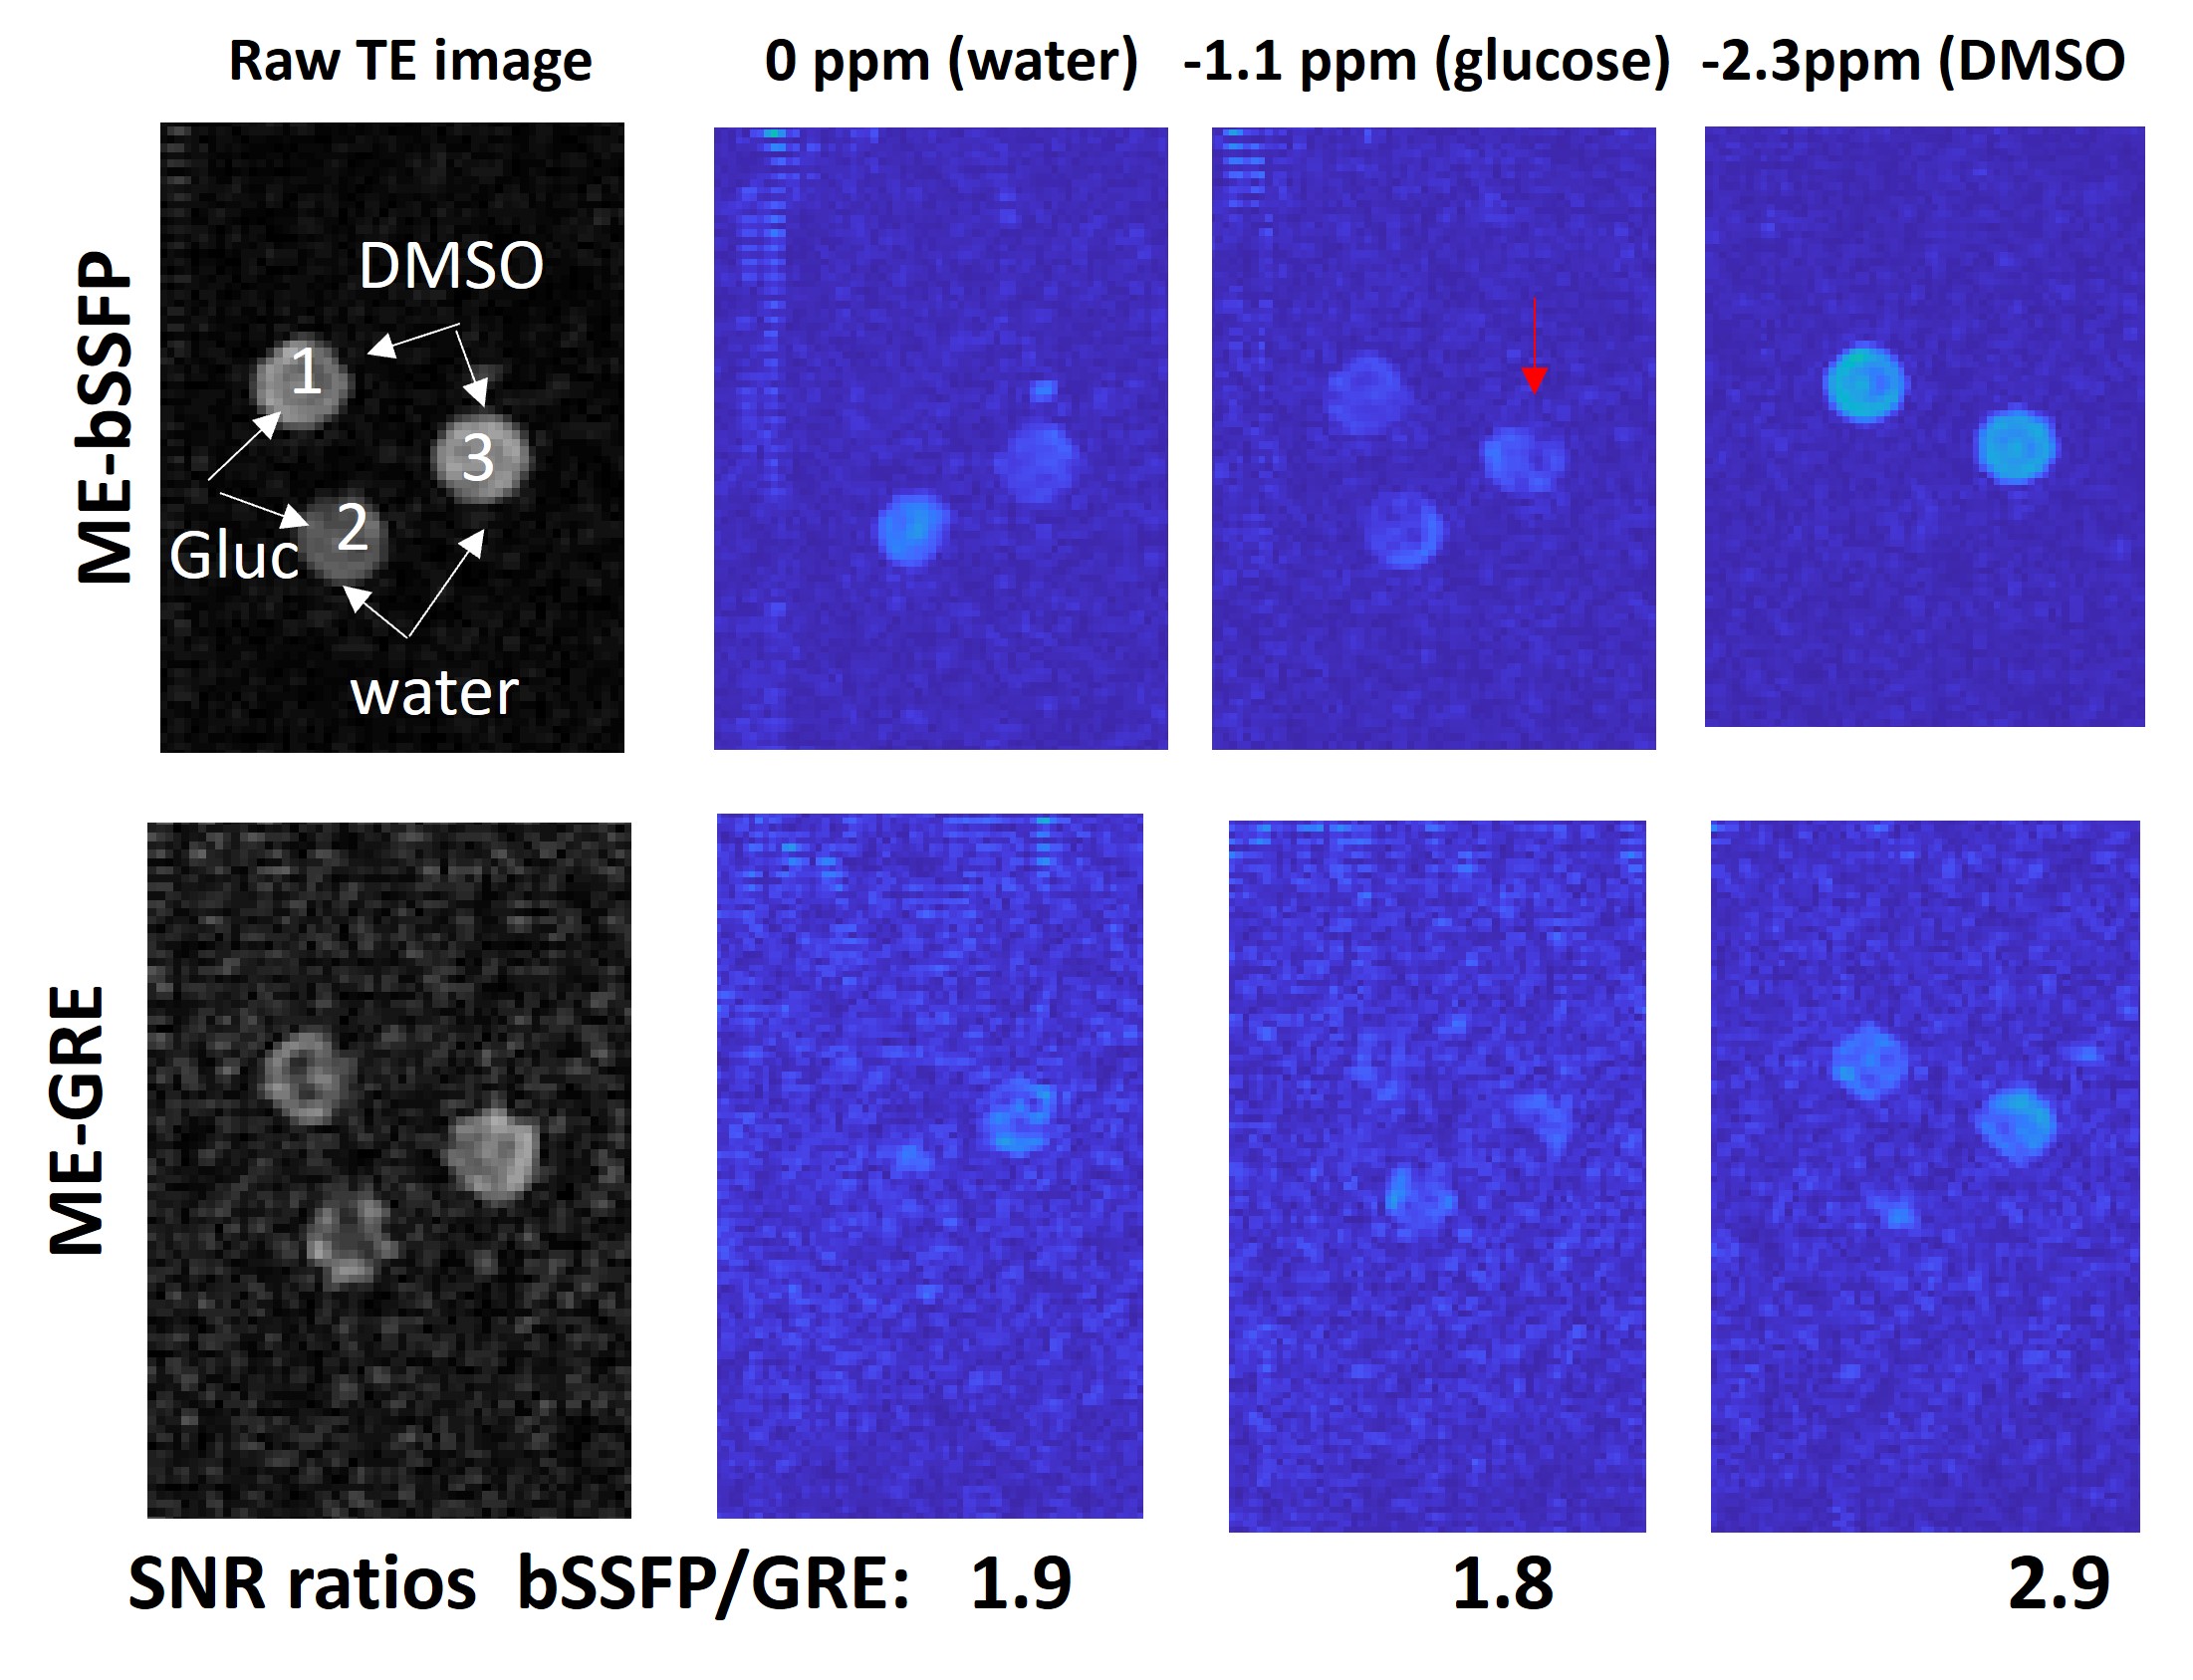
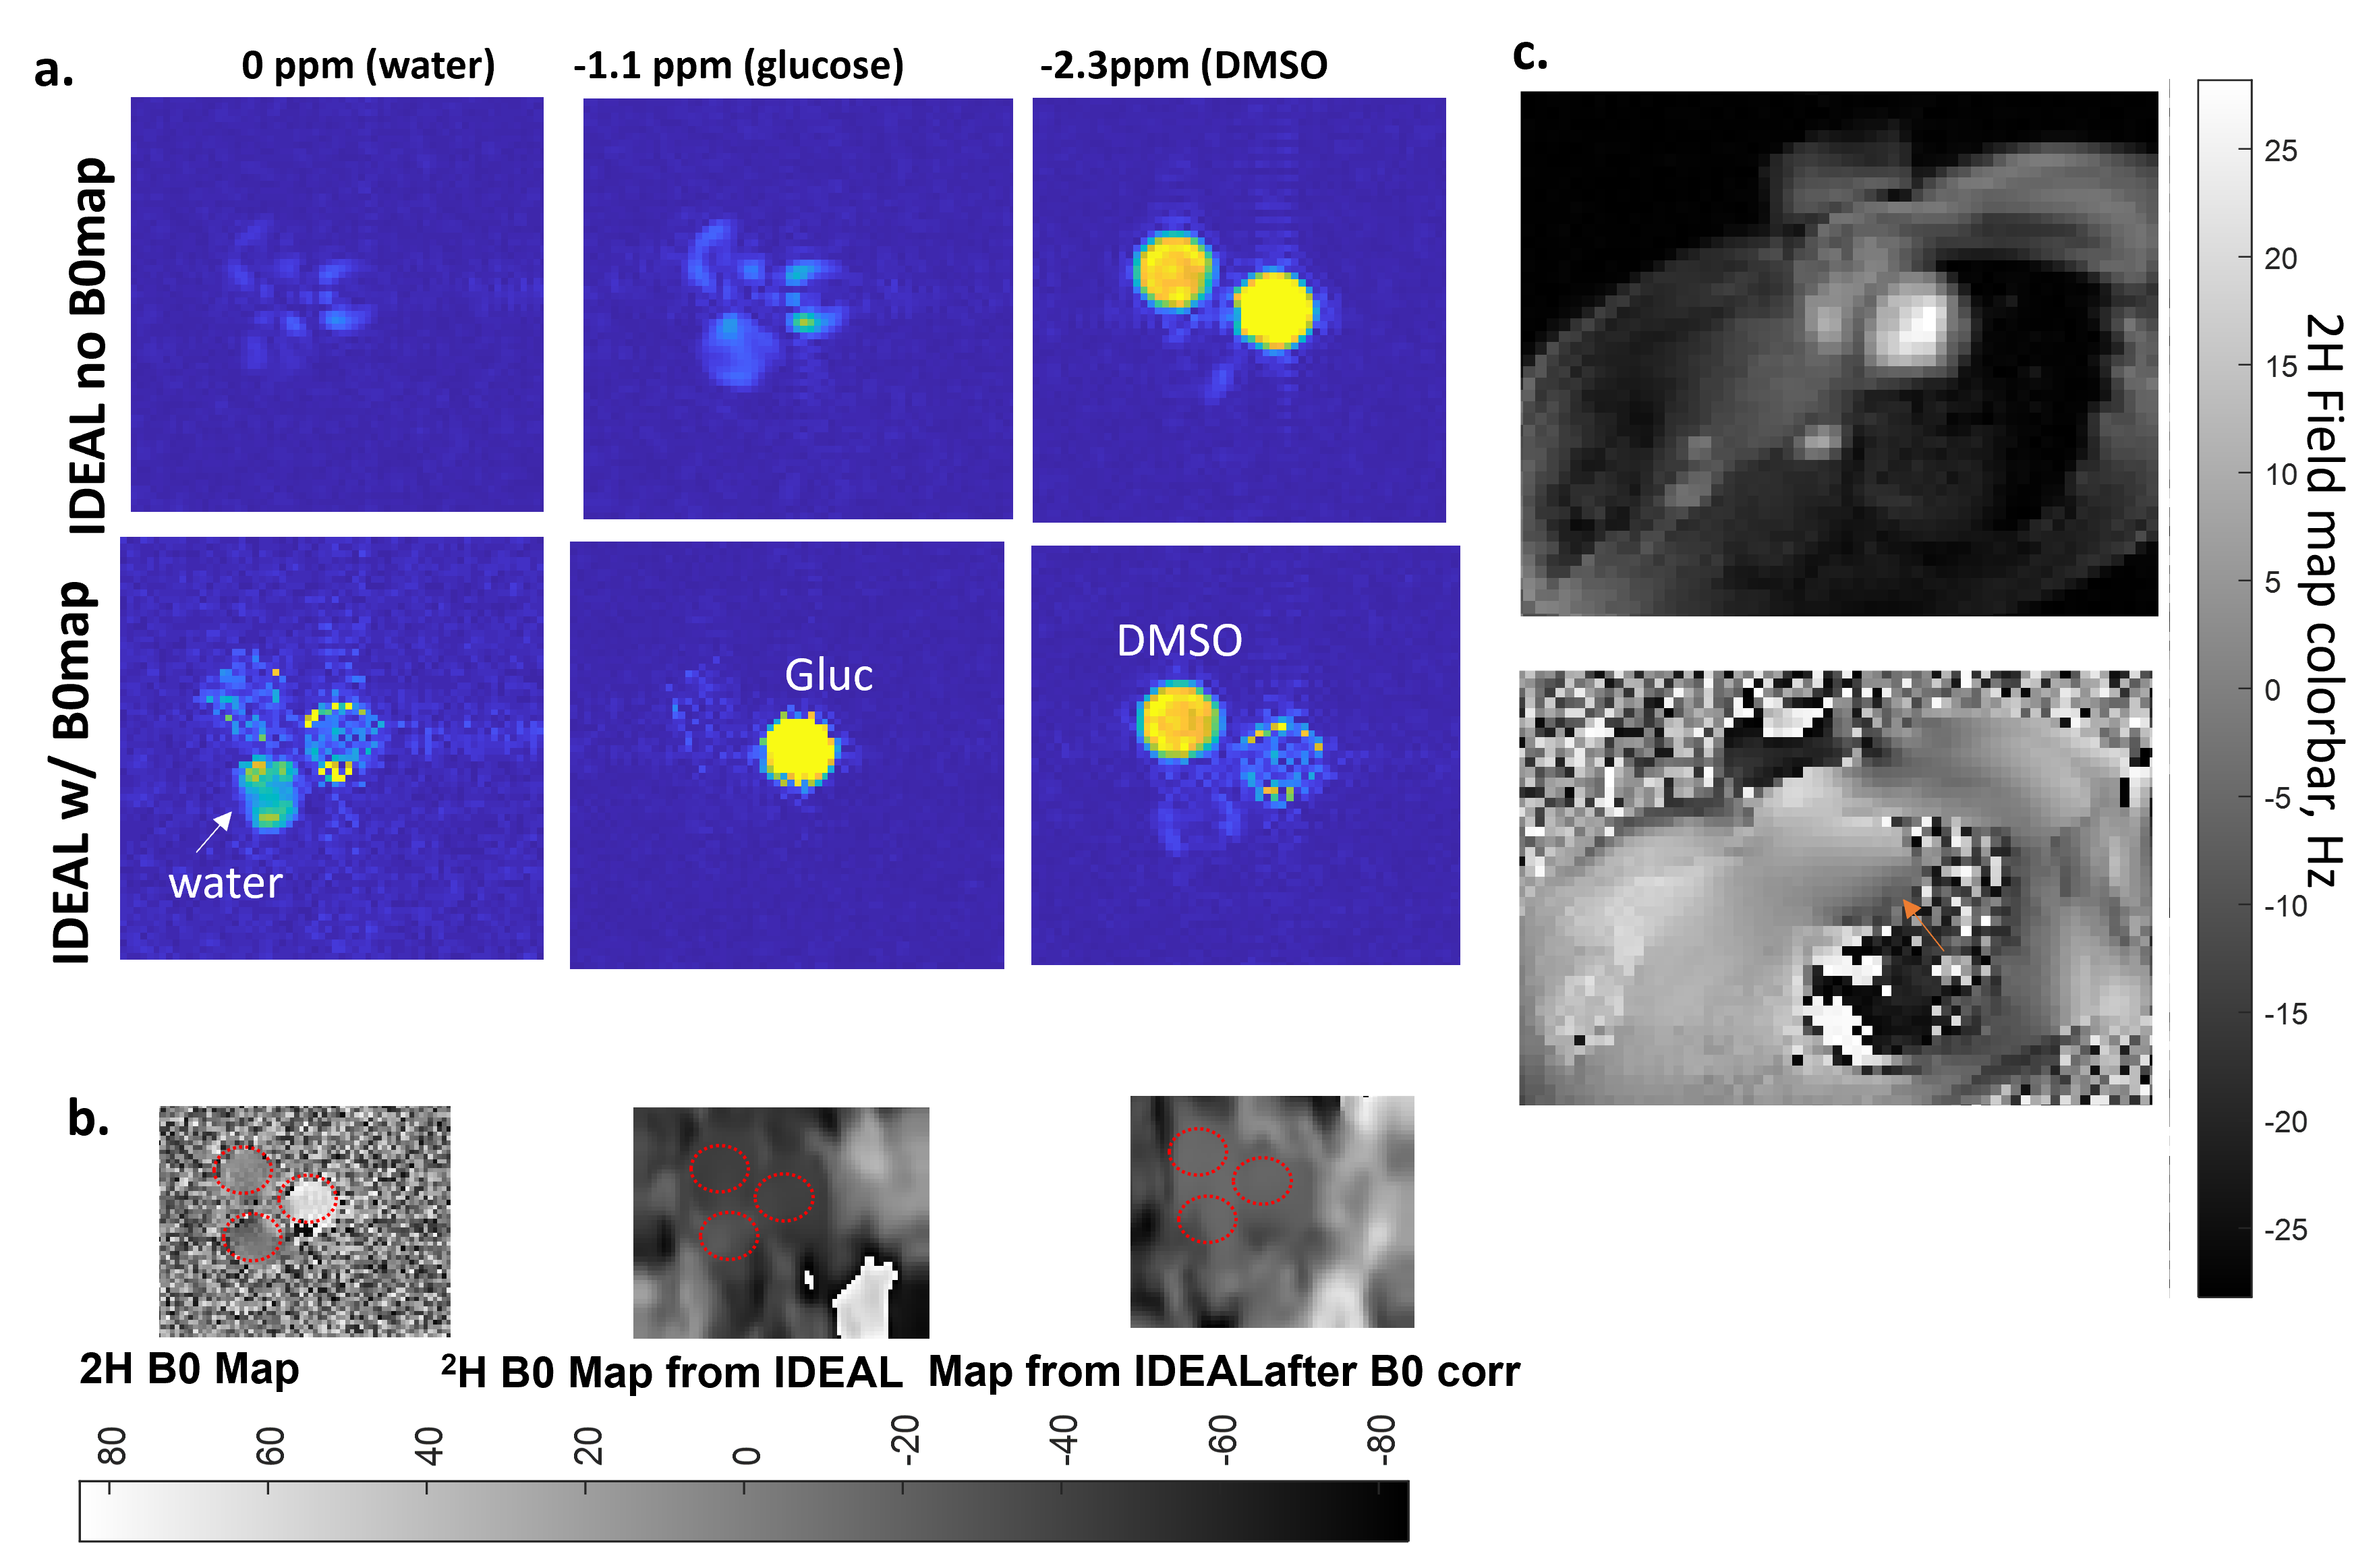
Mice: Figure 2 shows first results in mice at 11.7T. The water and glucose have high SNR, and the water appears mainly in the blood pool, while glucose may also be present in the myocardial walls.Simulations and Phantoms: Figure 3A shows simulations at 3T, suggesting that the optimal DTE is 9ms. However, 9ms may be too long (due to concerns of banding), and simulations also show that 6ms performs similarly for resolving glucose, water and lactate. Figure 3B and C show that a carrier frequency near water will be successful in avoiding bands (for a TR of 31ms). Figure 4 shows some results in phantom studies, where the three species were mapped using multi-echo bSSFP. When compared vs. multi-echo GRE, SNR was measured to be 2-3 fold higher. However, there is an apparent swap in the ideal reconstruction. Figure 5A-B shows that using B0 mapping in the reconstruction can improve IDEAL reconstruction. Figure 5C shows a B0 map measured at 3T for 1H for the human heart, which has been scaled down by γ(2H)/γ(1H) to represent the 2H field map.
Conclusion
Based on mouse studies of cardiac DMI, and simulations and phantom imaging at 3T, a feasible approach to cardiac DMI has been identified.Acknowledgements
We thank the American Heart Association and the Weizmann–Yale exchange program for funding for this project, and Professor Lucio Frydman for contributing to the development of these tools on Bruker scanners.References
1. De Feyter HM, Behar KL, Corbin ZA, Fulbright RK, Brown PB, McIntyre S, Nixon TW, Rothman DL, de Graaf RA. Deuterium metabolic imaging (DMI) for MRI-based 3D mapping of metabolism in vivo. Sci Adv 2018;4(8):eaat7314.
2. Melkonian E, Schury M. Biochemistry, Anaerobic Glycolysis. In: StatPearls [Internet] Treasure Island (FL): StatPearls Publishing; 2022 Jan-.
3. Wang T, Zhu XH, Li H, Zhang Y, Zhu W, Wiesner HM, Chen W. Noninvasive assessment of myocardial energy metabolism and dynamics using in vivo deuterium MRS imaging. Magnet Reson Med 2021.
4. Peters DC, Markovic S, Bao Q, Preise D, Sasson K, Agemy L, Scherz A, Frydman L. Improving deuterium metabolic imaging (DMI) signal-to-noise ratio by spectroscopic multi-echo bSSFP: A pancreatic cancer investigation. Magn Reson Med 2021;86(5):2604-2617.
5. Montrazi ET, Bao Q, Martinho RP, Peters DC, Harris T, Sasson K, Agemy L, Scherz A, Frydman L. Deuterium imaging of the Warburg effect at sub-millimolar concentrations by joint processing of the kinetic and spectral dimensions. NMR Biomed 2023;36(11):e4995.
6. Tsao J, Jiang Y. Hierarchical IDEAL: fast, robust, and multiresolution separation of multiple chemical species from multiple echo times. Magn Reson Med 2013;70(1):155-159.
7. Pineda AR, Reeder SB, Wen Z, Pelc NJ. Cramer-Rao bounds for three-point decomposition of water and fat. Magn Reson Med 2005;54(3):625-635.
8. Bieri O, Scheffler K. Fundamentals of balanced steady state free precession MRI. J Magn Reson Imaging 2013;38(1):2-11.
Figures