3050
Dynamic 2D fitting of 3D deuterium metabolic imaging data acquired in human brain at 7T1High Field MR Center, Department of Biomedical Imaging and Image-Guided Therapy, Medical University of Vienna, Vienna, Austria, 2Wellcome Centre for Integrative Neuroimaging, FMRIB, Nuffield Department of Clinical Neurosciences, University of Oxford, Oxford, United Kingdom, 3Christian Doppler Laboratory for MR Imaging Biomarkers (BIOMAK), Vienna, Austria, 4Department of Medicine III, Division of Endocrinology and Metabolism, Medical University of Vienna, Vienna, Austria, 5Institute for Clinical Molecular MRI, Karl Landsteiner Society, St. Pölten, Austria, 6Department of Psychiatry and Psychotherapy, Comprehensive Center for Clinical Neurosciences and Mental Health (C3NMH), Medical University of Vienna, Vienna, Austria
Synopsis
Keywords: Deuterium, Deuterium, Dynamic 2D fitting; Deuterium metabolic imaging; Brain; 7T
Motivation: Dynamic deuterium metabolic imaging (DMI) data are currently evaluated by first fitting the spectral and then the temporal domain (1D), leading to great fit uncertainty. This might be improved by fitting both domains simultaneously (2D).
Goal(s): To compare dynamic 2D-fitting of time-resolved 3D-DMI data of the human brain and compare its performance to conventional 1D-fitting.
Approach: Simulated and in vivo DMI data were fitted using 1D- and 2D-fitting algorithms and results were compared in terms of precision and accuracy.
Results: 2D-fitting yielded higher precision and accuracy than 1D-fitting for simulated DMI data. For in vivo data, both fitting approaches yielded similar results.
Impact: Improving fitting accuracy to estimate the underlying metabolic kinetics from dynamic deuterium metabolic imaging (DMI) data is crucial, while establishing DMI towards clinical application. 2D-fitting approaches (simultaneous spectral and temporal fitting) could potentially improve overall robustness of the methodology.
Introduction
Alterations of brain glucose metabolism are present in many pathologies including dementia, cancer, and depression1-3. Deuterium metabolic imaging (DMI) can non-invasively image brain glucose (Glc) uptake and its downstream metabolism, such as neurotransmitter synthesis of glutamate+glutamine (Glx) or lactate production4-7. To assess the dynamics of deuterium (2H) labeled metabolites, typically a two-step fitting procedure is performed, i.e., first spectral fitting of the independent spectra is performed, then temporal fitting of the assumed underlying metabolic model to the outputs of the first stage. This 1D approach repeatedly and independently estimates the same parameters from noisy data for each spectral fit, raising overall fit uncertainty. Instead, a dynamic 2D-fitting approach that combines spectral and temporal fitting can yield reduced fit uncertainties compared to 1D-fitting algorithms8, 9. An open-source toolbox, FSL-MRS10, has been introduced recently, featuring modules for dynamic 2D-fitting of MRS/MRSI data. The purpose of this project is to investigate and evaluate dynamic 2D-fitting on simulated and in vivo DMI data and compare its performance to conventional 1D-fitting methods.Methods
To mimic in vivo data, synthetic 3D-2H-MRSI data were simulated for ten timepoints and three different noise levels, three components (water: 4.8ppm, glucose: 3.9ppm, glutamate+glutamine: 2.4ppm) and two compartments (gray and white matter: GM, WM). Glc concentrations were defined to increase monoexponentially with time constants τGM=15min and τWM=25min. Glx concentrations were defined to increase linearly with 50% lower concentrations in WM compared to GM. Deuterated water concentrations were stable over time.In vivo 3D-2H-MRSI data were acquired in five healthy volunteers (4m/1f) after overnight fasting and oral [6,6’]-2H glucose administration (0.8 g/kg body weight) on a 7T (Terra-dot-Plus) Siemens MR system. Whole brain 3D-2H-FID-MRSI data were acquired every ∼7min with ∼2ml isotropic resolution (TR=290ms, TE=1.5ms, FOV: 200x200x175, Ndatasets=10) using elliptical phase encoding and a dual-tuned quadrature bird-cage head coil (Stark Contrast MRI).
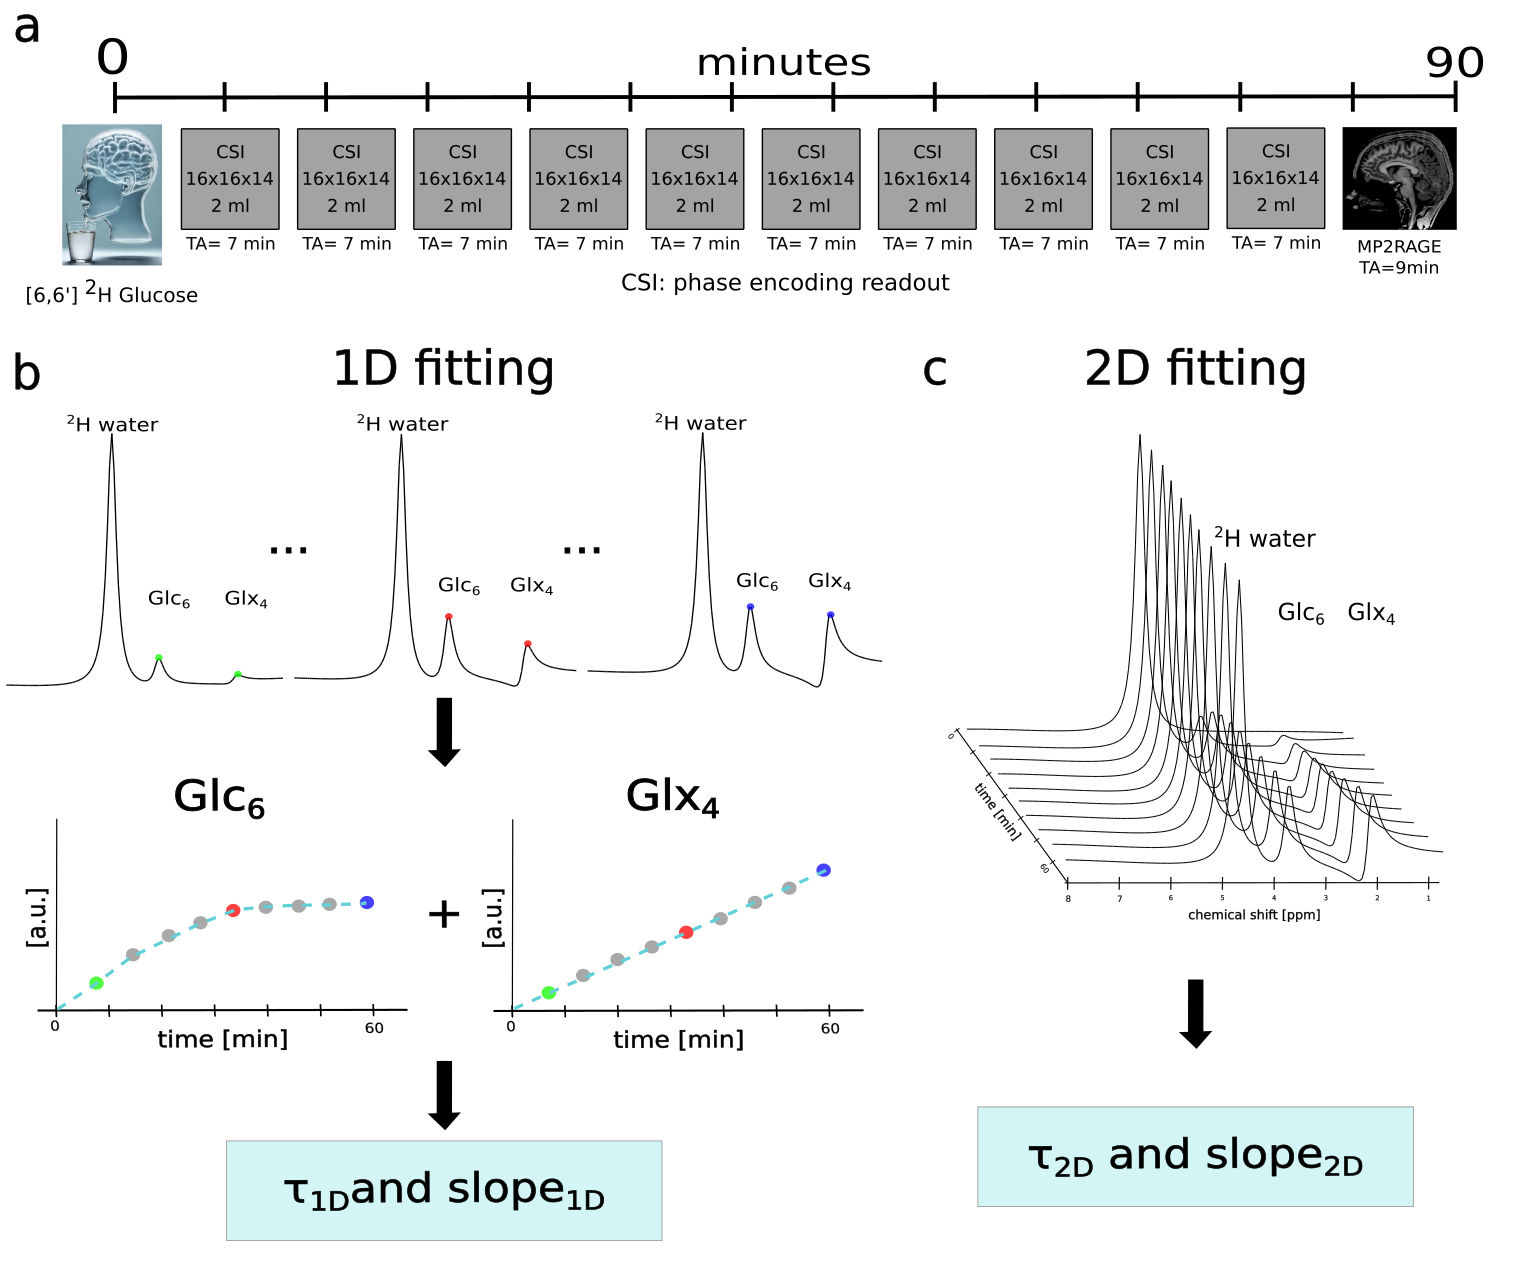
Spectral and temporal domain fitting was performed separately (1D) and simultaneously (2D) for simulated and in vivo MRSI data, using in-house post-processing (MATLAB R2021,LCModel,Python3.10)11-13 and FSL-MRS10, respectively (Figure 1). The temporal model fitted Glc with a monoexponentially increasing concentration and Glx with a linearly increasing concentration. Exponential time constants for Glc and slopes of the linear fit for Glx were compared to the ground truth for synthetic data. Regional coefficients of variation (COV) for GM and WM regions were compared between both methods for both synthetic and in vivo data. Additionally, contrast between GM and WM was calculated for in vivo Glc time constants and Glx slopes as ratio between GM and WM.
Results
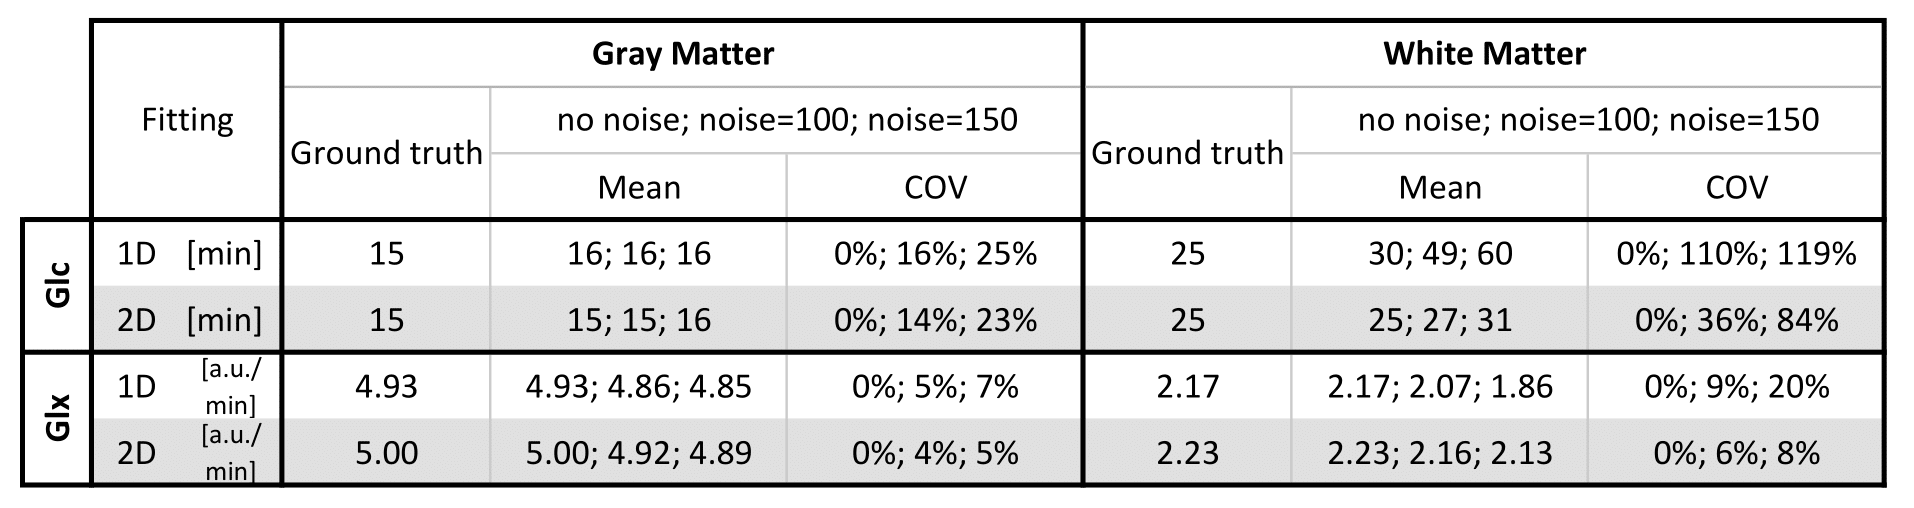
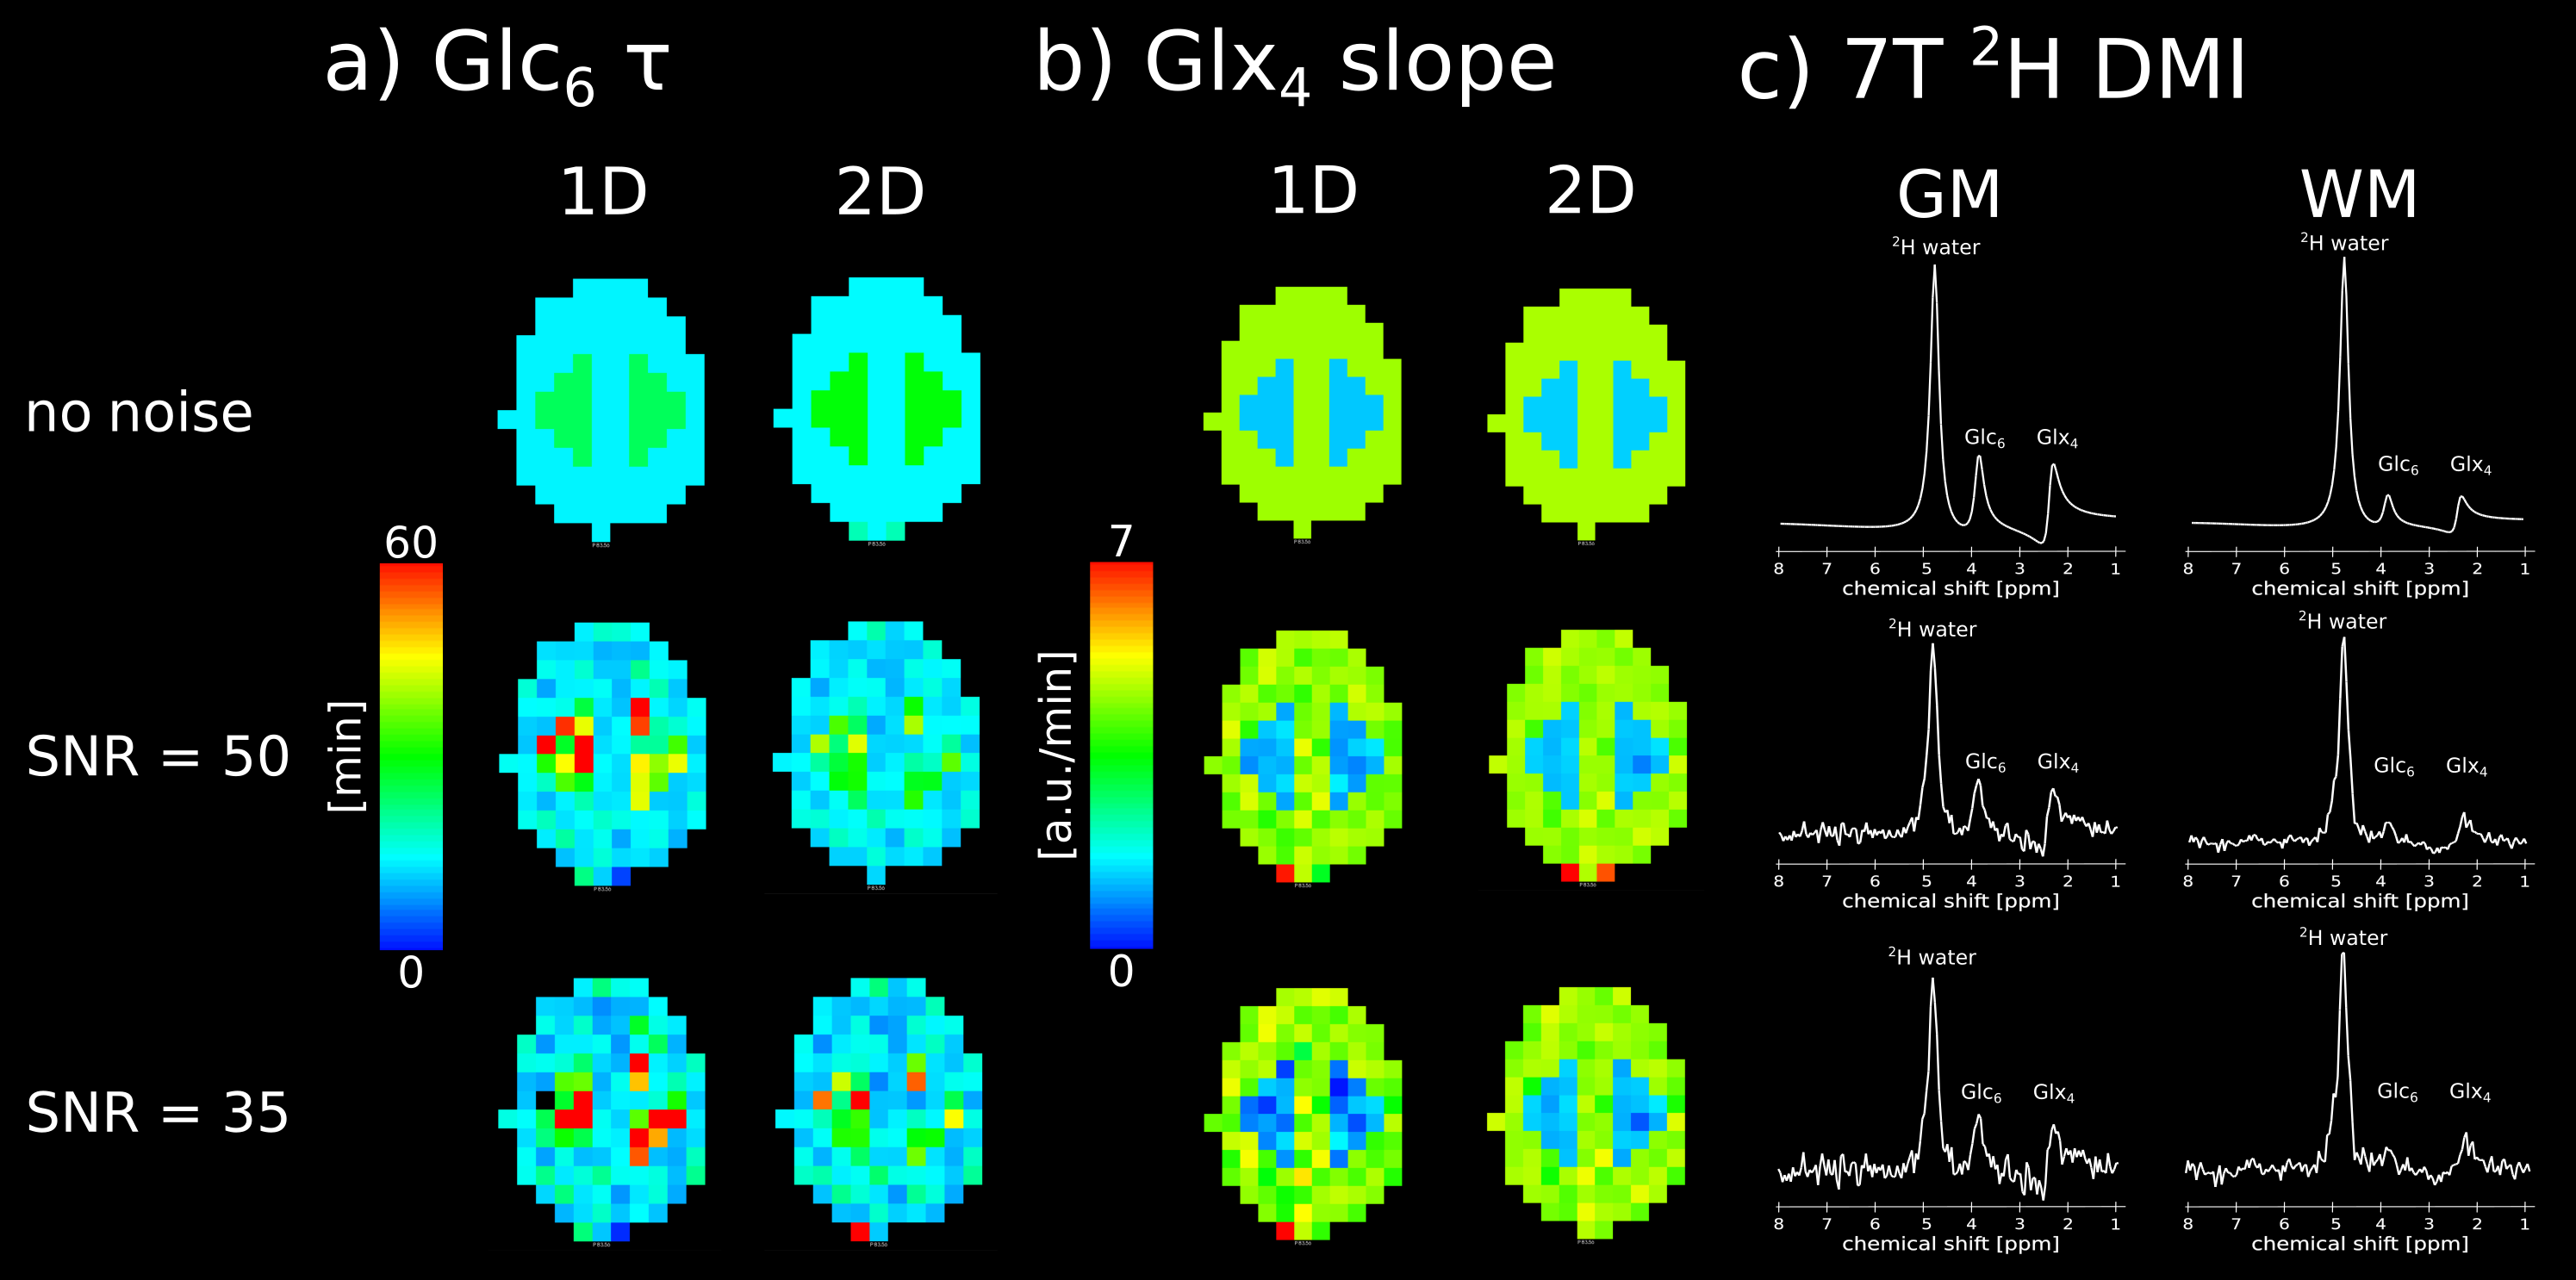
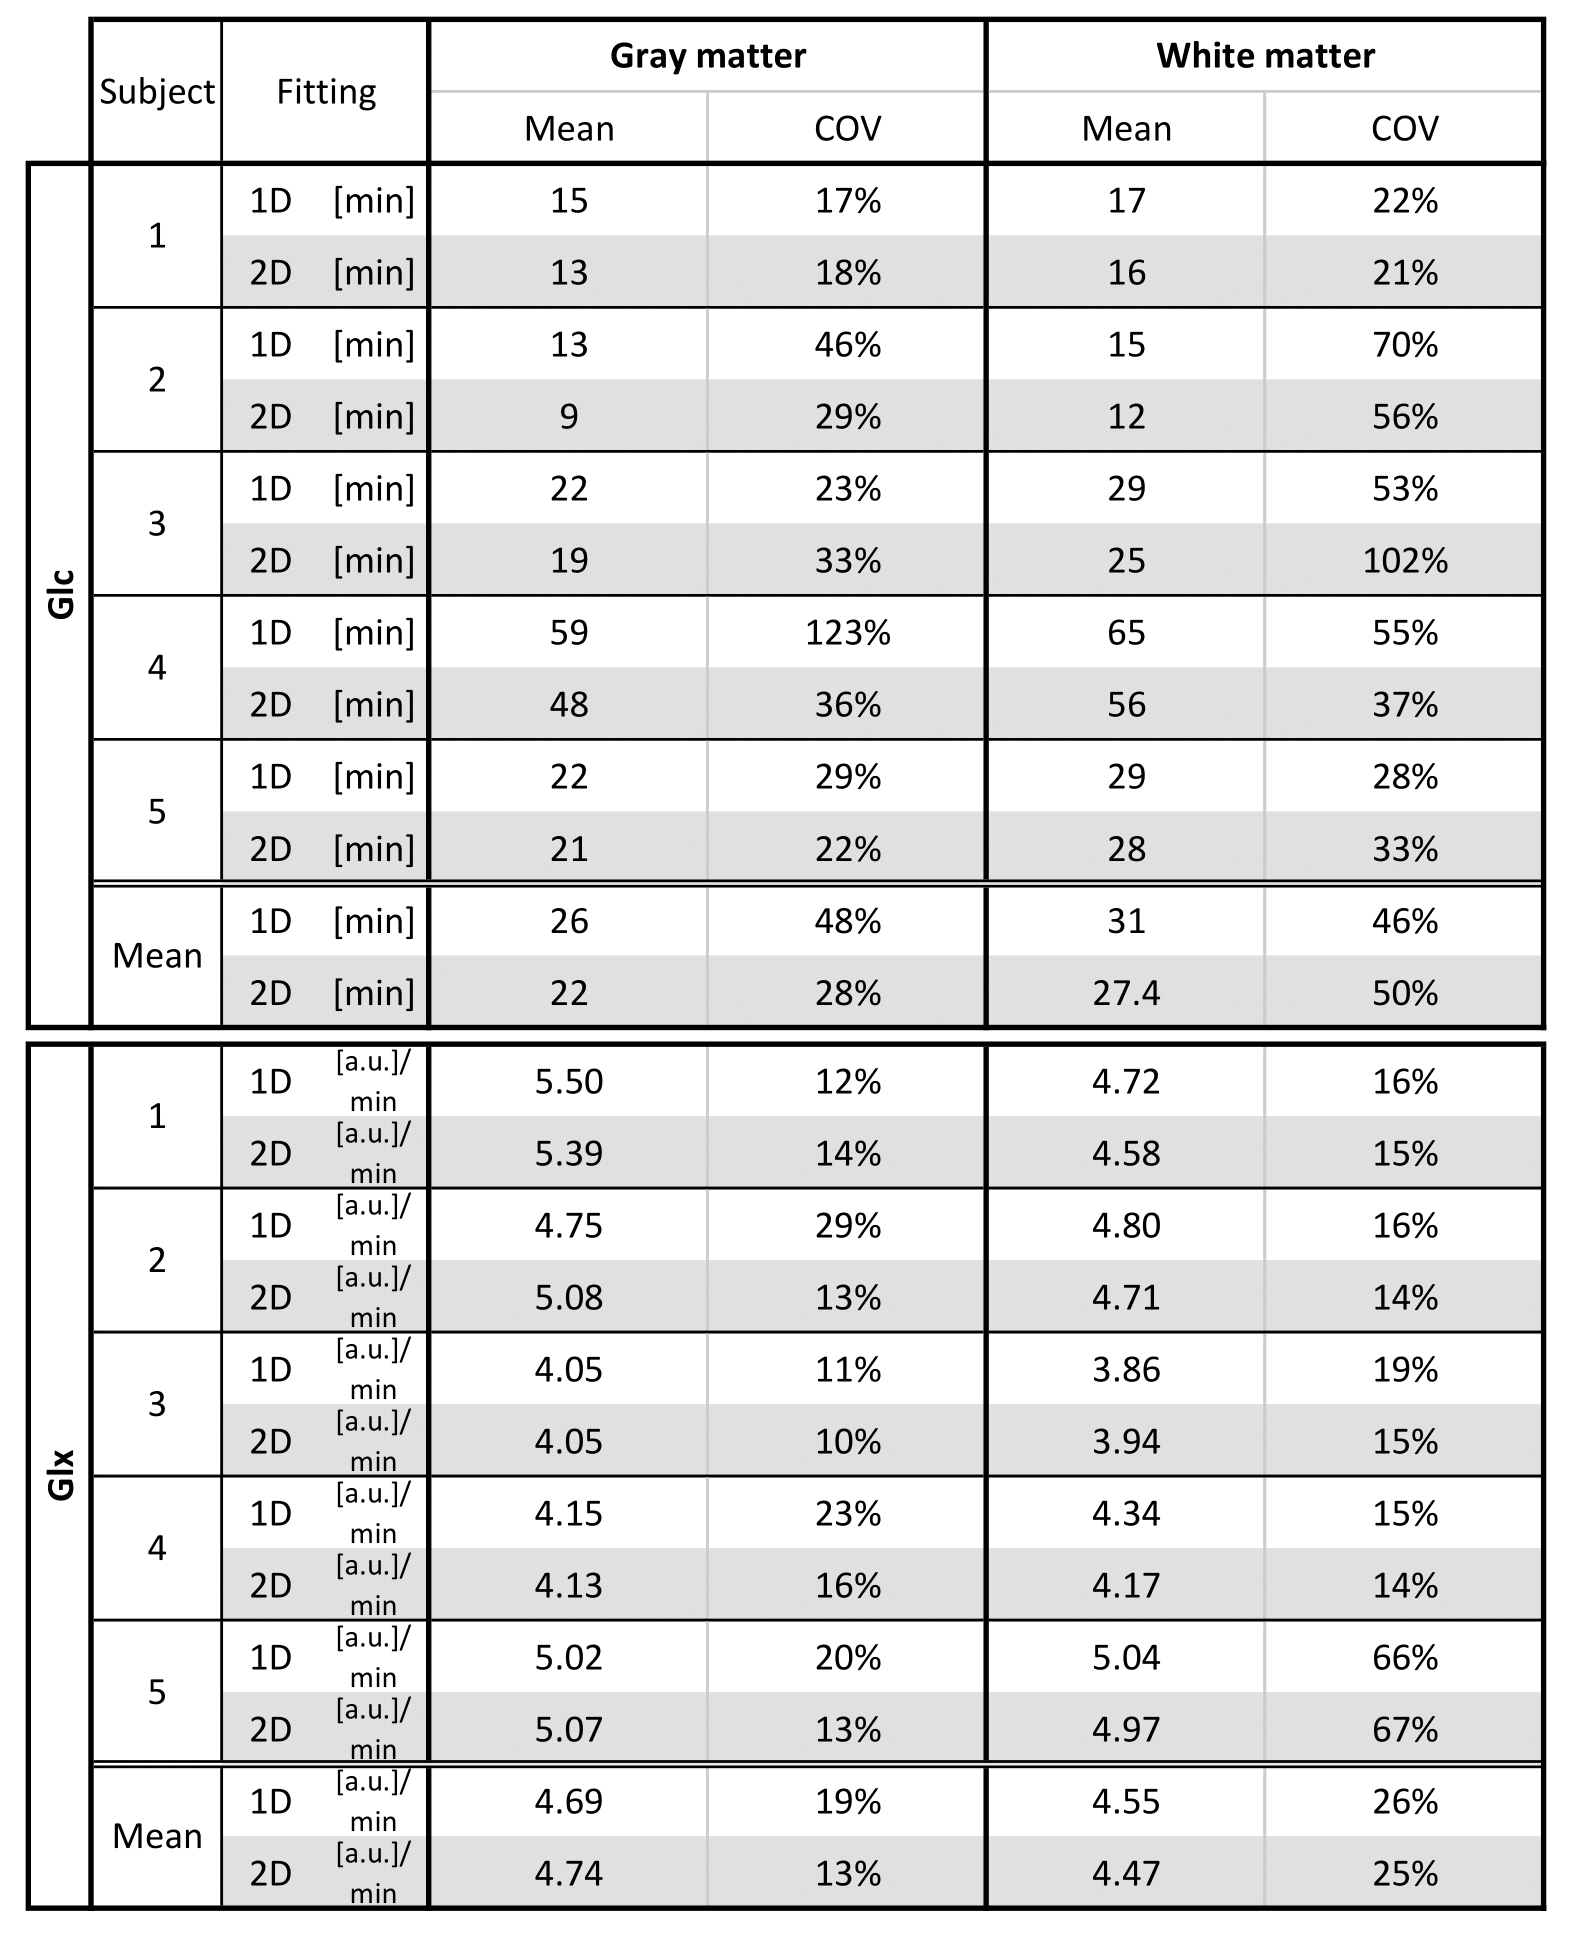
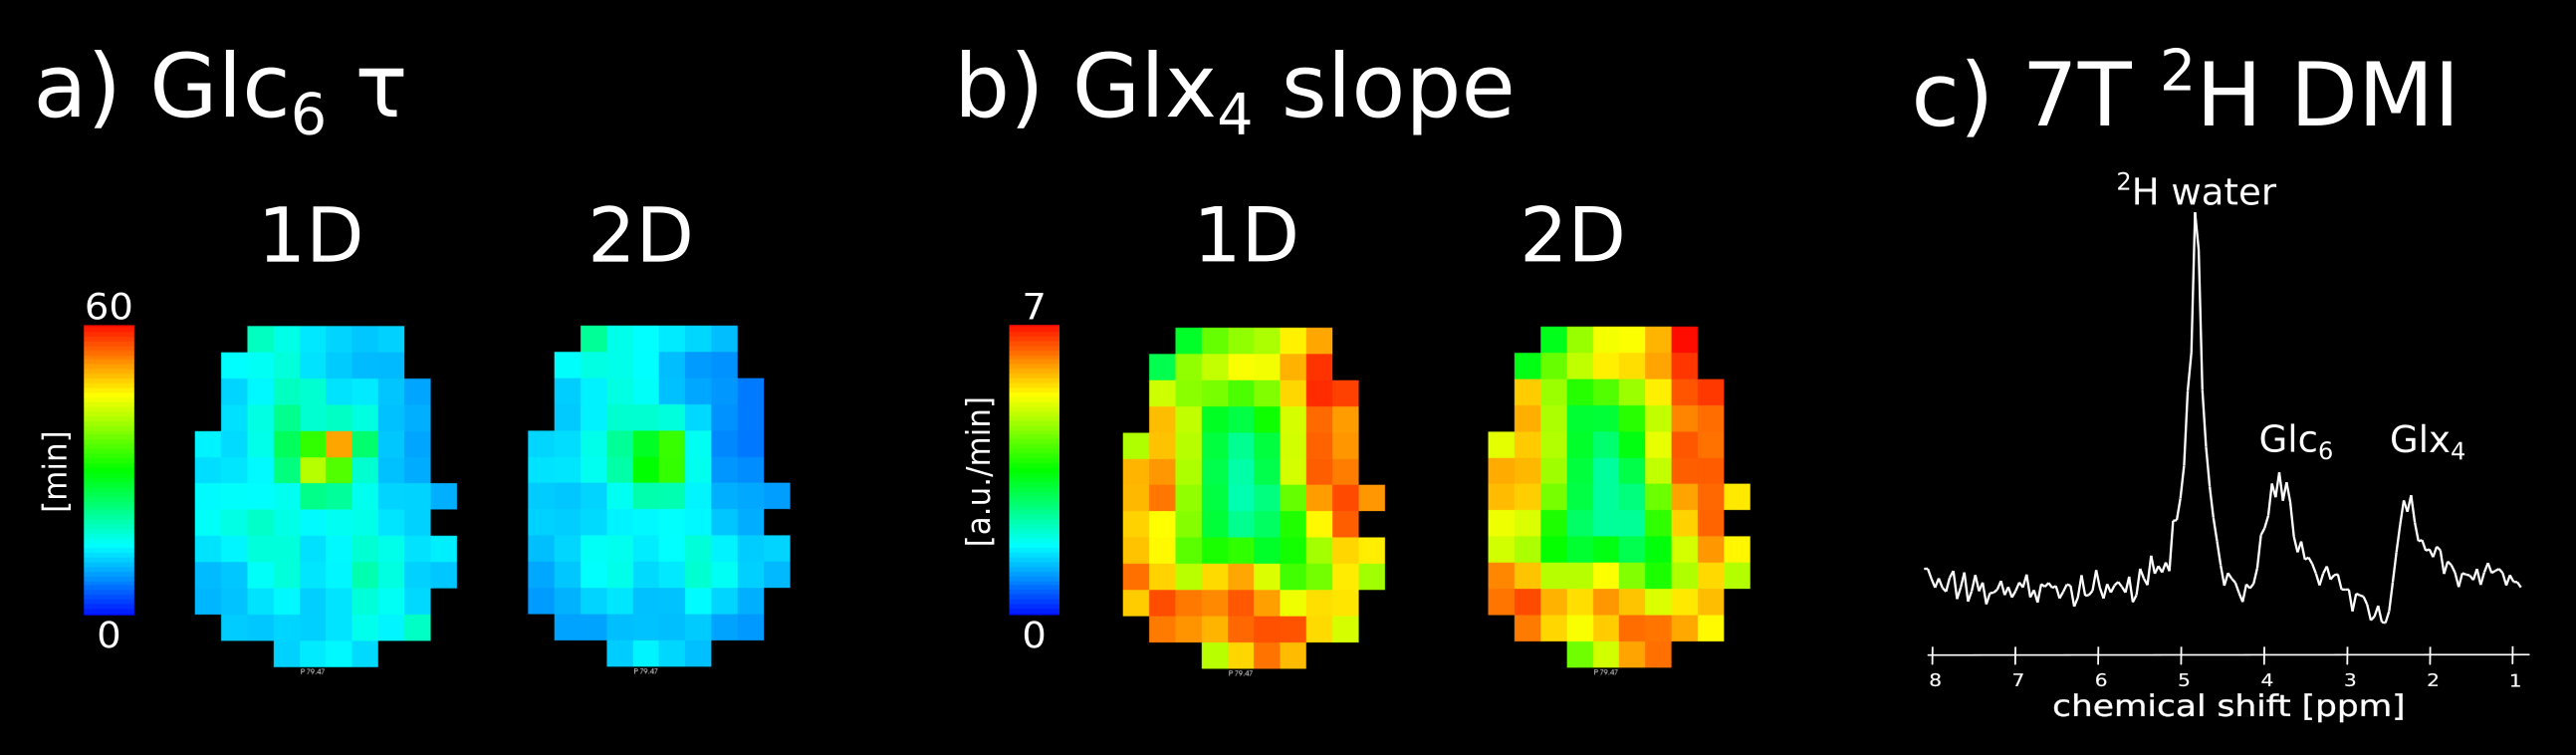
For synthetic 3D-2H-MRSI data, dynamic 2D-fitting yielded time constants (τGlc) for Glc and linear slopes of Glx which were on average closer to the ground truth compared to 1D-fitting. Additionally, lower regional COVs in both GM and WM were observed for 2D-fitting for all noise levels (Figure 2, Table 1). For in vivo data, both 1D- and 2D-fitting yielded similar τGlc and slopeGlx in GM (τ1D/τ2D=26±17/22±14min; slope1D/slope2D=4.70±0.60/4.74±0.61a.u./min) and WM (τ1D/τ2D=31±18/27±15min; slope1D/slope2D=4.55±0.46/4.47±0.42a.u./min) (Figure 3, Table 2). Regional COVs for τGlc and slopeGlx were not significantly different between both fitting approaches for GM (τCOV,1D/τCOV,2D=47±39/28±7%, p=.58; slopeCOV,1D/slopeCOV,2D=19±7%/13±2%, p=.09) and WM (τCOV,1D/τCOV,2D=46±18/50±28%, p=.90; slopeCOV,1D/slopeCOV,2D=16±2%/14±1%, p=.06). Nonetheless, significant differences between 1D- and 2D-fitting were found for contrasts between GM and WM for τGlc and slopeGlx (τContrast,1D/τContrast,2D=83±6%/79±5%, p=.02; slopeContrast,1D/slopeContrast,2D=103±8%/106±7%, p=.008).Discussion
In this study, we applied dynamic 2D-fitting (simultaneous spectral and temporal domain) of FSL-MRS to 3D-2H-MRSI data of the human brain. We demonstrated that FSL-MRS accurately and precisely estimated dynamic model parameters of the defined ground truth for different noise levels and in case of exponential fitting of glucose outperformed 1D-fitting even without noise. With increasing noise, accuracy and precision of 2D-fitting decreased, but still outperformed 1D-fitting.For in vivo data, both dynamic 2D- and 1D-fitting approaches yielded similar results for both τGlc and slopeGlx. The pronounced differences between 2D- and 1D-fitting observed in synthetic data were not reproduced. This might be caused by the choice of linear and exponential fitting for Glx and Glc metabolites, respectively, which do not reflect the real underlying metabolic model13 and were only used to qualitatively estimate the kinetics as close as possible. Furthermore, in vivo data have unknown physiologic variation, leading to higher COV within in vivo GM and WM than in synthetic GM and WM. The reported contrast in metabolic activity between GM and WM14 was significantly higher for 2D-fitting compared to 1D-fitting approaches, but the differences are small.
Conclusion
With accurate metabolic models and a bigger sample size, dynamic 2D-fitting could prove more reliable in future studies and potentially improve dynamic studies beyond DMI.Acknowledgements
No acknowledgement found.References
1. Manji, H., et al., Impaired mitochondrial function in psychiatric disorders. Nature Reviews Neuroscience, 2012. 13(5): p. 293-307.
2. Norat, P., et al., Mitochondrial dysfunction in neurological disorders: Exploring mitochondrial transplantation. npj Regenerative Medicine, 2020. 5(1): p. 22.
3. Koppenol, W.H., P.L. Bounds, and C.V. Dang, Otto Warburg's contributions to current concepts of cancer metabolism. Nature Reviews Cancer, 2011. 11(5): p. 325-337.
4. De Feyter, H.M. and R.A. de Graaf, Deuterium metabolic imaging - Back to the future. J Magn Reson, 2021. 326: p. 106932.
5. De Feyter, H.M., et al., Deuterium metabolic imaging (DMI) for MRI-based 3D mapping of metabolism in vivo. Science Advances, 2018. 4(8): p. eaat7314.
6. Ruhm, L., et al., Deuterium metabolic imaging in the human brain at 9.4 Tesla with high spatial and temporal resolution. Neuroimage, 2021. 244: p. 118639.
7. Straathof, M., et al., Deuterium Metabolic Imaging of the Healthy and Diseased Brain. Neuroscience, 2021. 474: p. 94-99.
8. Tal, A., The future is 2D: spectral-temporal fitting of dynamic MRS data provides exponential gains in precision over conventional approaches. Magn Reson Med, 2023. 89(2): p. 499-507.
9. Clarke, W.T., et al., Universal Dynamic Fitting of Magnetic Resonance Spectroscopy. bioRxiv, 2023: p. 2023.06.15.544935.
10. Clarke, W.T., C.J. Stagg, and S. Jbabdi, FSL-MRS: An end-to-end spectroscopy analysis package. Magn Reson Med, 2021. 85(6): p. 2950-2964.
11. Strasser, B., et al., Coil combination of multichannel MRSI data at 7 T: MUSICAL. NMR Biomed, 2013. 26(12): p. 1796-805.
12. Považan, M., et al., Mapping of brain macromolecules and their use for spectral processing of (1)H-MRSI data with an ultra-short acquisition delay at 7 T. Neuroimage, 2015. 121: p. 126-35.
13. Niess, F., et al., Reproducibility of 3D MRSI for imaging human brain glucose metabolism using direct ( (2) H) and indirect ( (1) H) detection of deuterium labeled compounds at 7T and clinical 3T. medRxiv, 2023.
14. Pan, J.W., et al., Spectroscopic imaging of glutamate C4 turnover in human brain. Magnetic Resonance in Medicine, 2000. 44(5): p. 673-679.
Figures