3048
MRI assessment of skin and muscle sodium (23Na) and fluid volume in haemodialysis patients1Sir Peter Mansfield Imaging Centre, University of Nottingham, Nottingham, United Kingdom, 2Centre of Kidney Research and Innovation, University of Nottingham, Derby, United Kingdom, 3NIHR Biomedical Research Centre, Nottingham Univ. Hospital NHS Trust and Univ. Nottingham, Nottingham, United Kingdom
Synopsis
Keywords: Non-Proton, Non-Proton
Motivation: To improve understanding of sodium and water balance in haemodialysis patients.
Goal(s): To study sodium stores in leg muscle and skin in younger and older healthy individuals, and haemodialysis patients, and to assess sodium and water changes following a single haemodialysis session.
Approach: Sodium (23Na) MRI of calf skin and muscle in younger older and haemodialysis(HD) patients. 23Na MRI, and 1H mDIXON and T2 relaxometry to study sodium and water content to haemodialysis.
Results: Haemodialysis led to a significant reduction in muscle sodium whilst skin sodium showed little detectable change, 1H muscle T2 values showed a significant reduction.
Impact: Sodium (23Na) MRI of muscle allows the study of sodium storage with age and in dialysis patients. 23Na and proton (1H) T2 mapping enable the assessment of changes in sodium storage and fluid status in haemodialysis patients.
Introduction
Haemodialysis (HD) is life sustaining for patients with end-stage kidney disease (ESKD). In healthy subjects, sodium balance is regulated by the kidneys, but in ESKD this is achieved by sodium removal during HD. Recent evidence suggests non-osmotically stored sodium in the muscle and/or skin may be a critical factor impacting the development of hypertension and cardiovascular disease (CVD)1,2. Sodium (23Na) MRI allows the assessment of skin and muscle sodium storage and may provide a valuable tool in evaluating sodium storage in dialysis patients3,4,5. Here, 23Na MRI is used to measure muscle and skin tissue sodium concentration (TSC) in younger and older healthy individuals, and HD participants. HD participants are scanned before and after a single haemodialysis session using 23Na MRI as well as 1H T2 relaxometry to study changes in fluid status.Methods
Data were collected on 15 younger (23-38yrs,8M:7F) and five older (66-77yrs,4M:1F) healthy volunteers (HVs), and 10 HD patients (55-73 yrs,5M:5F) who had been on HD for >3months. HD patients underwent a pre-HD 23Na MRI calf scan, then had their usual dialysis session with a 137 mmol/L dialysate 23Na prescription, followed by a repeat post-HD 23Na MRI scan. Patient demographics, dialysis vintage, residual renal function, and ultrafiltration volume were collected, along with blood samples at the start and end of the dialysis session, including serum sodium.MRI data was collected on a 3T Philips Ingenia scanner, using a 23Na birdcage leg coil (PulseTeq Ltd) to acquire 23Na scans, and the Q-body coil to collect 1H measures. The protocol comprised a 1H mDixon (0.4x0.4x8mm3,TE/TR=20/500ms,FA=90o,15 slices,TA:4-minutes) scan for localisation and muscle segmentation and 1H GraSE T2 mapping (TR=3000ms, 32 echoes, 10ms echo spacing) with a mono-exponential fit. 23Na images were acquired using a 3D GRE short TR sequence (3x3x30mm3,10 slices, TE/TR=1.26/13ms, FA=46o, NSA 155, 15-minutes) for TSC quantification with high SNR per unit time6. Reference bottles (10, 20, 30 and 40mmol/L NaCl, confirmed to have a T1 matched to the tissue) were placed in the RF coil above the leg to calibrate TSC muscle and skin maps. Regions-of-interest (ROIs) of each muscle group and the skin were manually segmented on mDIXON scans. For these ROIs, the voxel-wise mode (to avoid influence of signals from vessels) of TSC and T2 in each muscle group was estimated. A paired-sample t-test was performed between metrics pre-HD and post-HD. Absolute TSC and T2 measures, and DTSC and DT2 were correlated with clinical measures (Fig.1).
Results
Figure 2 shows TSC maps in the younger and older HV group, and HD patients pre-HD. HD Subject 8 (who had a failed transplant and returned to dialysis) showed a high level of muscle and subcutaneous tissue oedema and so was removed from group measures. In older HVs compared to younger HVs, TSC was significantly increased in muscle (P=0.01) with a trend for increased TSC in skin (P=0.06). HD patients had higher TSC pre-HD in muscle and skin than the younger HVs, but lower than older HVs. Figure 3 shows TSC maps of the HD patients pre-HD and post-HD. There was a significant reduction in TSC in the extensor, peroneus and gastrocnemius muscles post-HD, but skin sodium showed no detectable change (Fig.3B). Post-HD TSC was significantly positively correlated with post-HD Systolic Blood Pressure (SBP) (P<0.004). 1H GraSE T2 maps (Fig.4A) show a significant reduction in muscle T2 post-HD compared to pre-HD for all muscle groups (Fig.4B). There were no significant correlations between T2 and 23Na measures, or T2 and clinical measures.Discussion
We show a reduction in muscle and skin TSC in younger than older healthy subjects. TSC of HD patients falls within the range of the younger to older HVs, except HD Subject 8 who had noticeable oedema. Post-HD TSC values are consistent with published data from patients dialysed against 137 mmol/l sodium dialysate, and show a significant correlation of post-HD TSC with post-HD SBP, as previously reported by Lemione et al.4 and shown with plasma sodium7. 1H muscle T2 reduced between pre-HD and post-HD, consistent with published data8, as patients change from a pre-HD state of hypervolemia to a post-HD state closer to euvolemia after fluid removal. There was no relationship between the absolute or change in TSC and the 1H T2 values, suggesting different mechanisms involved in the equilibrium conditions for water and sodium ion concentrations.Conclusion
Further studies are planned to study the effect of dialysate sodium on muscle TSC and mechanistic links to CVD, including the use of a dedicated skin coil9,10 to study skin sodium and inclusion of bioimpedance fluid measures.Acknowledgements
Matthew Clemence, Philips Healthcare Clinical Science is acknowledged for their support and Fresenius Medical for funding this work.References
1. C. Kopp et al., “23Na magnetic resonance imaging of tissue sodium,” Hypertension, vol. 59, no. 1, pp. 167–172, 2012.
2. D. Kannenkeril et al., “Tissue sodium content in patients with type 2 diabetes mellitus,” J. Diabetes Complications, vol. 33, no. 7, pp. 485–489, Jul. 2019.
3. B. Canaud et al., “Sodium and water handling during hemodialysis: new pathophysiologic insights and management approaches for improving outcomes in end-stage kidney disease,” Kidney Int., vol. 95, no. 2, pp. 296–309, Feb. 2019.
4. S. Lemione, et al., Influence of dialysate sodium prescription on skin and muscle sodium concentration, Am J Kidney Dis, 2021 Jul;78(1):156-159.
5. A. Dahlmann et al., “Magnetic resonance-determined sodium removal from tissue stores in hemodialysis patients.,” Kidney Int., vol. 87, no. 2, pp. 434–41, 2015.
6. B. Prestwich et al., Comparison of short and long TR Gradient Recalled Echo (GRE) measure of total sodium concentration mapping in the calf, ISMRM Toronto, 2023.
7. R. Suckling at al., Dietary salt influences postprandial plasma sodium concentration and systolic blood pressure, Kidney International, 81 (4) 407-411, 2012.
8. L. Colucci et al., Fluid assessment in dialysis patients by point-of-care magnetic relaxometry, Sci Transl. Med. 2019. Jul 11(502).
9. J. Zhu et al., Skin Sodium Concentration is Elevated with Aging but Relative Change Depends on Spatial Resolution of 23Na MRI. MR Imaging of X‐Nuclei (23Na & Friends): From Controversies to Potential Clinical Applications, Part II, 2023.
10. T. Slater et al., High Spatial Resolution Imaging of the Skin. MR Imaging of X‐Nuclei (23Na & Friends): From Controversies to Potential Clinical Applications, Part II, 2023.
Figures
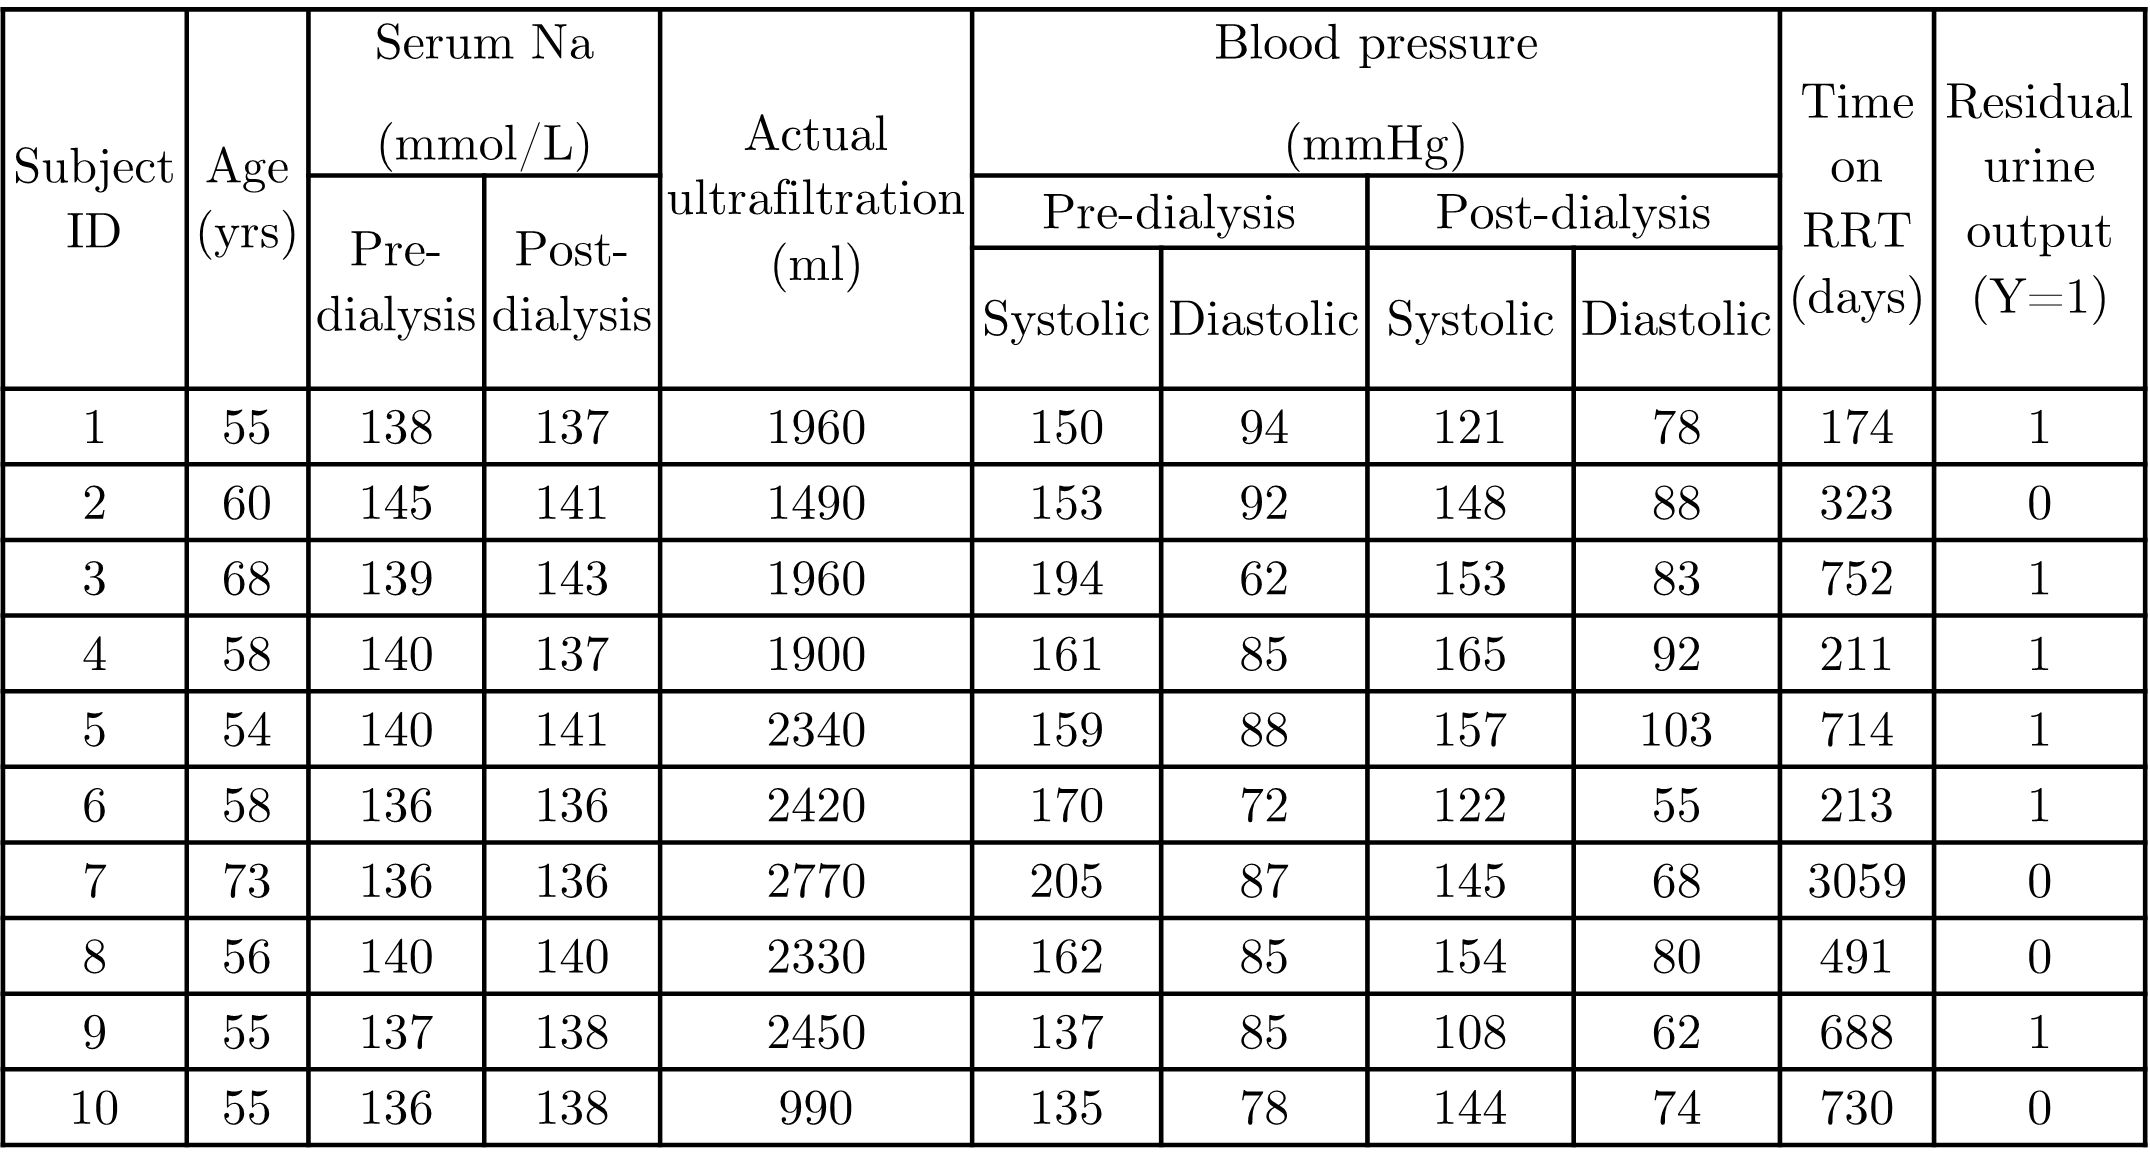
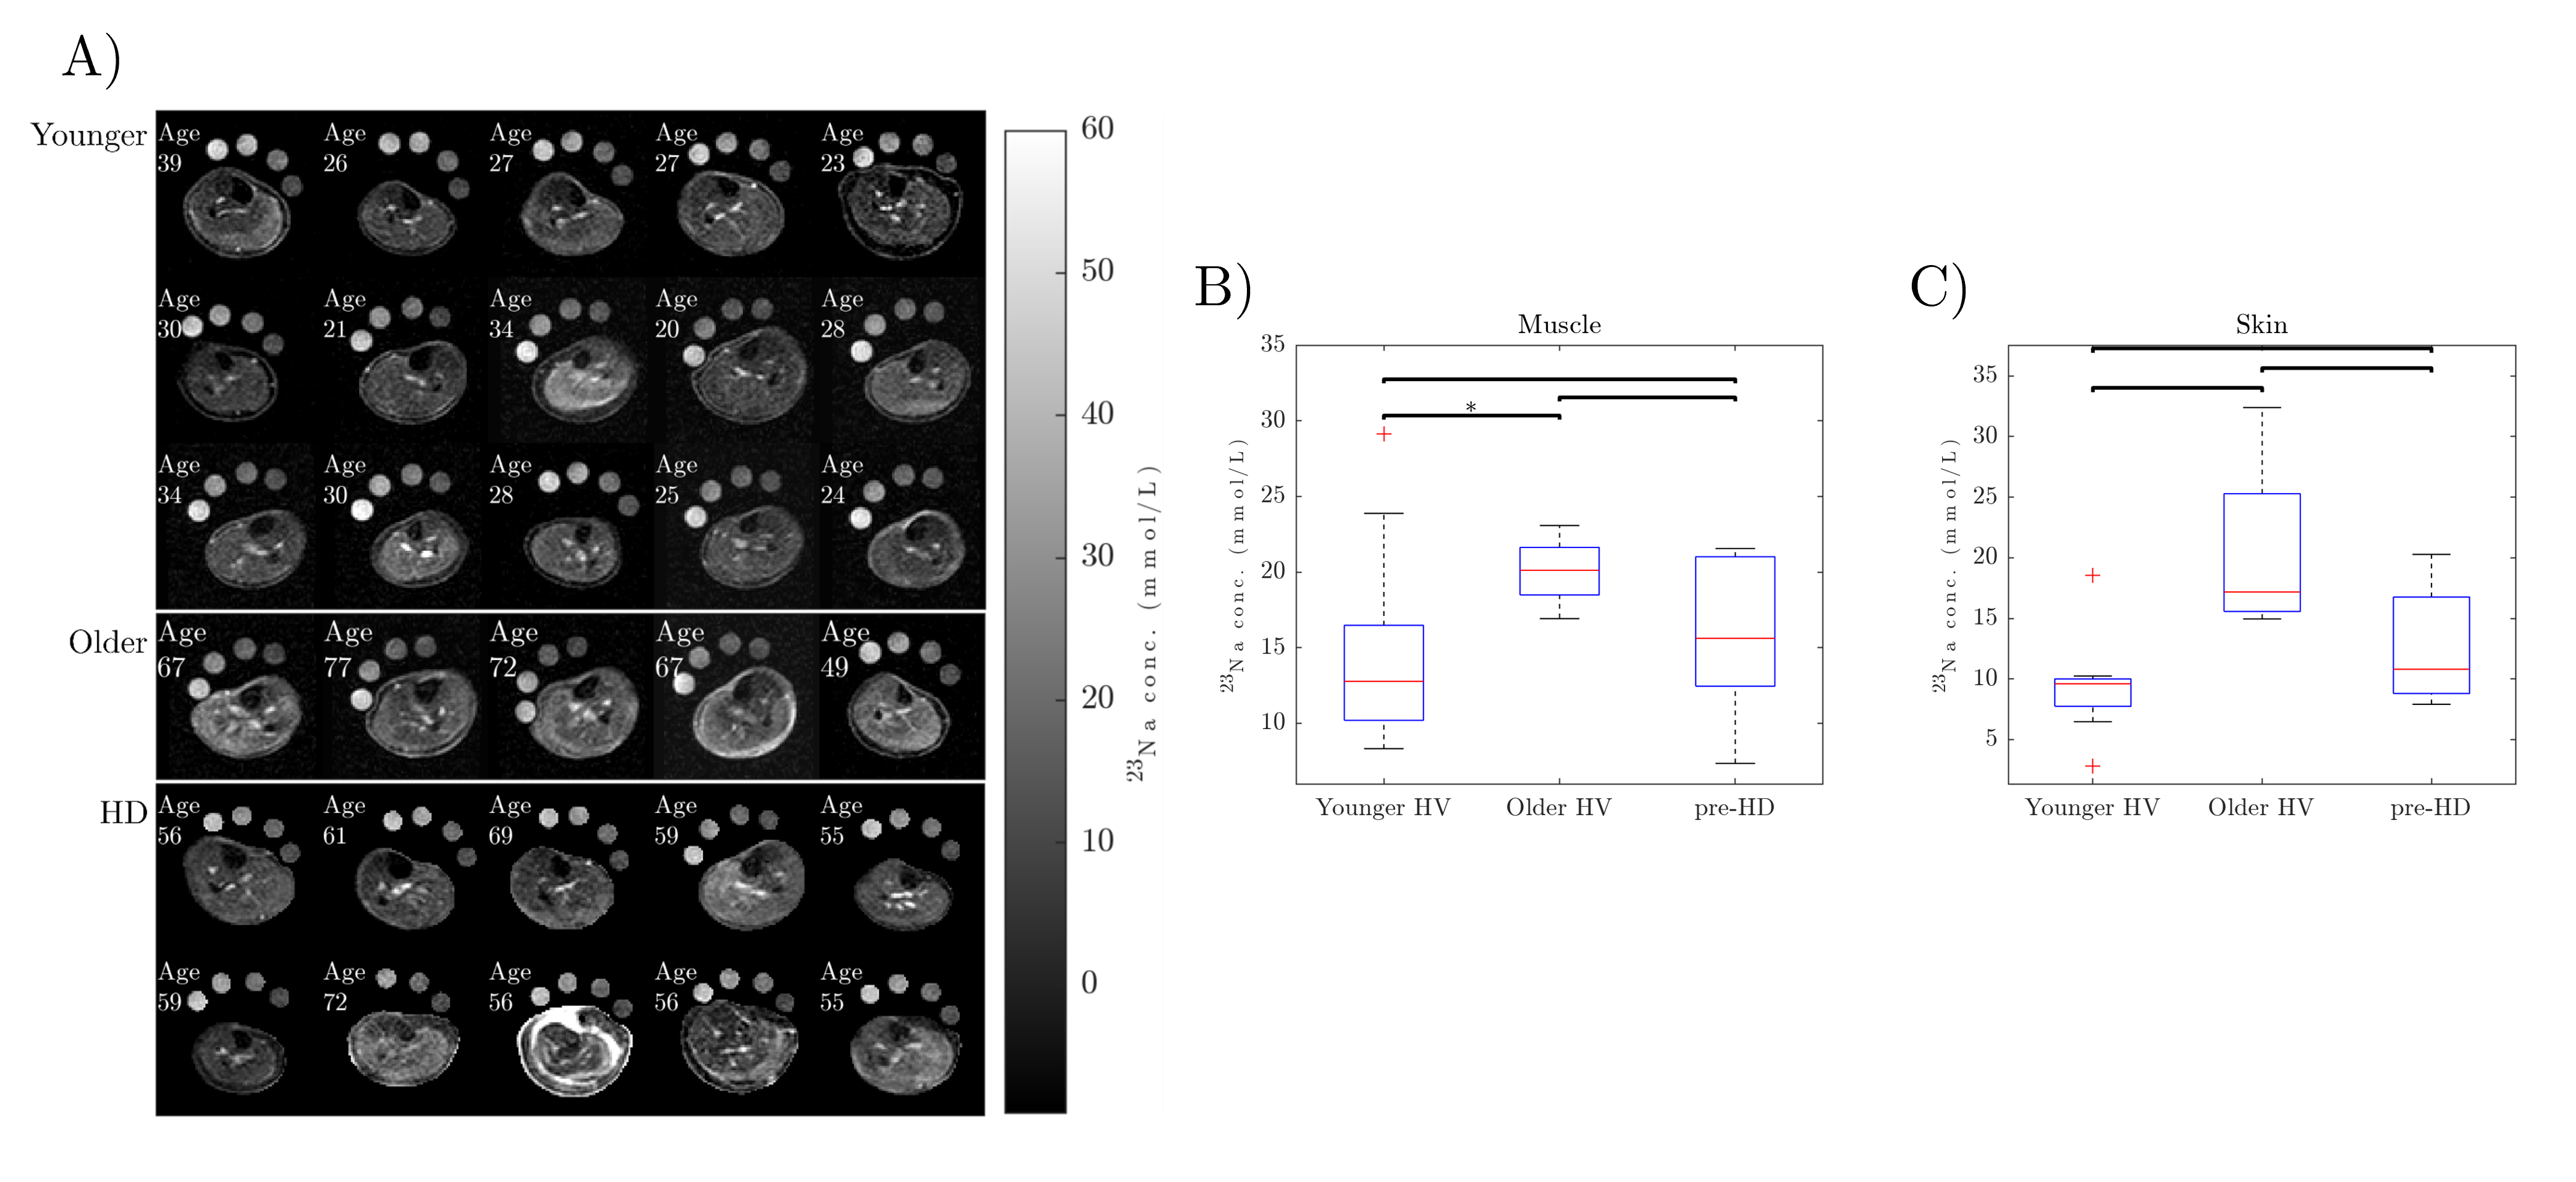
Figure 2: (A) Maps of tissue sodium concentration (TSC) in mmol/L obtained using 3T 23Na MRI in 15 Younger (23-38yrs, 6M:9F) and 5 Older (49-77yrs, 3M:2F) healthy volunteers and 10 Haemodialysis (HD) patients (55-73 yrs, 5M:5F). The four reference bottles (10, 20, 30 and 40mmol/L NaCl) can be seen above the leg. (B) TSC in the muscle for each group showing a significant (P< 0.05) increase in TSC in the muscle in older HVs compared to younger HVs, but no significant difference with HD (excluding Subject 8). (C) TSC in the skin for each group, with no significant differences between groups.
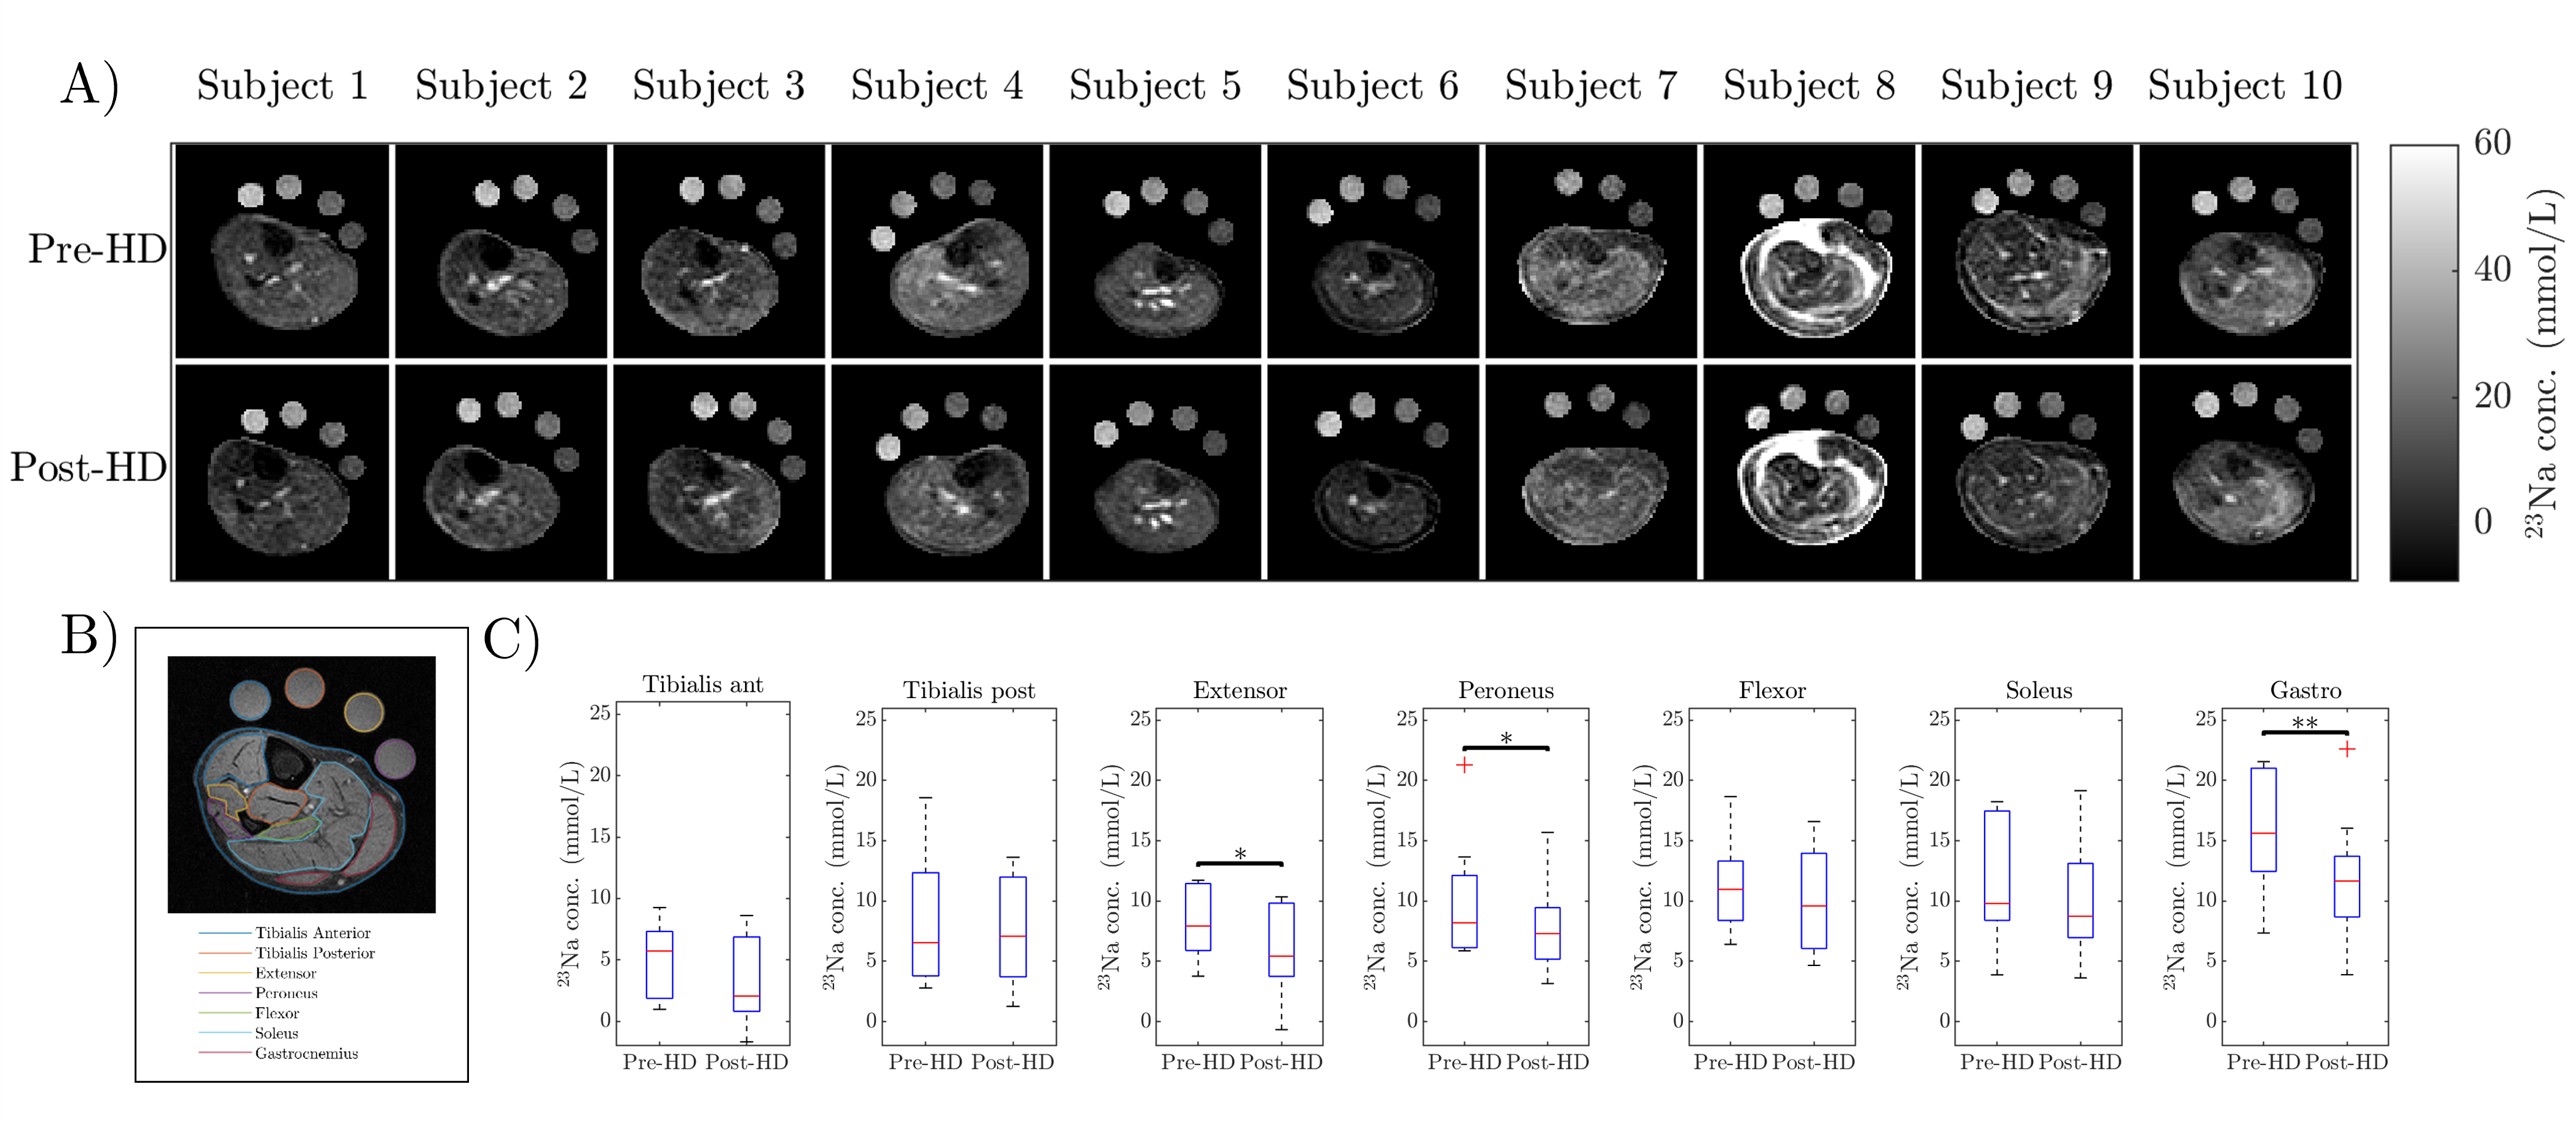
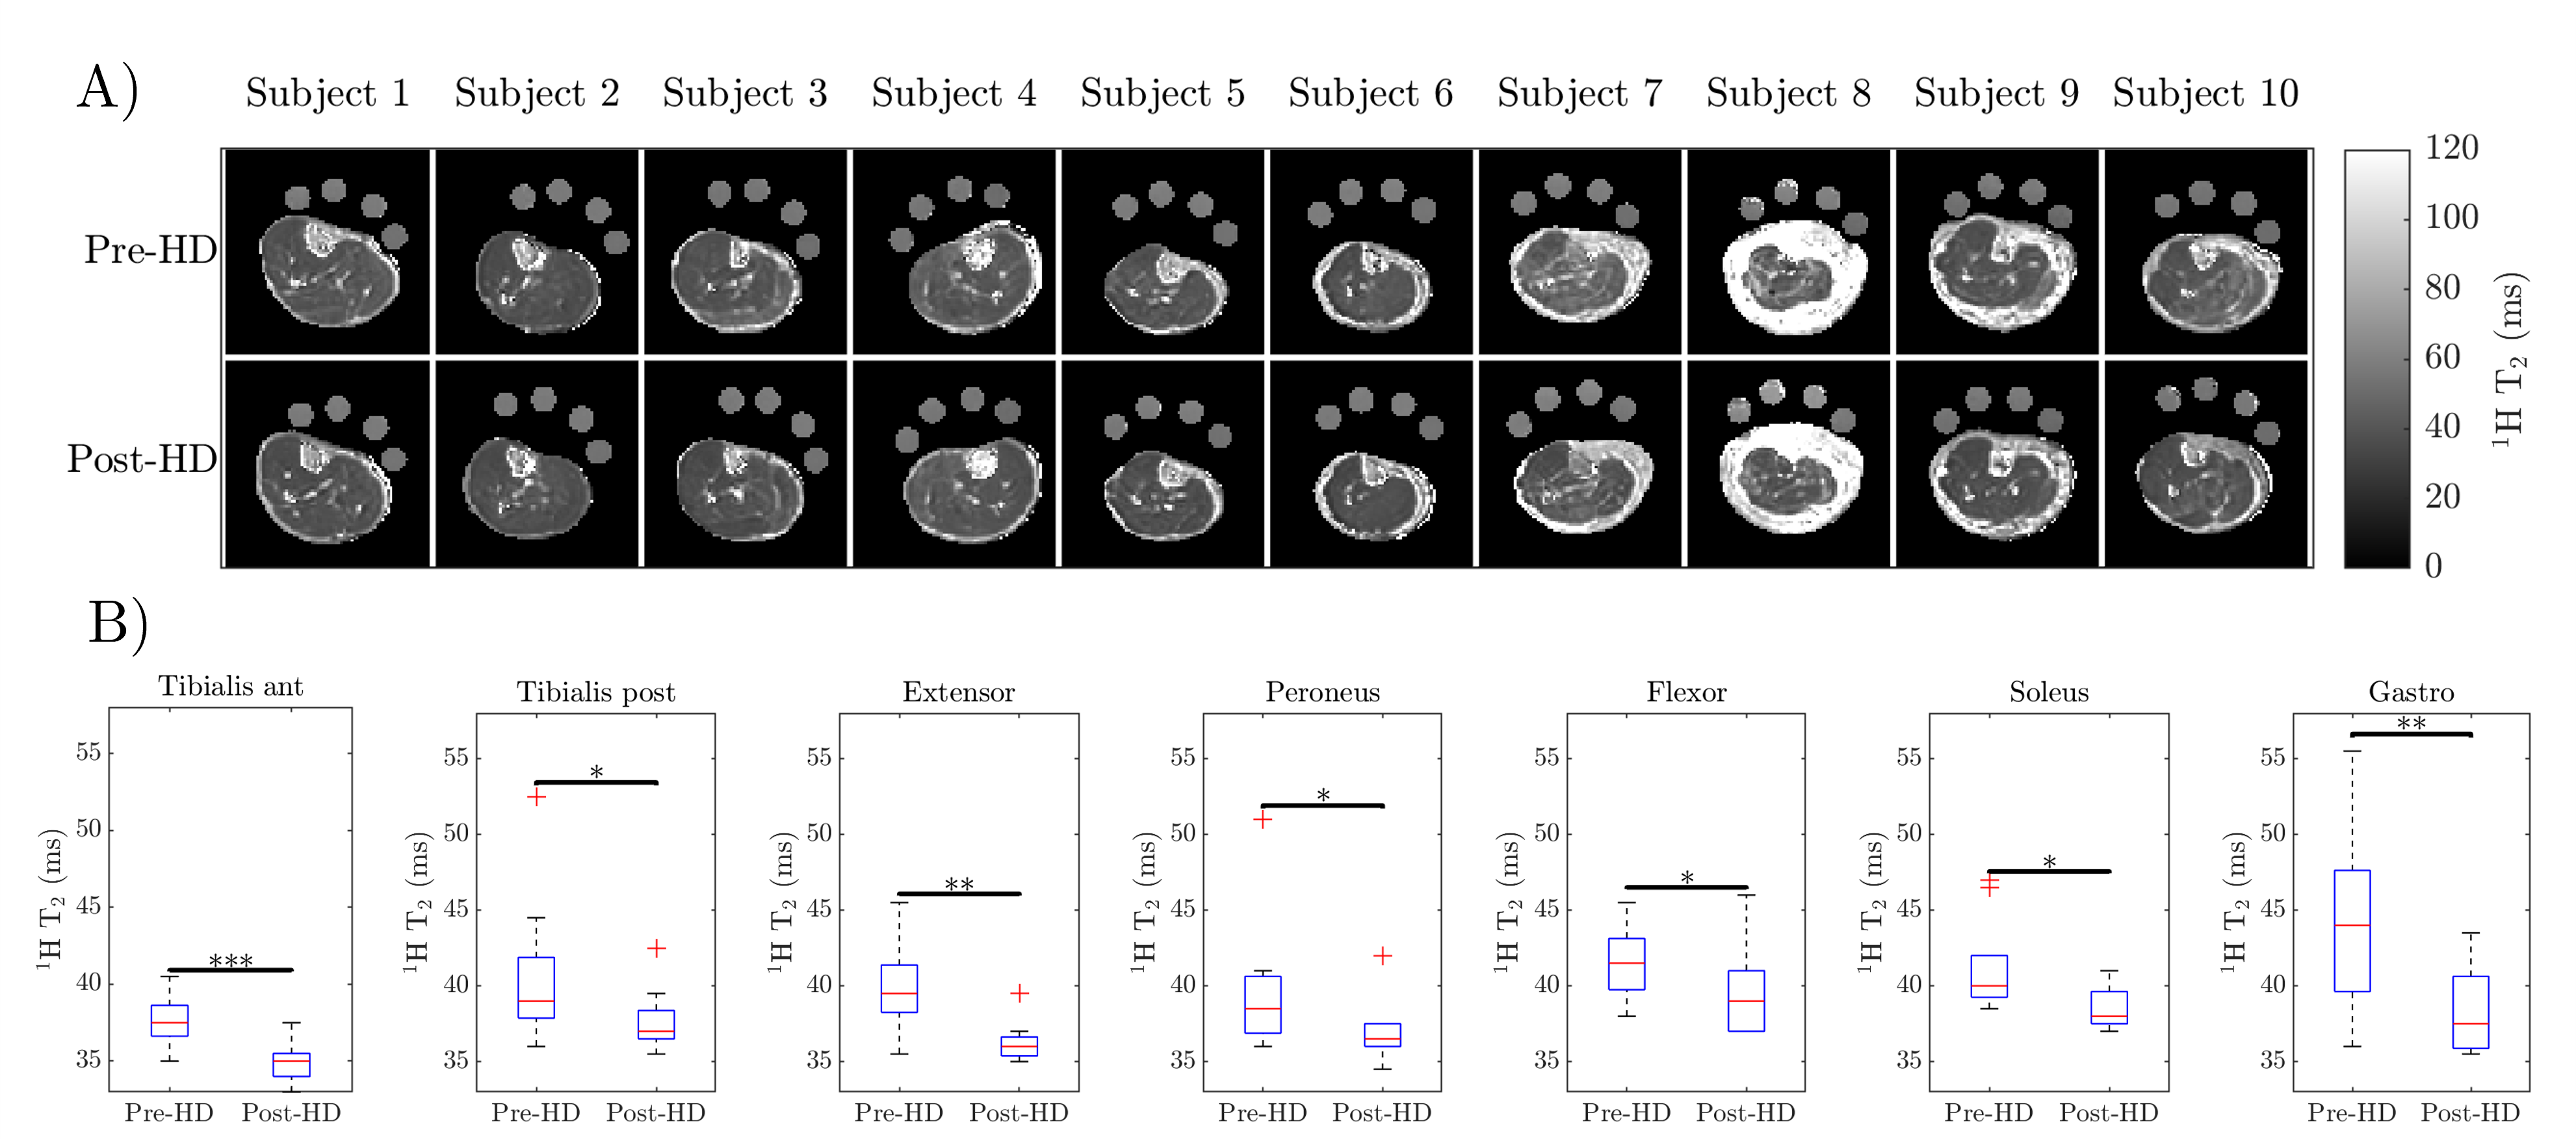
Figure 4: (A) 1H GraSE T2 maps for the haemodialysis (HD) patients pre-HD and post-HD. Note the high T2 in Subject 8, a patient who had a failed transplant and returned to dialysis. (B) T2 of each muscle group pre-HD and post-HD, with a significant reduction in T2 for all muscle groups seen post-HD (Subject 8 excluded). *p<0.05, **p<0.01, **p<0.001.