3047
Quantification of downstream metabolites in healthy participants using 7T DMI following [2H2] glucose and [2H7] glucose ingestion1Sir Peter Mansfield Imaging Centre, University of Nottingham, Nottingham, United Kingdom, 2School of Physics and Astronomy, University of Nottingham, Nottingham, United Kingdom, 3Radiological Sciences, Mental Health and Clinical Neuroscience, School of Medicine, University of Nottingham, Nottingham, United Kingdom, 4NIHR Nottingham Biomedical Research Centre/Nottingham Clinical Research Facilities, Queen's Medical Centre, Nottingham, United Kingdom
Synopsis
Keywords: Deuterium, Deuterium, Spectroscopy, Metabolism
Motivation: Most Deuterium Metabolic Imaging (DMI) studies have employed doubly labelled D2-glucose, but fully labelled D7-glucose produces higher deuterium concentrations in the brain, providing higher signal-to-noise-ratio measurements and additional information about metabolism.
Goal(s): We carried out a detailed comparison of 7T DMI measurements in the brain in 15 participants who ingested either D7-glucose or D2-glucose.
Approach: 3D 2H CSI data was acquired at 7T at natural abundance and then every 15 minutes for ~65- minutes following ingestion of 0.75 g/kg of labelled glucose.
Results: Larger signals and concentrations were measured following D7-glucose ingestion, D7/D2 signal ratios were explained by differing numbers of labels.
Impact: Deuterium metabolic imaging (DMI) using labelled glucose forms a powerful tool for mapping glucose metabolism. D7-glucose produces higher deuterium concentrations in the brain, providing a higher signal-to-noise-ratio that would be valuable in studies of metabolism in health and disease.
Introduction
Deuterium (2H) metabolic imaging (DMI) using labelled glucose forms a useful tool for mapping glucose metabolism in the human body1-3. Most DMI studies have employed doubly labelled [6,6’-2H2] glucose (D2)1-4, but fully labelled [1,2,3,4,5,6,6’-2H7] glucose (D7) can also be used, providing higher deuterium concentrations in glucose and its downstream metabolic products. This yields a higher signal-to-noise-ratio in measurements made following ingestion of a given amount of labelled glucose, which can potentially be used to improve the spatial resolution, although D7-glucose is significantly more expensive than D2-glucose. Comparison of metabolite signals measured following administration of similar amounts of D2- and D7-glucose, can also provide additional insight into metabolic processes. Here we present a detailed comparison of 7T DMI measurements in the brain in 15 participants who ingested either D7-glucose or D2-glucose.Methods
Data was acquired on a Philips Achieva 7T scanner with a dual-tuned 2H/1H birdcage coil (Rapid Biomedical). The full scanning protocol has been described previously5, but has now been applied to an additional 5 participants. Baseline scanning at natural abundance (NA) included a 1H MPRAGE scan and a 3D 2H chemical shift imaging (CSI) (Averages = 6, Tscan = 670 s, FOV = 180 x 180 x 120 mm3, TR = 230 ms, TE = 2.4 ms, 15 mm isotropic voxels, Bandwidth = 1200 Hz). Participants then drank an aqueous solution of 0.75g/kg (bodyweight) of D2- or D7-glucose. Subjects returned to the magnet bore (after a time of 0-25 mins) and another MPRAGE scan was acquired, followed by 4-5 repeats of the 2H CSI scans with around 15 mins between scans. Eight participants ingested D2-glucose while seven ingested D7-glucose.Each CSI-data-set was denoised using a tensor Tucker decomposition6,7 with a core matrix of [64 6 6 4] (1 spectral and 3 spatial dimensions). Spectra were then fitted using the OXSA-AMARES8,9 toolbox to model metabolites, water (HDO), glucose (Glc), glutamate and glutamine (Glx) and lactate (Lac). Each glucose label site for each anomer10 was fitted with a different Lorentzian peak (four/fourteen for D2-/D7-glucose). Other metabolites were fitted with single Lorentzian peaks. MPRAGE images registered to the MNI-152 image using the FSL toolbox11-15 and masks for the occipital lobe, frontal lobe, and the whole-brain were created. The complex amplitude maps were then averaged over the different masks to obtain metabolite signal values at each timepoint. These values were converted to concentrations by correcting for T1 effects2 and label-loss16, and by scaling by the signal from the HDO at NA.
Results
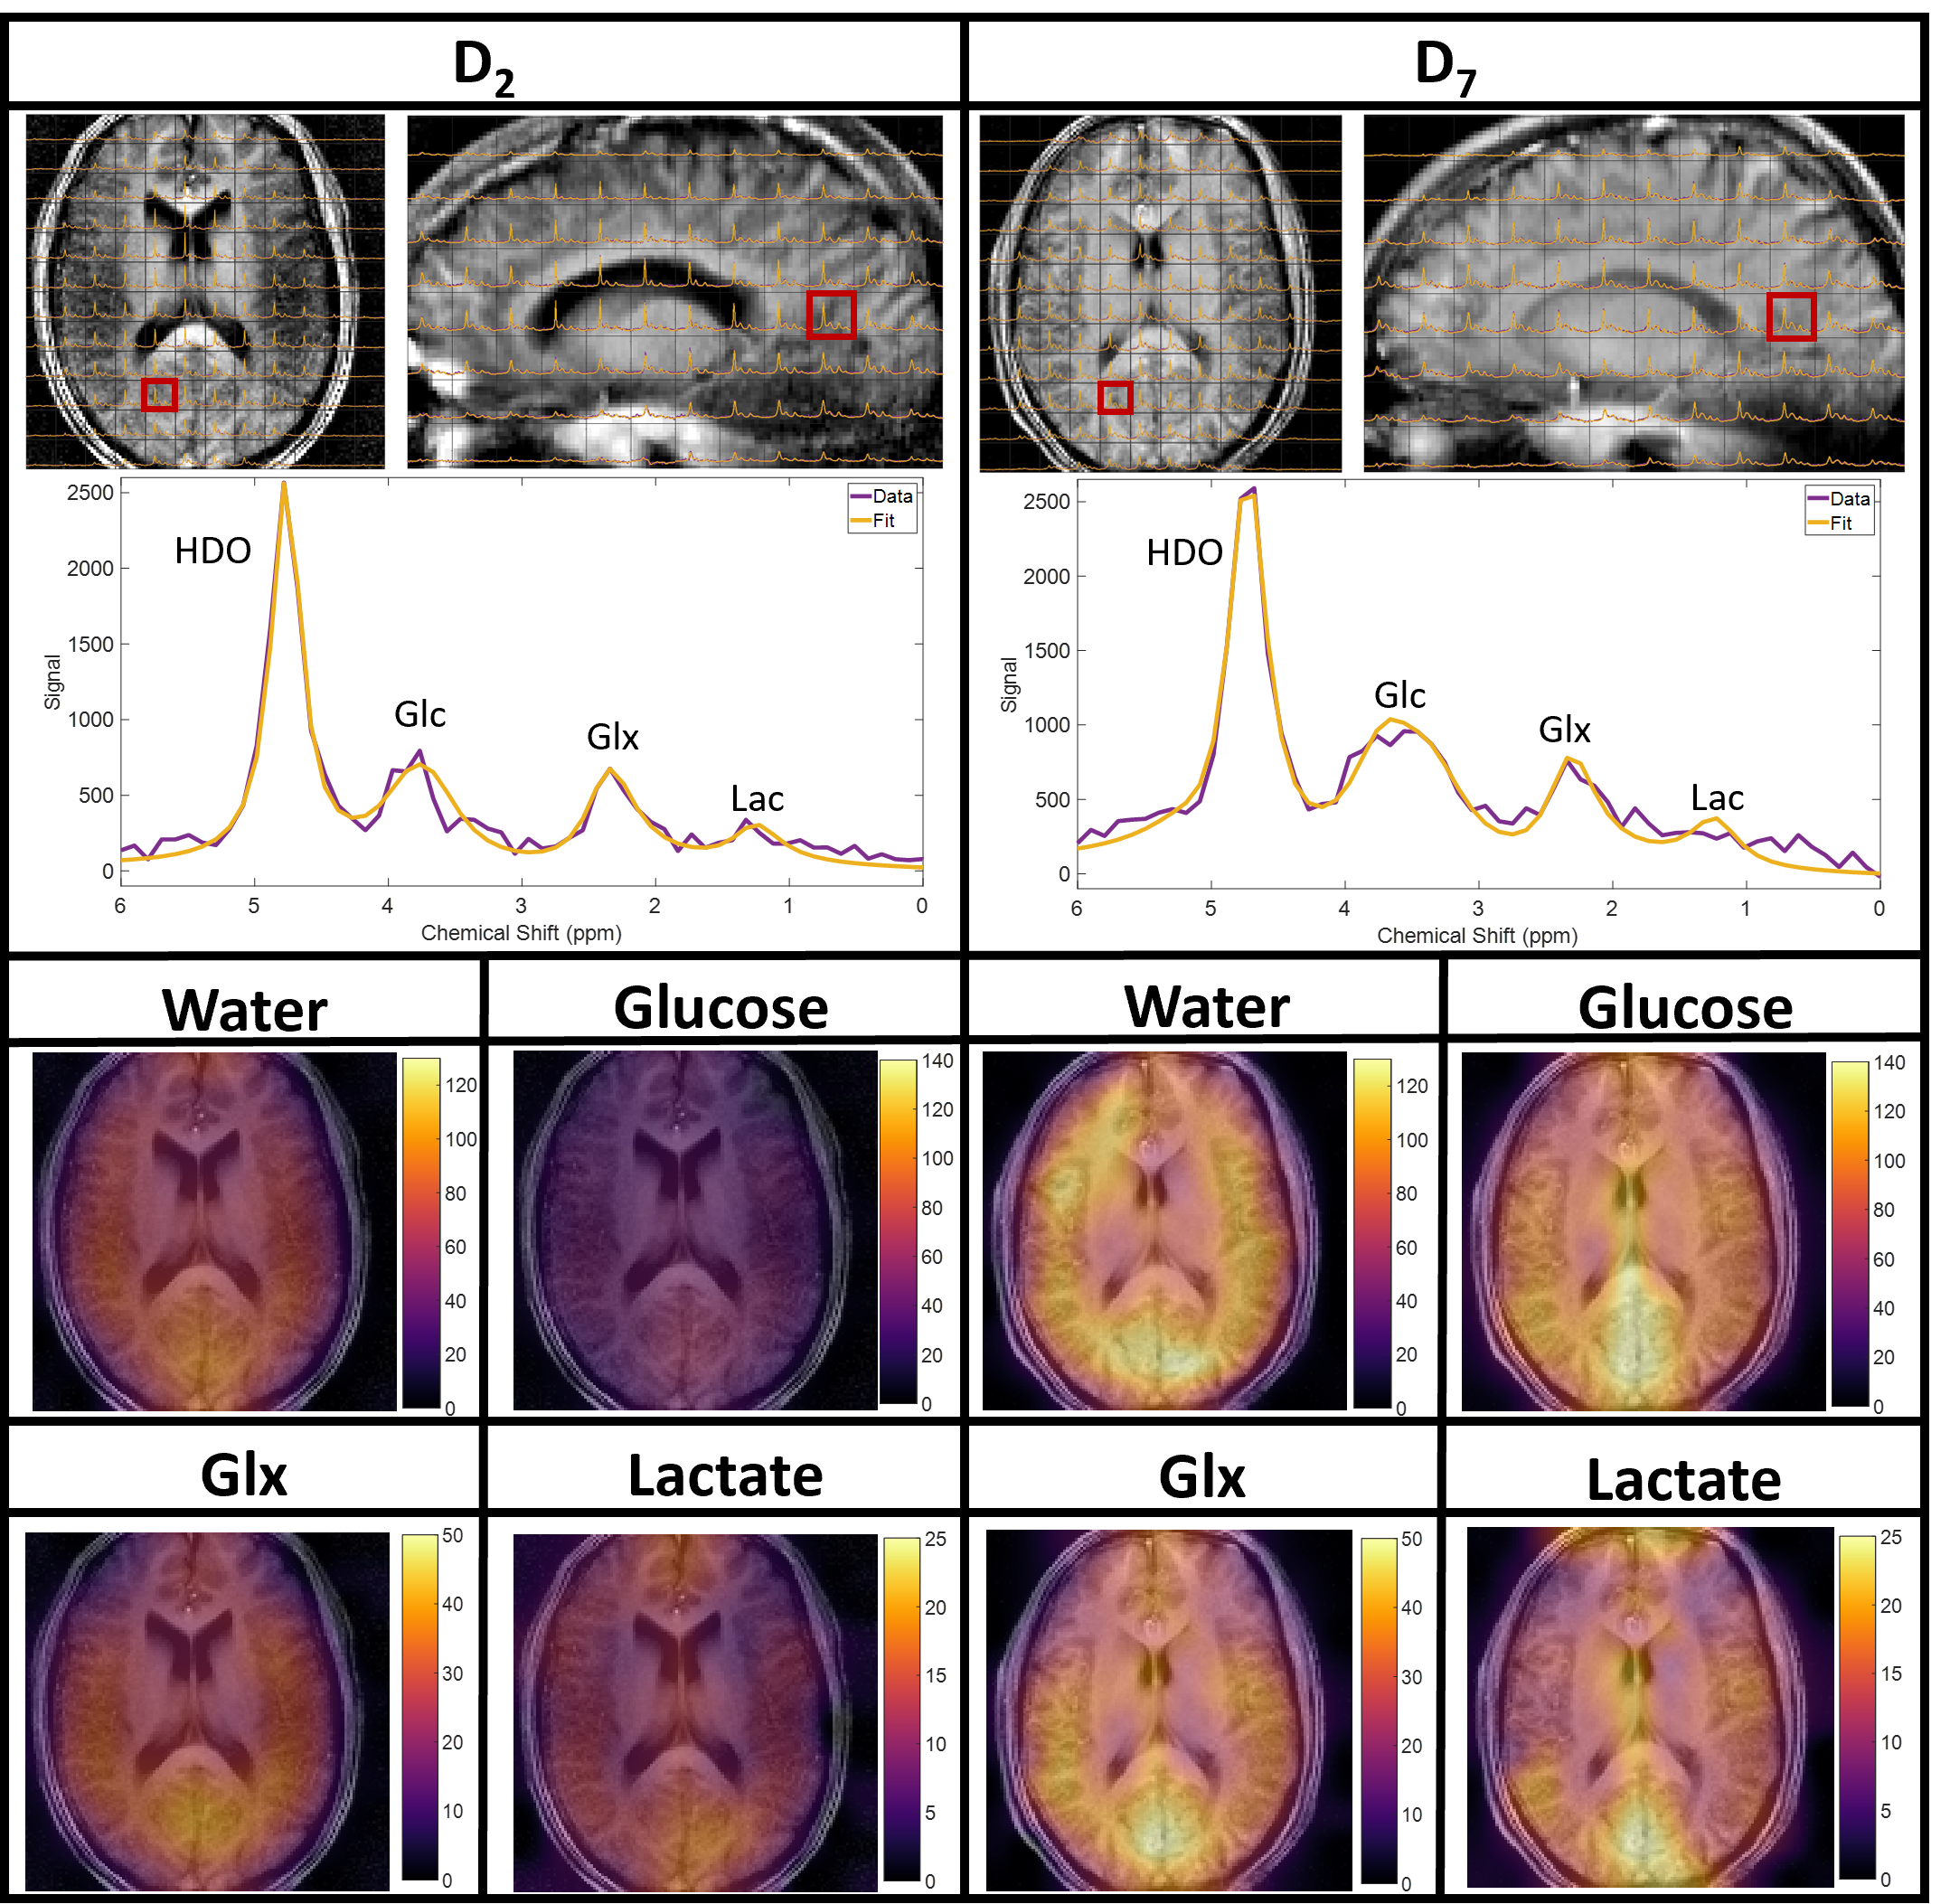
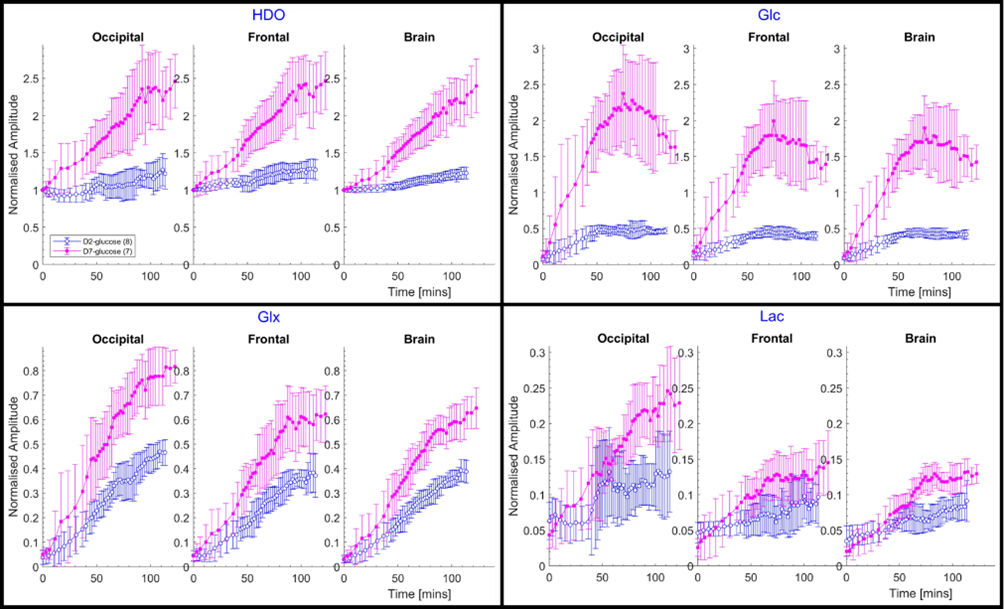
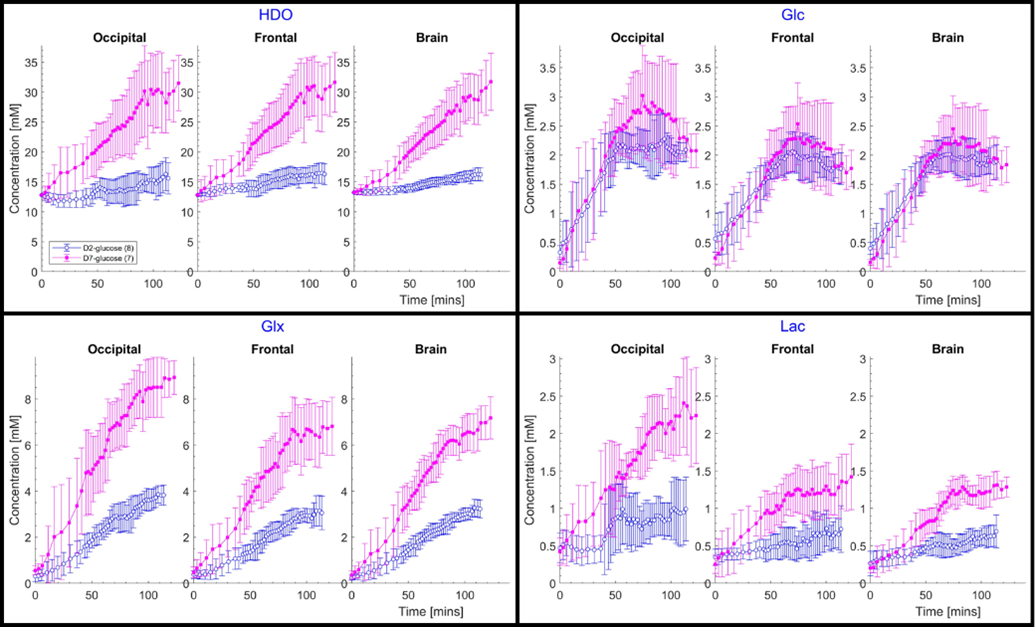
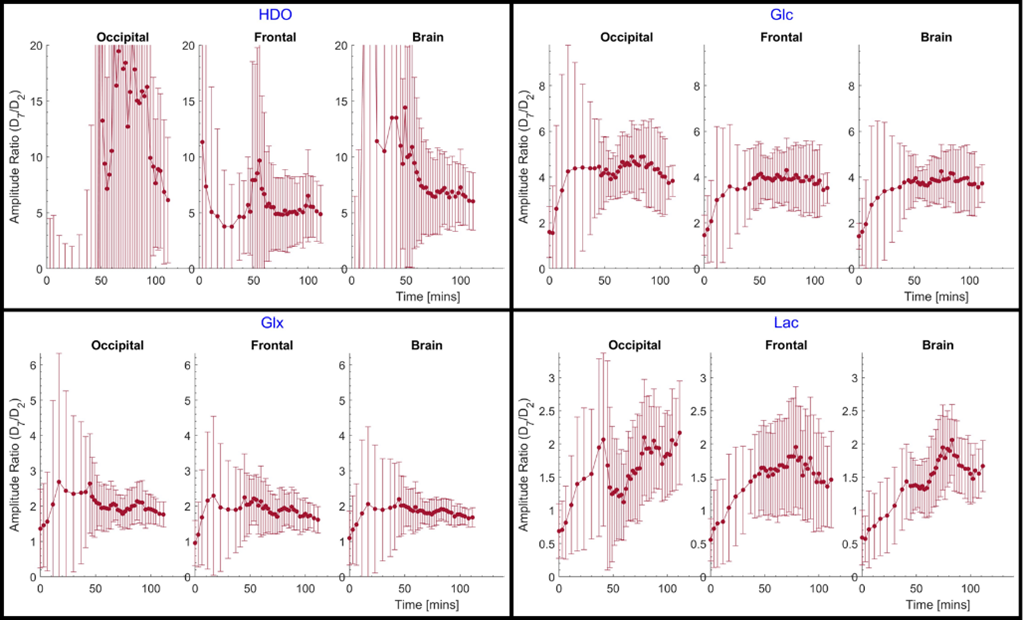
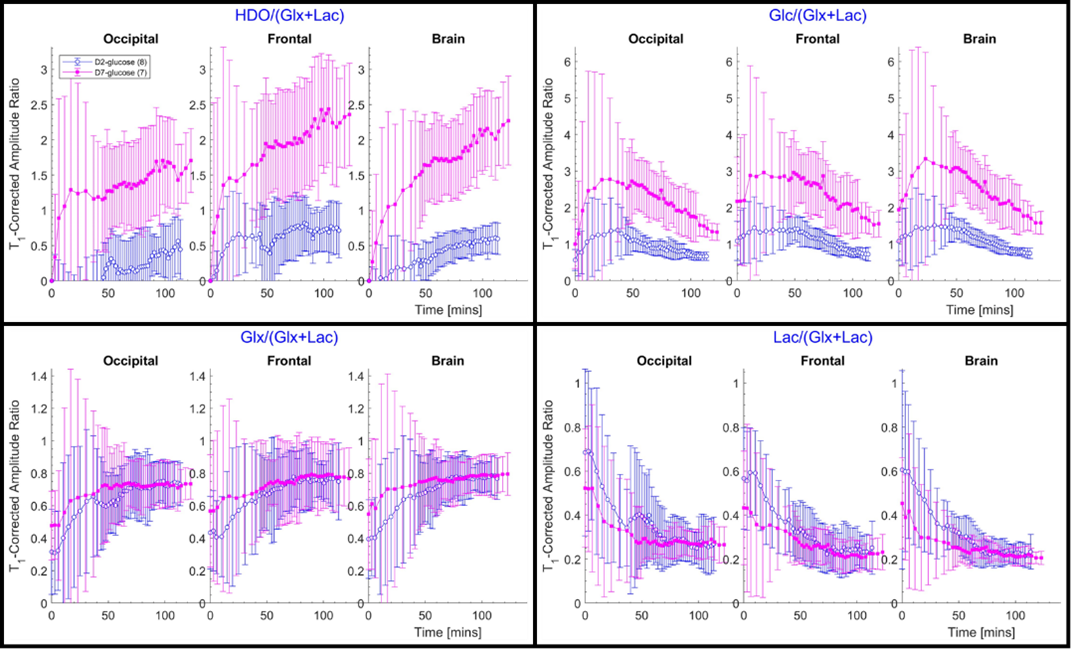
Example CSI data from subjects who ingested D2-glucose or D7-glucose can be seen in Figure 1, along with the metabolite amplitude maps. The signal (normalised to NA HDO) and concentration time-courses averaged over subjects who ingested D2-glucose (blue) or D7-glucose (pink) are shown in Figures 2 and 3 for the different brain regions. The error-bars show the standard deviation over subjects. The ratios of the average signals from D7-glucose and D2-glucose are plotted in Figure 4 (the HDO amplitude used here is the change from natural abundance). The T1-corrected ratios of each metabolite to the sum of downstream metabolites (Glx+Lac) are plotted in Figure 5.Discussion
Figure 1 shows generally increased metabolite amplitudes in images and spectra arising from D7-glucose compared with D2-glucose. These increased signal amplitudes for D7-glucose are more evident in the participant-averaged time-course plots (Figure 2). The averaged concentration time-course data (Figure 3) shows that glucose concentrations in the brain were similar for D2- and D7- glucose, but that as expected more Glc and Lac molecules are produced per D7-glucose molecule. This is confirmed in the plots of ratios of signal amplitudes for D2- and D7-glucose (Figure 4). At late time-points, the ratios for D7/D2 glucose for Glc, Glx and Lac are similar to values predicted using the ratio of the number of relevant 2H labels: 7/2 for glucose, 3/2 for Glx, and Lac (corresponding to number of labels at the C1 and C6 sites)16. Based on label loss estimates, the ratio for HDO is also expected to be approximately 6, as seen.Figure 5 shows metabolite amplitudes normalised by the sum of the glycolysis and TCA cycle products, Glx+Lac. It is interesting to note that at late times, the proportion of Glx is approximately 0.8 for both D2 and D7-glucose. In rat brain, the HDO/ Glx+Lac ratio showed a pseudo-stable value of 2.5 at early times following injection of D7-glucose10, but in healthy human participants, we measure generally lower HDO/(GLx+Lac) values. This may be explained by different weighting of pathways that lead to label-loss.
Acknowledgements
This research was funded by the NIHR Nottingham Biomedical Research Centre and Clinical Research Facilities. DC’s Ph.D. studies are funded by the Precision Imaging Beacon at the University of Nottingham.References
- Lu M, Zhu X-H, Zhang Y, Mateescu G, Chen W. Quantitative assessment of brain glucose metabolic rates using in vivo deuterium magnetic resonance spectroscopy. J Cereb Blood Flow Metab 2017;37(11):3518-3530.
- De Feyter HM, Behar KL, Corbin ZA, Fulbright RK, Brown PB, McIntyre S, Nixon TW, Rothman DL, de Graaf RA. Deuterium metabolic imaging (DMI) for MRI-based 3D mapping of metabolism in vivo. Science advances 2018;4(8):eaat7314.
- De Feyter HM, de Graaf RA. Deuterium metabolic imaging – Back to the future. Journal of Magnetic Resonance 2021;326:106932.
- de Graaf RA, Hendriks AD, Klomp DWJ, Kumaragamage C, Welting D, Arteaga de Castro CS, Brown PB, McIntyre S, Nixon TW, Prompers JJ, De Feyter HM. On the magnetic field dependence of deuterium metabolic imaging. NMR Biomed 2020;33(3):e4235.
- Cocking, D.,et al. , Comparison of Deuterium Metabolic Imaging Measurements in human subjects at 7T following [2H2] glucose and [2H7] glucose ingestion. In Proceedings of the 31st Annual Meeting of ISMRM, 2023, 7027.
- Tucker LR. Some mathematical notes on three-mode factor analysis. Psychometrika 1966; 31: 279–311.
- Bader BW, Kolda TG. Efficient MATLAB Computations with Sparse and Factored Tensors. SIAM Journal on Scientific Computing 2007; 30: 205–231.
- Purvis LAB, Clarke WT, Biasiolli L, Valkovic L, Robson MD, Rodgers CT. OXSA: An open-source magnetic resonance spectroscopy analysis toolbox in MATLAB. Plos One 2017; 12(9):e0185356.
- Vanhamme L, van den Boogaart A, Van Huffel S. Improved method for accurate and efficient quantification of MRS data with use of prior knowledge. Journal of Magnetic Resonance 1997;129(1):35-43.
- Mahar R, Zeng H, Giacalone A, Ragavan M, Mareci TH, Merritt ME. Deuterated water imaging of the rat brain following metabolism of [2H7] glucose. Magn Reson Med. 2021 Jun;85(6):3049-3059. doi:1002/mrm.28700. Epub 2021 Feb 12. PMID: 33576535; PMCID: PMC7953892.
- Zhang Y, Brady M, Smith S. Segmentation of brain MR images through a hidden Markov random field model and the expectation-maximization algorithm. IEEE Trans Med Imaging 2001; 20: 45–57.
- Smith SM. Fast robust automated brain extraction. Hum Brain Mapp 2002; 17: 143–155.
- Jenkinson M, Smith S. A global optimisation method for robust affine registration of brain images. Med Image Anal 2001; 5: 143–156.
- Jenkinson M, Bannister P, Brady M, et al. Improved Optimization for the Robust and Accurate Linear Registration and Motion Correction of Brain Images. Neuroimage 2002; 17: 825–841.
- Andersson J, Smith S, Jenkinson M. FNIRT-FMRIB’s non-linear image registration tool. In: Organization for Human Brain Mapping (OHBM). 2008.
- de Graaf RA, Thomas MA, Behar KL, De Feyter HM. Characterisation of kinetic isotope effects and label-loss in deuterium-based isotopic labelling studies. ACS Chem. Neurosci. 2021;12: 234−243
Figures