3046
Longitudinal Study of the Tissue Sodium Concentration in the Human Liver via Quantitative 23Na MRI at 7T1Medical Physics in Radiology, German Cancer Research Center, Heidelberg, Germany, 2Faculty of Physics and Astronomy, Heidelberg University, Heidelberg, Germany, 3Institute of Radiology, University Hospital Erlangen, Erlangen, Germany, 4Faculty of Medicine, Heidelberg University, Heidelberg, Germany
Synopsis
Keywords: Non-Proton, Liver, X-Nuclei, 23Na MRI, Sodium, Ultrahigh Field, 7T, Tissue sodium concentration
Motivation: A scarcity in literature values for the tissue sodium concentration (TSC) in the healthy liver complicates the evaluation of the TSC in the diseased liver.
Goal(s): This study aimed to establish TSC levels in one healthy liver on multiple days to explore potential concentration variations.
Approach: The TSC was assessed using B1 field corrected and respiratory-sorted quantitative 23Na MRI.
Results: The TSC values obtained in the healthy liver remained stable over a week and aligned with existing literature values.
Impact: The study's finding of a consistent tissue sodium concentration (TSC) over time in one healthy liver is a valuable insight. It indicates that changes in liver TSC might be accurately linked to diseases, which could improve diagnosis of liver diseases.
Introduction
Quantitative 23Na MRI in the human liver may be used as a tool for tumor diagnosis and prognosis, since in tumors the intracellular 23Na concentration is elevated e.g. due to the altered function of the Na+-K+ ATPase, as well as the extracellular volume fraction due to inflammation and necrosis1.Owing to the scarcity of literature values of tissue sodium concentration (TSC) in the healthy liver, it is difficult to evaluate quantitative 23Na MRI, e.g. in tumors, in different subjects, as it is not known how much the healthy liver TSC of an individual differs with time. In this study, the liver TSC of a healthy volunteer is determined on two consecutive days and again after one week to investigate possible changes in the TSC. For more accuracy, the TSC maps are B1-corrected (with a B1+ map determined with a fast mapping sequence with alternating excitation2 and with a simulated B1- map) and respiratory-sorted using an intrinsic respiratory signal to reduce the effects of respiratory motion3.
Methods
All measurements were performed on a 7T whole-body MR scanner4 with a 4-channel oval-shaped 23Na birdcage RF coil3 in a healthy volunteer (female, 34 years old, 85kg), with a total of three examinations conducted at intervals of one day and one week between each other. Examinations were performed on day 1, day 7 and day 8 at the same time of day (~2:30pm). During each examination, first, a DA-3DPR B1+ field mapping sequence (with alternating excitation)2,5 was applied, directly followed by another DA-3DPR sequence5 to acquire the data for TSC mapping.Measurement and reconstruction parameters (B1+ field mapping sequence): TE=1.65ms, FA=45°/90° (alternating), TR=106ms/168ms (alternating), tpulse=3ms, acquired nominal resolution: (20mm)³, number of projections N=1020, golden angle distribution of projections6, acquisition time=4.66min, zero filling factor during reconstruction=4.
Measurement parameters (sequence for TSC mapping): TE=1ms, FA=61°, TR=150ms, tpulse=1.8ms, acquired nominal resolution: (5mm)³, number of projections N=16300, golden angle distribution of projections6, acquisition time=40.75min.
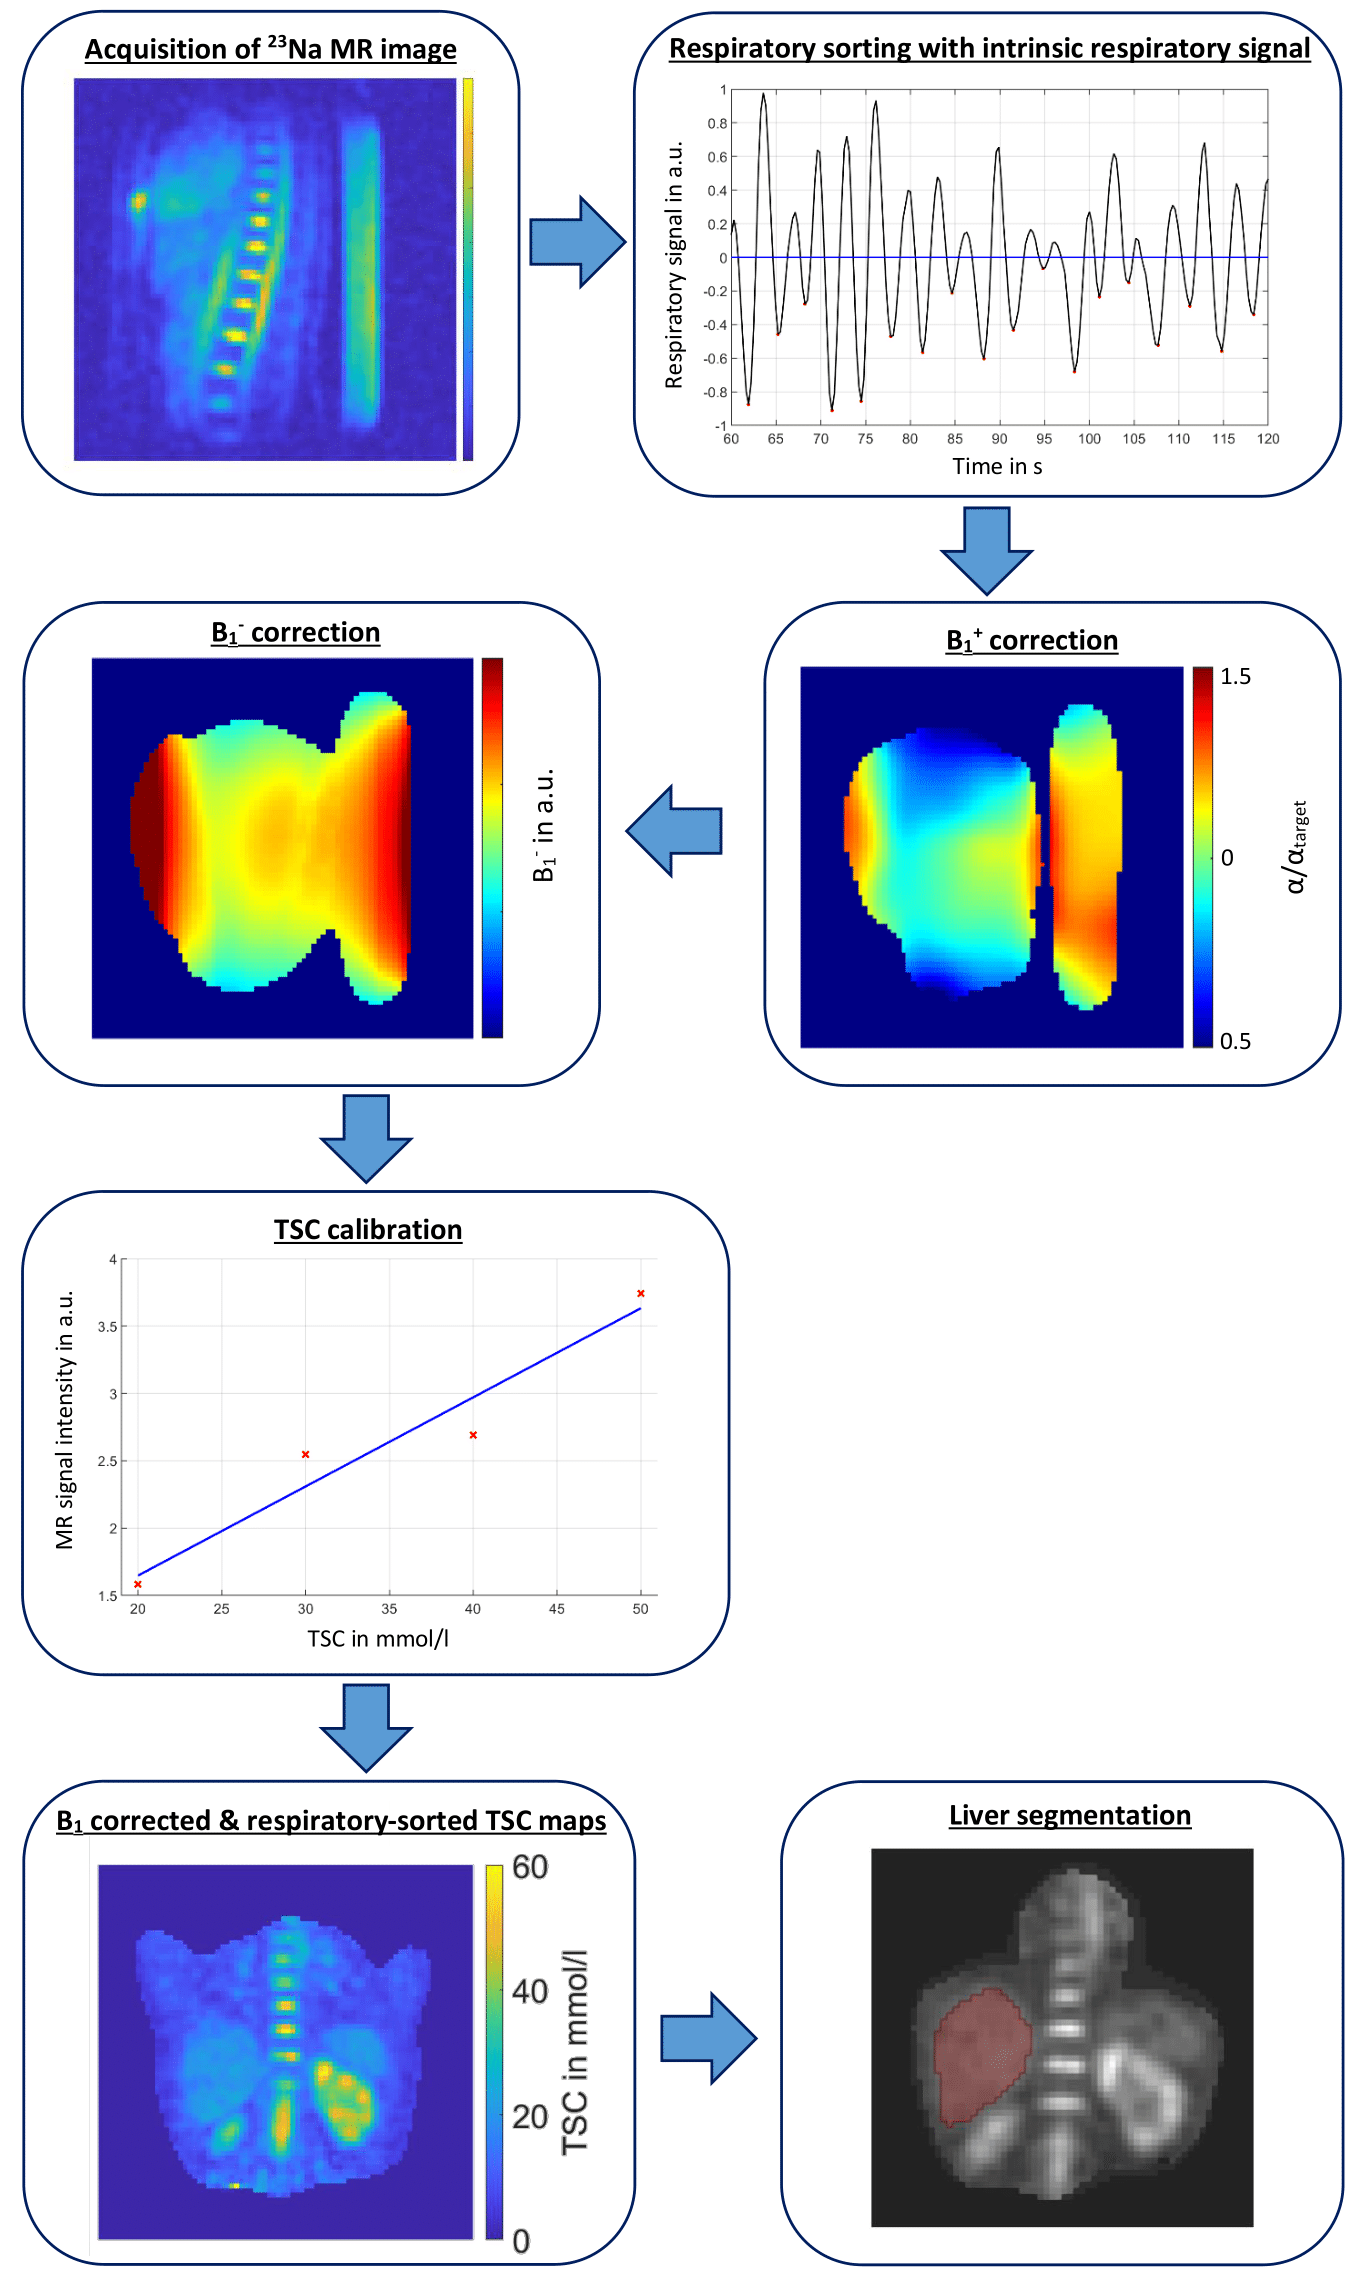
In both sequences, two data points in k-space centre were acquired for each projection that were used to determine an intrinsic respiratory signal3. Using this signal, the data was binned into two respiratory states during post-processing. The MR raw data was reconstructed with a NUFFT7. From the data of the field mapping sequence, relative B1+ maps were determined with the double angle method8, and a B1- map was simulated in a female voxel model9 (scaled to better fit the volunteer's anatomy). The TSC maps were respiratory-sorted and corrected with the B1+ maps, also sorted for respiration, and the simulated B1- maps. Then, a TSC calibration was performed using four external reference vials (containing 20mmol/l, 30mmol/l, 40mmol/l and 50mmol/l NaCl solution) that were placed in a compartment10 under the volunteer inside the RF coil. Subsequently, a 3D mask of the liver was manually segmented to determine the mean TSC and standard deviation in the liver. This workflow is illustrated in Fig. 1.
Results
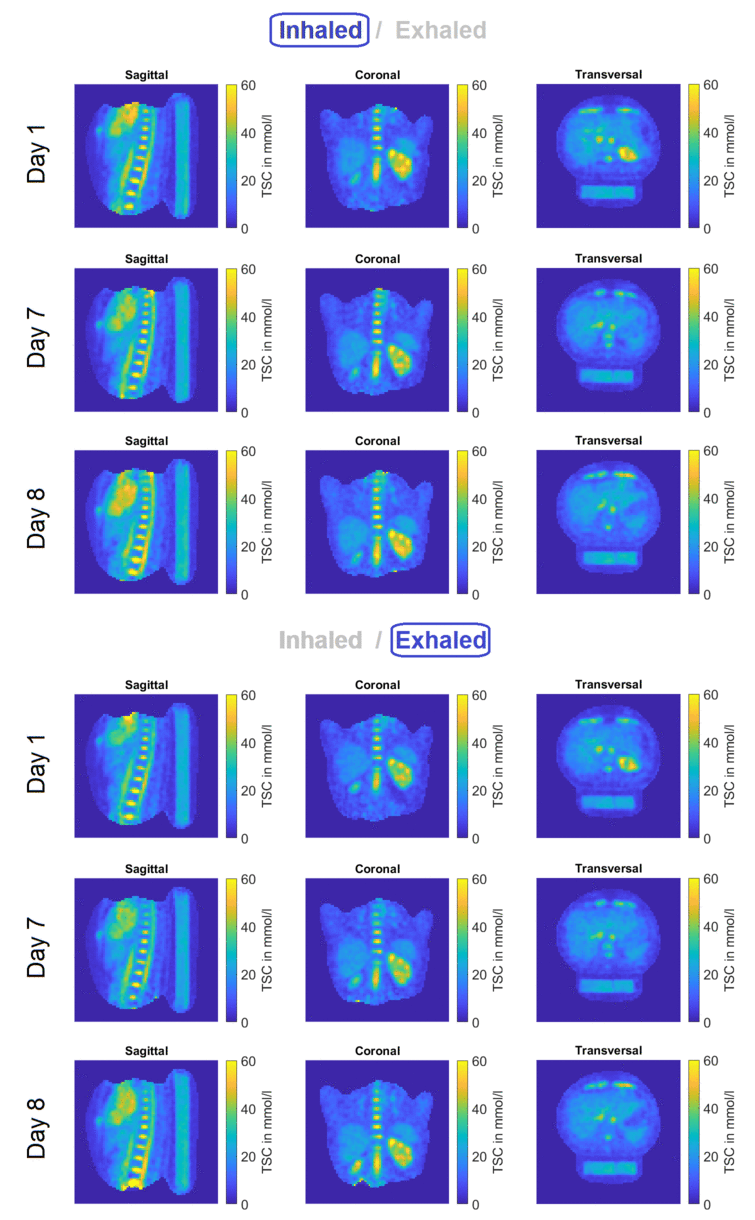
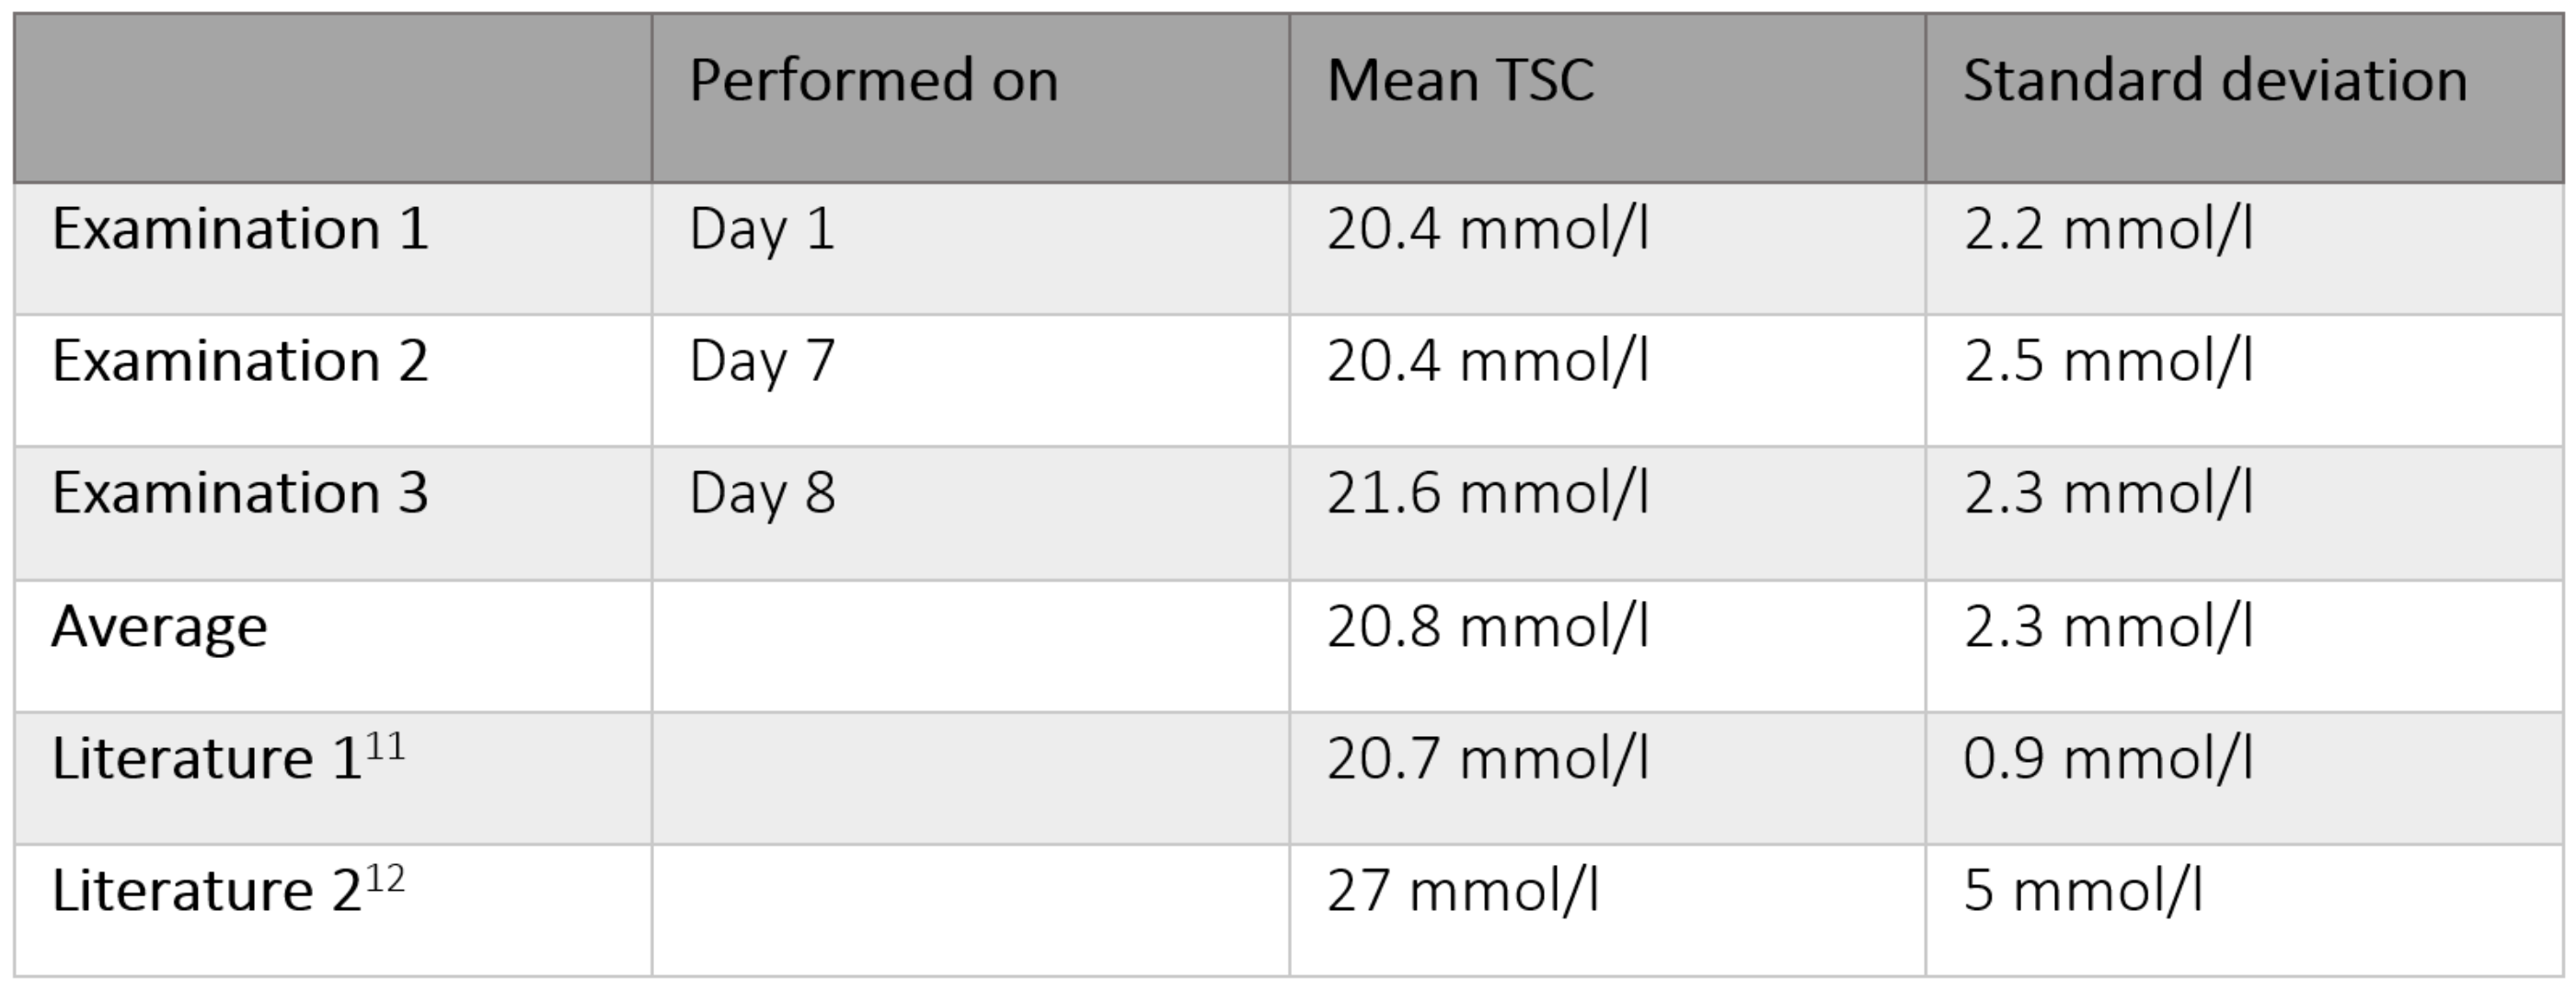
The resulting 3D TSC maps from the different examination days are shown in Fig. 2. The estimated mean TSC in the liver determined from examination 1 was (20.4 ± 2.2) mmol/l, from examination 2 (20.4 ± 2.5) mmol/l and from examination 3 (21.6 ± 2.3) mmol/l (see Table 1). For comparison, Table 1 also shows literature values from two similar studies11,12.Discussion
The resulting estimated TSC means in the healthy liver measured on different days agree very well with each other. Between day 1 and day 7, the estimated mean TSC in the liver is the same and on day 8 it deviates by 1.2 mmol/l, which is within one standard deviation of the other values. These preliminary results suggest that the TSC in this healthy liver is stable over time and not subject to large changes within one week. Despite slight variations in measurement sequences and correction methods, consistent TSC levels in the healthy liver of approximately 20 to 30 mmol/l were found across three studies11,12, including this one, which can serve as a valuable reference point for future research on liver diseases, such as e.g. cancer. In order to be able to link changes in liver TSC to diseases instead of to fluctuations in the healthy liver, it is advisable to investigate the liver TSC over a longer period of time within a larger and more diverse cohort of healthy individuals, including subjects of varying ages and sexes. It is also possible that the liver TSC might show daytime variations, as it was recently shown in the kidneys13.Acknowledgements
No acknowledgement found.References
1. Gast LV, Platt T, Nagel AM, et al. Recent technical developments and clinical research applications of sodium (23Na) MRI. Progress in Nuclear Magnetic Resonance Spectroscopy 138-139; 1-51 (2023)
2. Felz J, Kratzer FJ, Nagel AM, et al. Development of a Pulse Sequence with Alternating Excitation for Respiratory-Sorted B1+ and B0 Field Mapping in 23Na Human Torso MRI. In: Proc. Intl. Soc. Mag. Reson. Med. 31: 3041 (2023)
3. Platt T, Umathum R, Fiedler T, et al. In vivo self-gated 23Na MRI at 7T using an oval-shaped body resonator. Magn. Reson. Med. 2018;80:1005–1019 (2018)
4. MAGNETOM 7T, Siemens Healthcare, Erlangen, Germany
5. Nagel AM, Laun FB, Weber MA, et al. Sodium MRI Using a Density-Adapted 3D Radial Acquisition Technique. Magnetic Resonance in Medicine 62:1565–1573 (2009)
6. Chan RW, Ramsay EA, Cunningham CH, Plewes DB. Temporal stability of adaptive 3D radial MRI using multidimensional golden means. Magn. Reson. Med., 61: 354-363. (2009)
7. Fessler JA, Sutton BP. Nonuniform fast Fourier transforms using min-max interpolation. IEEE Transactions on Signal Processing, vol. 51, no. 2, pp. 560-574, Feb. 2003 (2003)
8. Insko EK, Bolinger L. Mapping of the Radiofrequency Field. Journal of Magnetic Resonance. Series A 103, 82-85 (1993)
9. CST Studio Suite 2021, Dassault Systèmes, Vélizy-Villacoublay, France
10. Scheipers AK, Nagel AM, Ruck L, et al. Quantitative sodium MRI of the human kidneys at 7T – Before, during and after water load via sliding window evaluation. In: Proc. Intl. Soc. Mag. Reson. Med. 31: 7691 (2023)
11. James JR, Panda A, Lin C, et al. In vivo sodium MR imaging of the abdomen at 3T. Abdominal Imaging 40, 2272–2280 (2015)
12. Lott J, Behl NGR, Nagel AM, et al. Quantitative 23Na MRI of the human liver at 7 Tesla. In: Proc. Intl. Soc. Mag. Reson. Med. 27: 0487 (2019)
13. Rasmussen CW, Bøgh N, Ringgaard S, et al. Daytime Variation in Kidney Perfusion, Oxygenation, and Sodium Concentration Assessed by Multiparametric MRI in Healthy Volunteers. J. Mag. Reson. Imaging (2023)
Figures