3045
Energetic Metabolism during Preclinical Migraine Measured by 31P Spectroscopy at 21.1 T1Center for Interdisciplinary Magnetic Resonance, National High Magnetic Field Laboratory, Tallahassee, FL, United States, 2Chemical & Biomedical Engineering, Florida State University, Tallahassee, FL, United States
Synopsis
Keywords: Non-Proton, Metabolism, Migraine, 31P Spectroscopy, Preclinical, Central Sensitization, Ultra-high field
Motivation: Migraine is a disorder of neuronal hyperexcitability, but previous work has not been able to capture energetic processes non-invasively during active central sensitization, only after or between migraine attacks.
Goal(s): This preclinical study evaluates whole brain energetic metabolism and remodeling during a nitroglycerin-induced migraine attack.
Approach: 31P spectroscopy using ISIS was used to measure phosphocreatine and ATP levels at baseline and then over a 3-hour period post-NTG administration.
Results: Most notable is the increase in phosphocreatine compared to baseline and controls, as well as an increase in ATP compared to baseline. Both indicate energetic remodeling during central sensitization prior to migraine pain onset.
Impact: Increased phosphocreatine and ATP over the entire brain demonstate significant energetic fluxes during cerebral central sensitization and prior to nociception. This energetic remodeling informs understanding of fundamental migraine pathophysiology and its timing, potentially impacting the administration of potential clinical interventions.
Introduction
Migraine is widely considered a neurological disorder with hyperexcitability as a key component universally present for all migraineurs. With an increase in neuronal firing, there must also be an alteration in energy use and metabolism. Ultra-high field 31P magnetic resonance spectroscopy (MRS) allows for the study of phosphorylated compounds related to energy metabolism, such as ATP and phosphocreatine (PCr). Many of these compounds cannot be resolved by 1H spectroscopy due to low relative concentrations or because they resonate at similar frequencies on the 1H spectrum. This study is a novel temporal assessment of dysfunctional energetic metabolism using preclinical 31P MRS during the onset and progression of central sensitization related to migraine that seeks to establish windows for the energetic remodeling that may occur as a result of migraine pathophysiology.Methods
Animal: Female Sprague Dawley rats were assigned to an nitroglycerin (NTG) group (N=3) or a saline control group (N=3). Animals were anesthetized, an intraperitoneal (IP) infusion line was implanted, and they were loaded into the 21.1-T magnet. Three, 20-min baseline scans were acquired before NTG (10 mg/kg) or saline (equivalent volume) administration, followed by six scans post-infusion, totaling 3 h.MR: The 900-MHz, 21.1-T vertical scanner at the US National High Magnetic Field Laboratory in Tallahassee, Florida was utilized to acquire high-resolution phosphorus spectra using Image Selective In vivo Spectroscopy (ISIS). A dual-resonance 31P saddle -1H birdcage coil was used for this study. The voxel size was 12 x 16 x 8 mm, which covers almost the entire rat brain to achieve better signal-to-noise ratios in a 20-min scan (Fig. 1). Respiratory gating was performed to reduce fluctuations due to motion. With a 5-s repetition time, 30 averages and 240 ISIS averages were acquired over a single 20-min scan. A 60-μs block pulse was used for excitation, with a 2-ms calculated pulse for inversions, to achieve a large bandwidth to cover all 31P metabolites.
Processing: Spectra were exported to Topspin 4.1.4 for processing. Exponential line broadening applied with 55 Hz. Metabolites of interest included phosphocreatine (PCr) and α-, β-, γ-adenosine triphosphate (α-, β-, γ-ATP). Percent changes are reported. Statistical analysis were performed with JMP 17 Pro using a mixed model analysis and residual repeated covariance structure. Tukey’s HSD multiple comparisons test was used to determine the timepoint significances between experimental and control groups (#) and compared to baseline (*), reported at p<0.05.
Results and Discussion
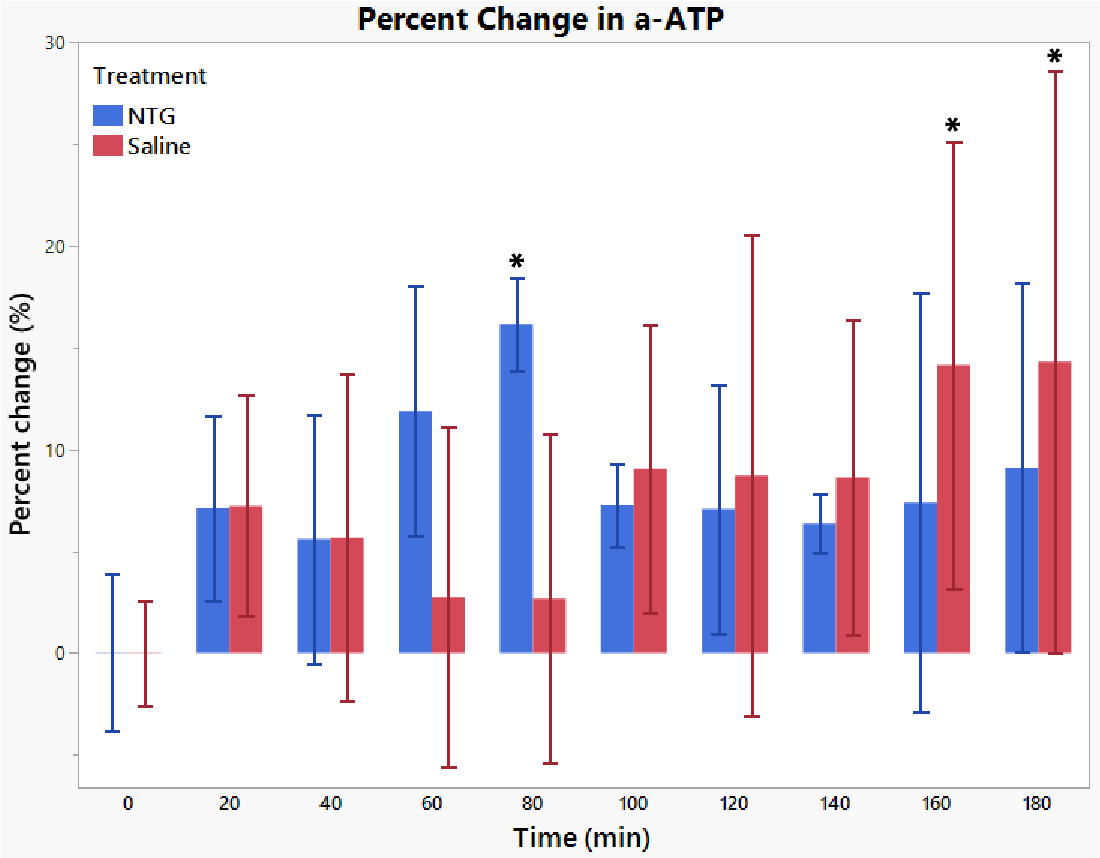
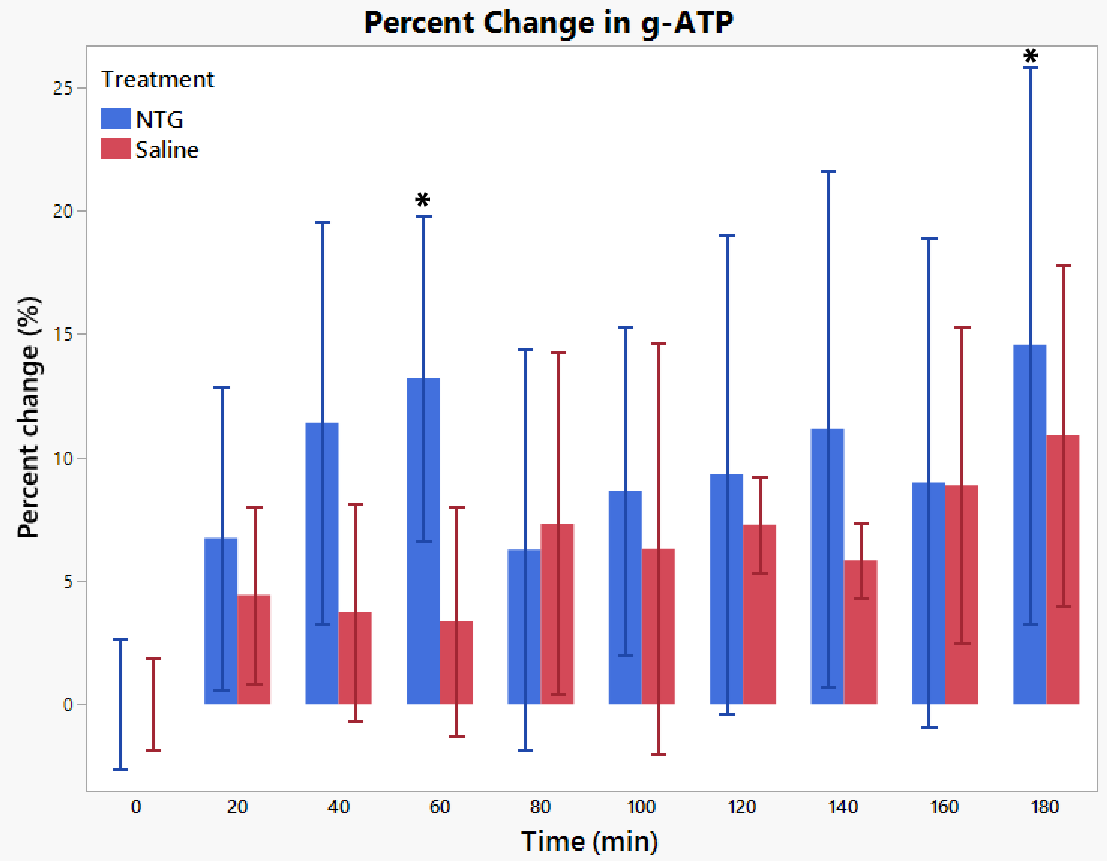
PCr was significantly increased by a maximum of 13% compared to the baseline and saline control group (Fig. 2). Most studies have found that migraineurs have decreased interictal PCr in the occipital lobe using 31P MRS.1,2 However, this study encompasses the whole brain and shows the ictal effects during the progression of NTG-induced central sensitization rather than between attacks. Studies in muscle have found an overshoot in PCr post-exercise that co-occurs with undershoot in free ADP and increased acidosis3; further analysis of 31P spectra for free ADP and pH levels is underway.For the NTG group, ATP seems to increase initially until a peak at 60-80 min (13% at 60 min for γ-ATP and 16% at 80 min for α-ATP) and then quickly drops off (Fig. 3 & 4). Meanwhile, the saline group seems to have a steady increase in ATP, likely from anesthetic effects. PCr also sees a transient increase at 80 min (11%). This trend seems counterintuitive as an increase in ATP synthesis should be coupled with a decrease in PCr.
Because this study is evaluating whole-brain 31P fluxes, including those originating from fluid compartments, PCr and ATP increases may reflect increased transport of creatine or PCr into the brain, facilitating faster recovery of ATP. Focusing on particular gray matter regions of interest may show localized decreases PCr.
Conclusion
This study found significantly increased PCr and ATP during the onset and progression of preclinical migraine. This counterintuitive trend may be due to increased PCr flux into the whole brain rather than a tissue-specific effect. Although animal numbers are low, these results are promising and increasing cohort size may reveal greater detail and reduce variation. Additionally, localized evaluation of regions of interest, such as the occipital lobe, thalamus and brainstem, will allow for further analysis of migraine-specific energetic mechanisms.We plan to develop this work further by quantifying absolute concentrations of metabolites and exploring MRSI techniques to probe differential energetic metabolism across the brain during migraine-related central sensitization. By providing temporal characteristics of energetic substrate fluxes, this work will help profile homeostatic conditions and their alteration during migraine progression. This knowledge can impact the development and timing of potential clinical interventions.
Acknowledgements
This work is supported by the US NIH (RO1-NS072497) and conducted at the National High Magnetic Field Laboratory, which is funded by the National Science Foundation (DMR-1644779) and the State of Florida. This work was conducted in accordance with the Florida State University’s Animal Care and Use Committee.References
[1] Nikolova S, Schwedt TJ. Magnetic resonance spectroscopy studies in migraine. Neurobiol Pain. 2022.
[2] Reyngoudt H, Paemeleire K, Descamps B, De Deene Y, Achten E. 31P-MRS demonstrates a reduction in high-energy phosphates in the occipital lobe of migraine without aura patients. Cephalalgia. 2011.
[3] Zoladz JA, Korzeniewski B, Kulinowski P, Zapart-Bukowska J, Majerczak J, Jasiński A. Phosphocreatine recovery overshoot after high intensity exercise in human skeletal muscle is associated with extensive muscle acidification and a significant decrease in phosphorylation potential. J Physiol Sci. 2010.
Figures
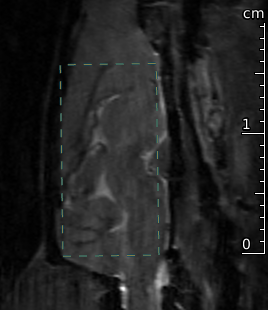
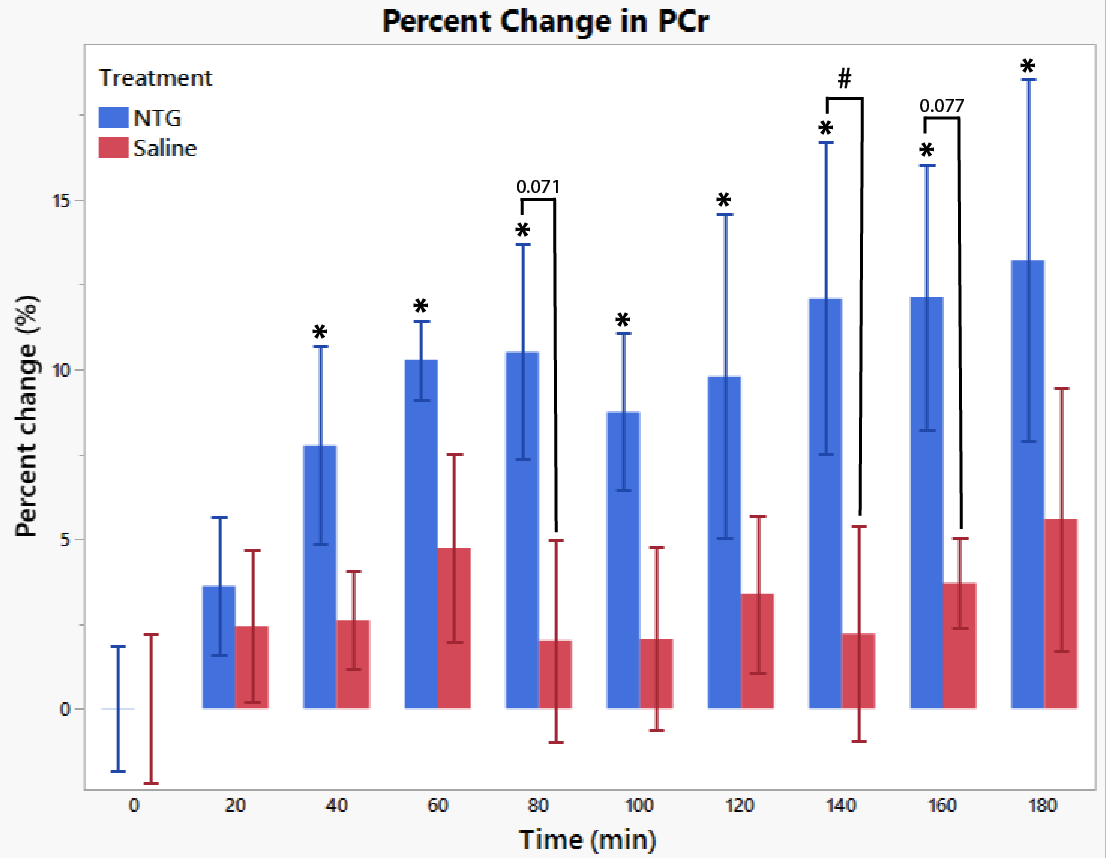
Figure 2: Percent change in PCr compared to baseline over time. Error bars indicate one standard deviation from the mean. Significances are reported between experimental and control groups (#) and compared to baseline (*), p<0.05.