3044
In vivo imaging of cerebral glucose metabolism of GLP-1R knockout mice with deuterium magnetic resonance spectroscopy1Shanghaitech, Shanghai, China
Synopsis
Keywords: Deuterium, Deuterium, FDG-PET
Motivation: The regulation of brain glucose metabolism by GLP1-1R has not been fully verified.
Goal(s): To explore feasibility of dynamic DMRS in mice brain, and the physiological role of GLP-1R in mouse brain glucose metabolism.
Approach: we apply DMRS and FDG-PET to quantify dynamic cerebral glucose change, and combine with rs-fMRI to investigate changes in whole-brain functional connectivity.
Results: GLP-1R KO mice exhibit impaired brain glucose metabolism and central nervous system intolerance to high doses of exogenous glucose. And the functional brain connectivity in GLP-1R KO mice was significantly lower than that in WT group.
Impact: The decline in functional connectivity may hinder the coordination of work and information transmission between brain regions, thus inhibit normal metabolic regulatory processes. These findings provide a theoretical basis for the treatment strategies of disorders related to brain glucose metabolism
Background
Glucagon-like peptide-1 (GLP-1) and its receptors (GLP-1R) play an important role in regulating blood sugar and maintaining energy homeostasis. Recently, GLP-1R have been considered potential targets for the treatment of disorders related to glucose metabolism in the brain1,2. Deuterium magnetic resonance spectroscopy (DMRS) is a non-invasive, radiation-free technique based on magnetic resonance which can provide quantitative information about neural metabolism and map brain metabolic flux3,4. To explore the physiological role of GLP-1R in mouse brain glucose metabolism, we applied two complementary imaging techniques, DMRS and fluorodeoxyglucose (FDG) positron emission tomography (PET) in GLP-1R knockout mice (GLP-1R KO) and wild-type C57BL/6N (WT) mice.Methods
Based on a 9.4-tesla ultra-high-field magnetic resonance imaging (MRI) system with a PET insert, the metabolic dynamics of GLP-1R KO and WT mice were continuously collected before and after [6,6]-2H2 glucose injection while using DMRS, and, in a separate cohort, glucose uptake measured with FDG PET. In addition, rest state-functional MRI was performed on both groups to compare brain functional connectivity against the result of DMRS.Results
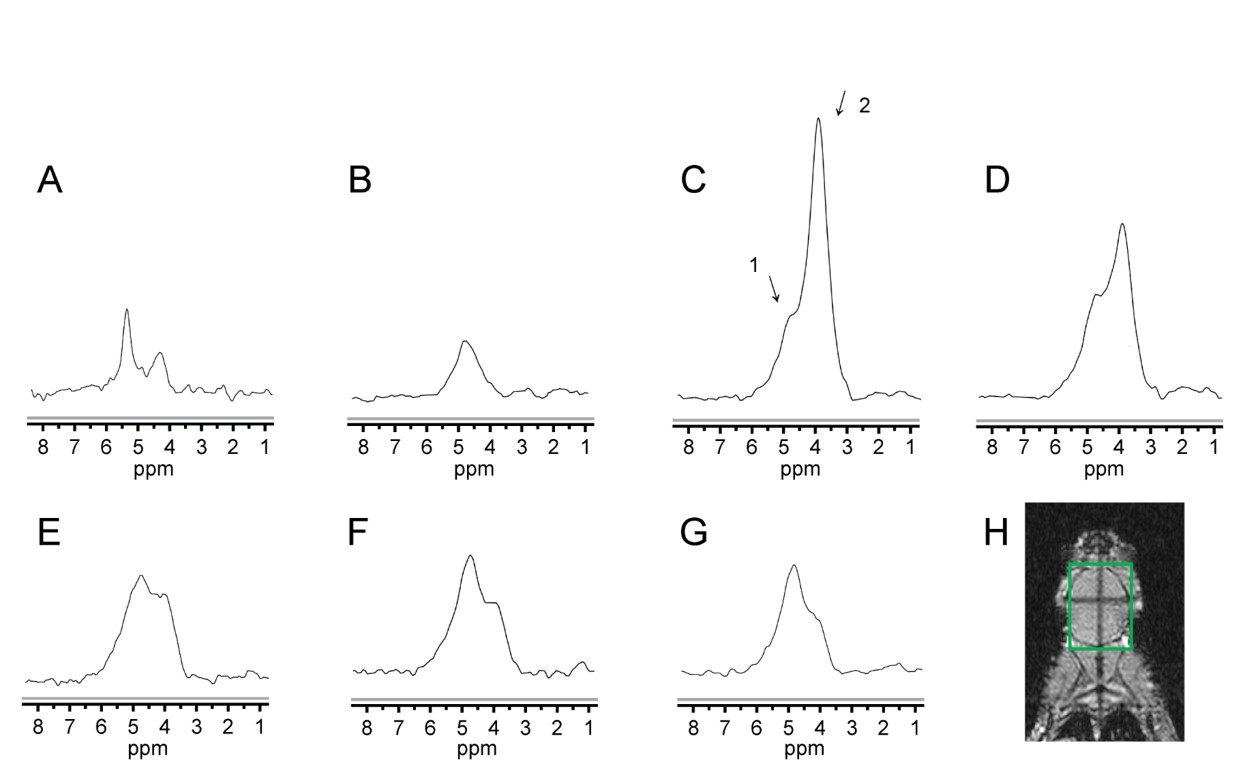
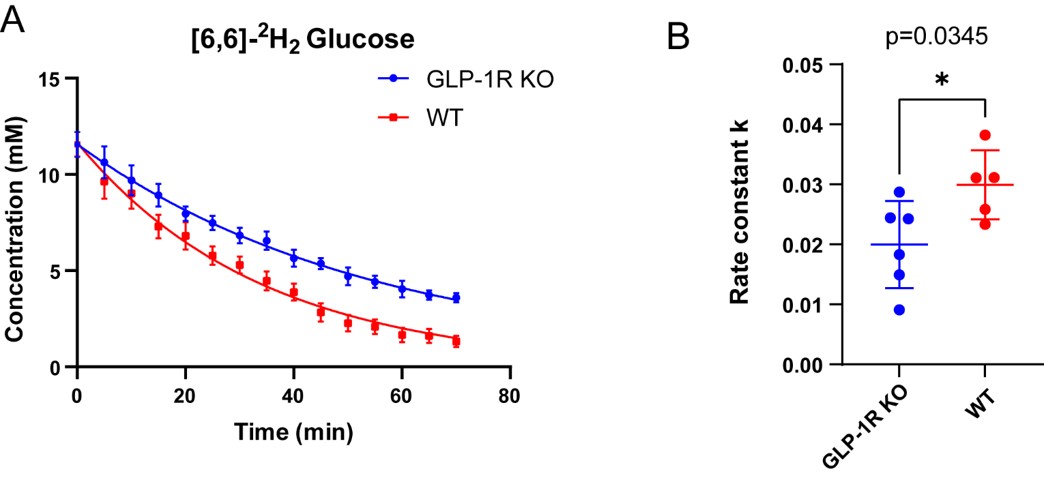
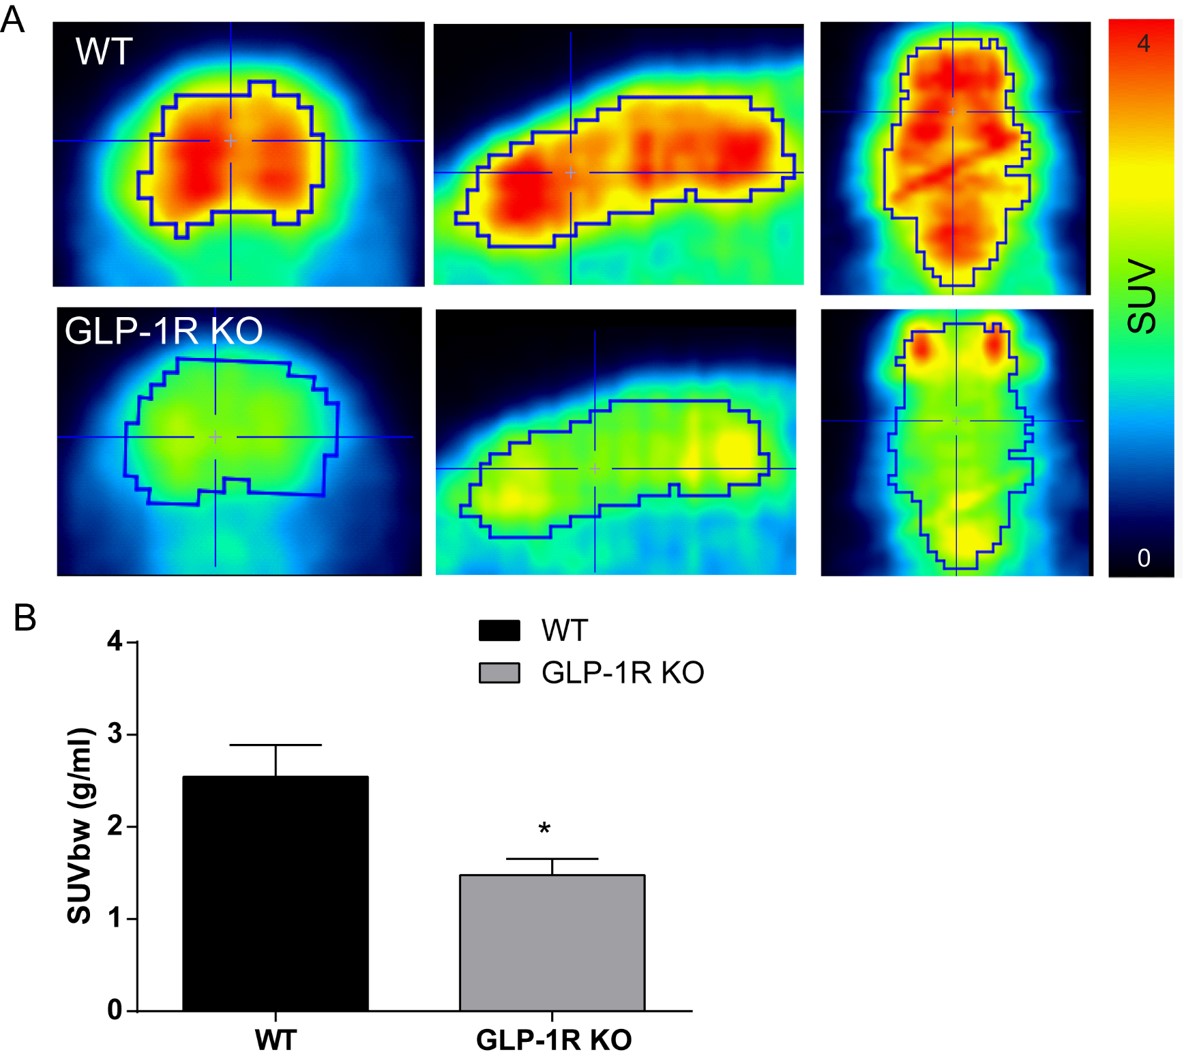
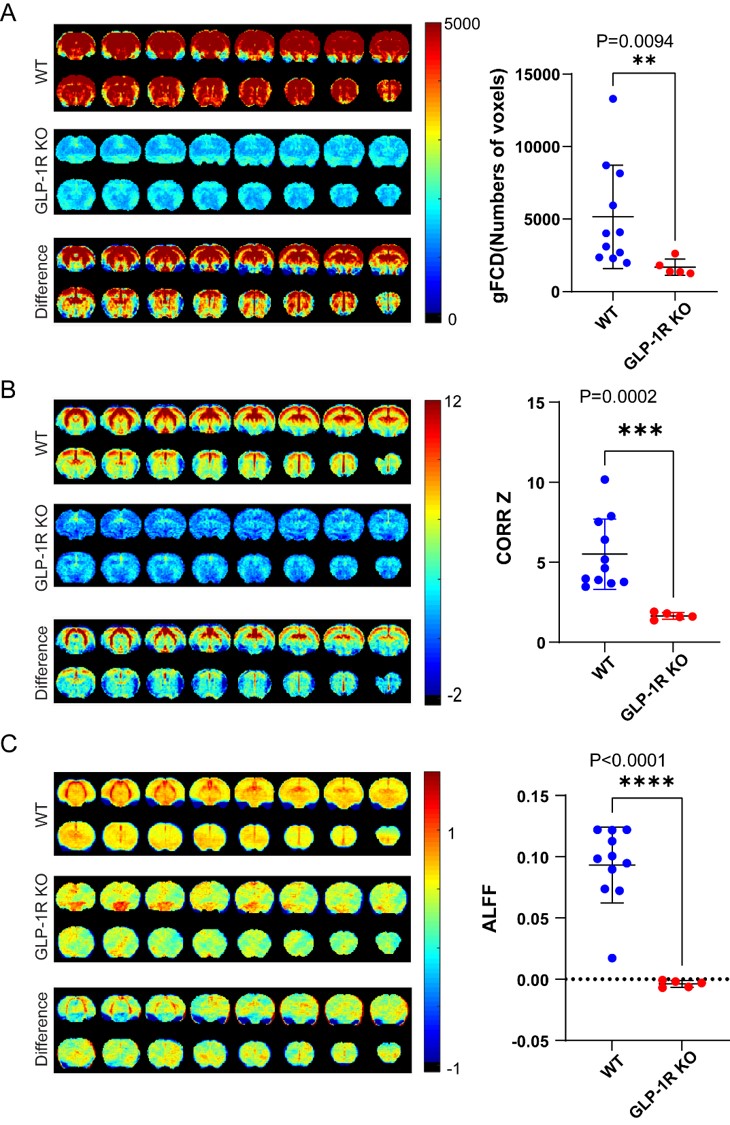
The metabolic rate[GT1] of GLP-1R KO mice was significantly slower than that of WT mice (p=0.035, WT mice 0.02335±0.057 mM/min, GLP-1R KO mice 0.01998±0.07 mM/min)(Figure 1 and 2). Quantification of the mean [18F]FDG signal in the whole brain also showed significantly reduced glucose uptake in GLP-1R KO mice versus control mice (p=0.025) (Figure 3). Observing rs-fMRI, the functional brain connectivity in GLP-1R KO mice was significantly lower than that in WT group[GT2] (p= 0.0094 for gFCD, p=0.0002 for whole-brain correlation, p<0.0001 for ALFF) (Figure 4). [GT1]Please look up the name for this specific metabolic rate, which step is it we are measuring in the metabolic cycle? [GT2]List p value if you also list it for the previous two methodsConclusion
We found that GLP-1R KO mice exhibit impaired brain glucose metabolism and central nervous system intolerance to high doses of exogenous glucose. GLP-1R KO mice have reduced glucose metabolism combined with reduced functional connectivity, a correlation also observed in human studies. This suggests that the GLP-1R KO mouse model may serve as a model for correlated metabolic and functional connectivity loss. In addition, our results validate DMRS as a preclinical in-vivo method with good correspondence to existing PET and fMRI-based methods.Acknowledgements
This work was supported by the National Natural Science Foundation of China Grant.References
1. Gejl M, Rungby J, Brock B, et al., 2014. At the Centennial of Michaelis and Menten, Competing Michaelis–Menten Steps Explain Effect of GLP-1 on Blood–Brain Transfer and Metabolism of Glucose[J]. Basic & Clinical Pharmacology & Toxicology, 115 (2): 162-171.
2. Burmeister M A, Ayala J, Drucker D J, et al., 2013. Central glucagon-like peptide 1 receptor-induced anorexia requires glucose metabolism-mediated suppression of AMPK and is impaired by central fructose[J]. American Journal of Physiology. Endocrinology and Metabolism, 304 (7): E677-685.
3. De Feyter H M, Behar K L, Corbin Z A, et al., 2018. Deuterium metabolic imaging (DMI) for MRI-based 3D mapping of metabolism in vivo[J]. Science Advances, 4 (8): eaat7314.
4. De Feyter H M, de Graaf R A, 2021. Deuterium metabolic imaging – Back to the future[J]. Journal of Magnetic Resonance, 326: 106932.
Figures