3043
The SNR-Optimal Sodium MRI Encoding1GE HealthCare, München, Germany, 2GE HealthCare, Copenhagen, Denmark, 3Aarhus University, Aarhus, Denmark
Synopsis
Keywords: Non-Proton, Non-Proton
Motivation: Motivation is to unleash the clinical potential of sodium (23Na) MRI.
Goal(s): Main goal is to answer the key question about what the optimal sequence encoding is?
Approach: 3D sodium sampling schemes were designed, implemented and compared in simulations and experimentally in the human brain and porcine abdomen.
Results: (1) While encoding schemes differ in sampling efficiency, 15ms-Density-Adapted Radial is SNR optimal.
(2) Clinically reasonable acquisition parameters are: total scan time ~10min., nominal matrix size=803, readout duration=15ms, TR=30ms, flip angle=60°.
Impact: Sodium MRI holds great clinical potential for diagnosing and monitoring of stroke, cancer, etc. Devising and comparing the optimal acquisition will help the sodium field to improve SNR, hence facilitating clinical studies and adoption.
Introduction
Sodium (23Na) MRI enables direct and quantitative examination of tissue viability, cell integrity and function. The acquired biochemical information has great potential in diagnosing diseases, monitoring disease progression and treatment response [1]. The natural abundance of 23Na is 100% with a nuclear spin quantum number of 3/2, leading to a quadrupolar moment with short T1/T2 relaxation times, and a bi-exponential decay in tissue with short and long T2 components with a ~60:40 ratio [2]. T1/T2 times are similar in different tissue types, but values vary greatly in between publications [1]. Average tissue values of T1=30ms, T2short=2.5ms and T2long=16ms were used in simulations and parameter optimisation. Saline (CSF) exhibits longer relaxation times but is of limited clinical interest, hence focus here is on tissue.Sodium MRI is signal-to-noise ratio (SNR) limited, hence restricting achievable resolution. Overall scan time needs to be long to gain SNR via averaging. Thus, main optimisation objective is to improve SNR and not reduce scan time. Several approaches for imaging sodium were developed over the years [1,4-6], posing a challenge for researcher to choose the best one. The aim here was to optimise, implement and compare different k-space sampling schemes.
Methods
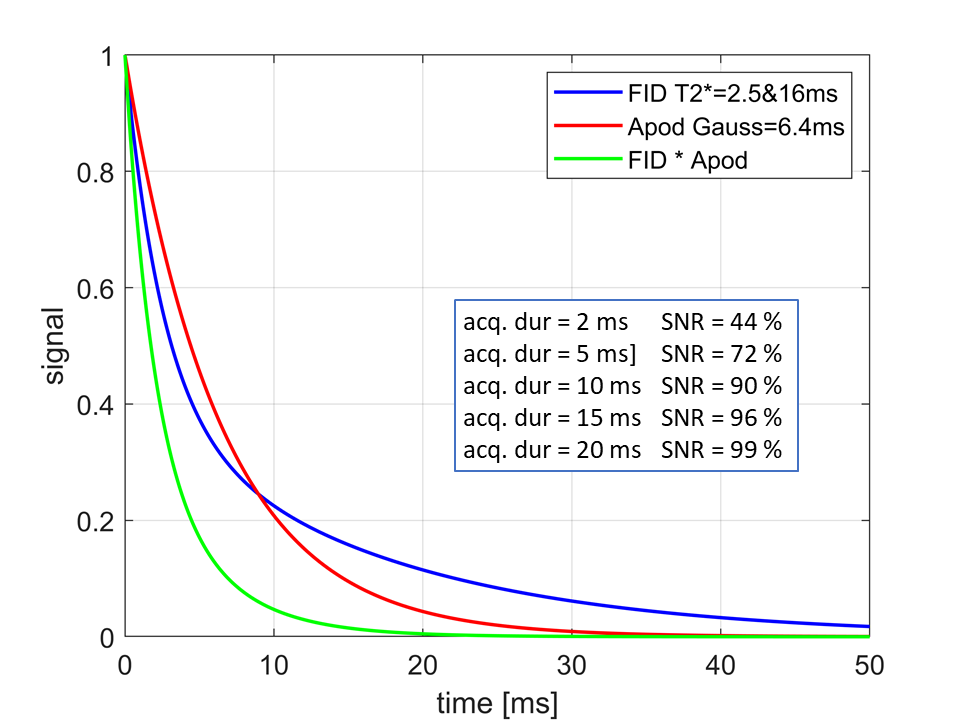
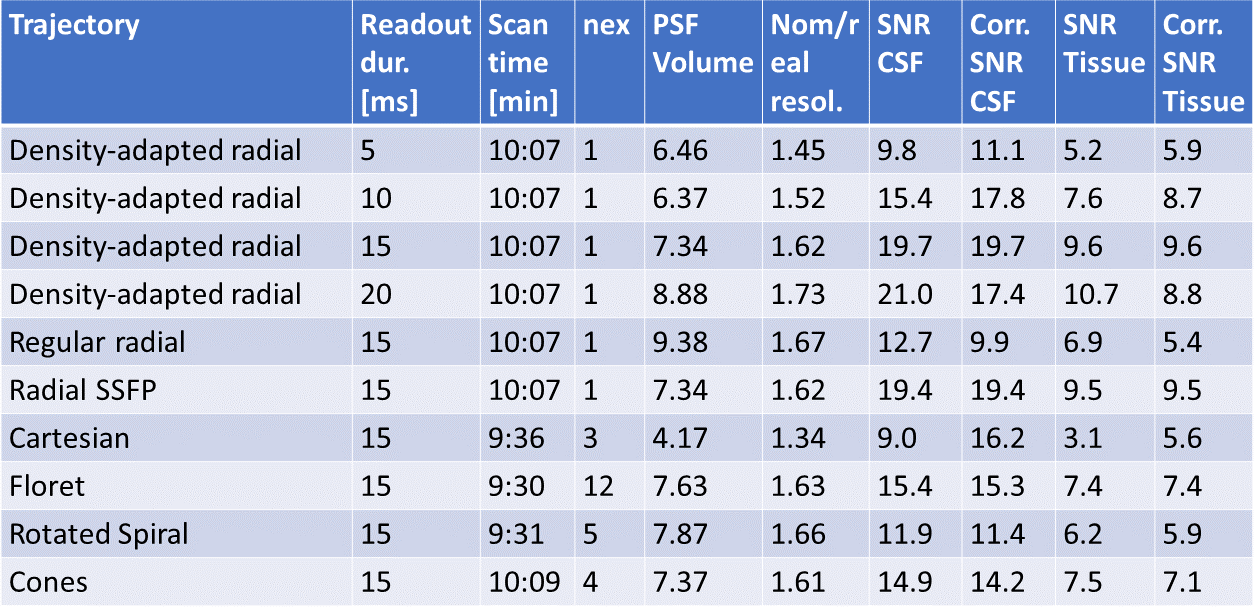
SNR is optimised with respect to T1 via exciting with the Ernst angle [3], while choosing a sufficiently long TR to limit SAR (Fig.1). SNR with respect to T2* is optimised by acquiring longer than T2* and apodising the FID with a matched filter (Fig. 2) [3]. Sensible SNR-optimal acquisition parameters for sodium in tissue are TR=30ms, flip angle=60° and readout duration=15ms. Because of short T1 and T2 times, and SAR constraints, FID/GRE imaging is generally optimal, while little gain is expected from spin-echo or balanced-SSFP sequences on human MRI scanners. Main variation in sequence design is choosing the k-space trajectory, which should always start in the centre of k-space because of short T2*.Different 3D readout trajectories were designed in Matlab and executed on the MRI via the MNS Research Pack. 3D Density-Adapted Radial trajectories [4] were designed with readout durations of 5,10,15,20ms to investigate the differences in SNR experimentally. These were compared to 3D constant-amplitude Radial, Cartesian, Floret [5] and Rotated Spiral [6] trajectories, each with a 15ms readout duration. The effects of partially refocusing magnetisation via balanced SSFP were investigated using a 15ms-Density-Adapted Radial. For a fair comparison, all trajectories were designed for a nominal matrix size of 803, a FOV<20cm (scaled to 24cm(brain)/35cm(abdomen) by derating the gradients) with isotropic resolution and a total scan time of ~10 minutes, requiring averaging for the more sampling efficient trajectories (see Table 1). Sodium and proton images of human brain were acquired on a 3T MRI scanner (MR750, GE HealthCare) using a commercial dual-tuned 23Na-1H transmit-receive birdcage head coil (PulseTeq).
Results and Discussion
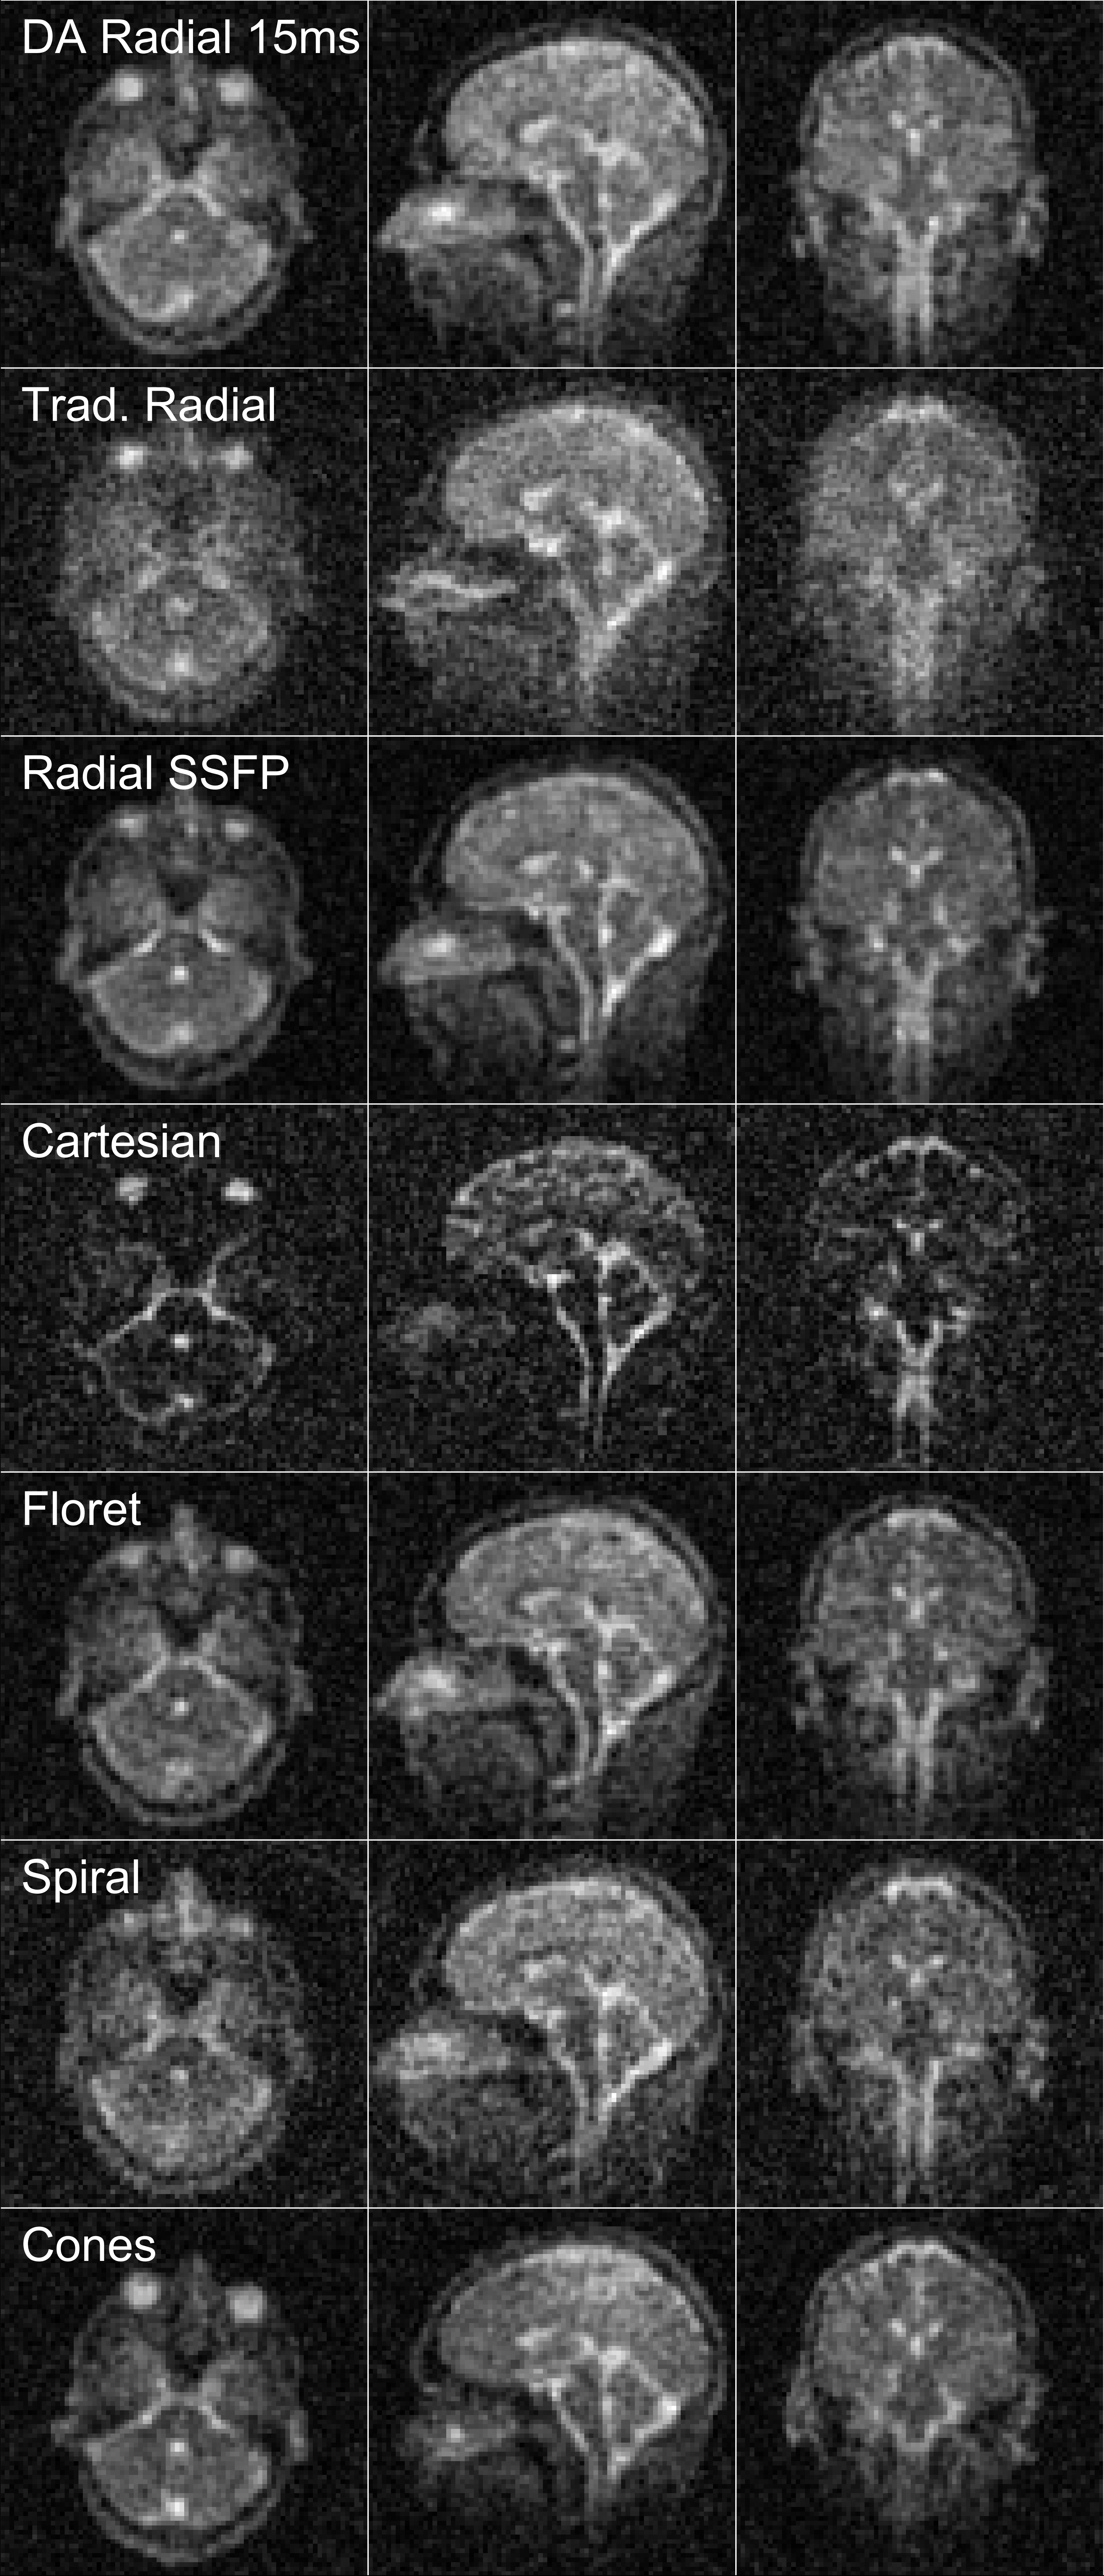
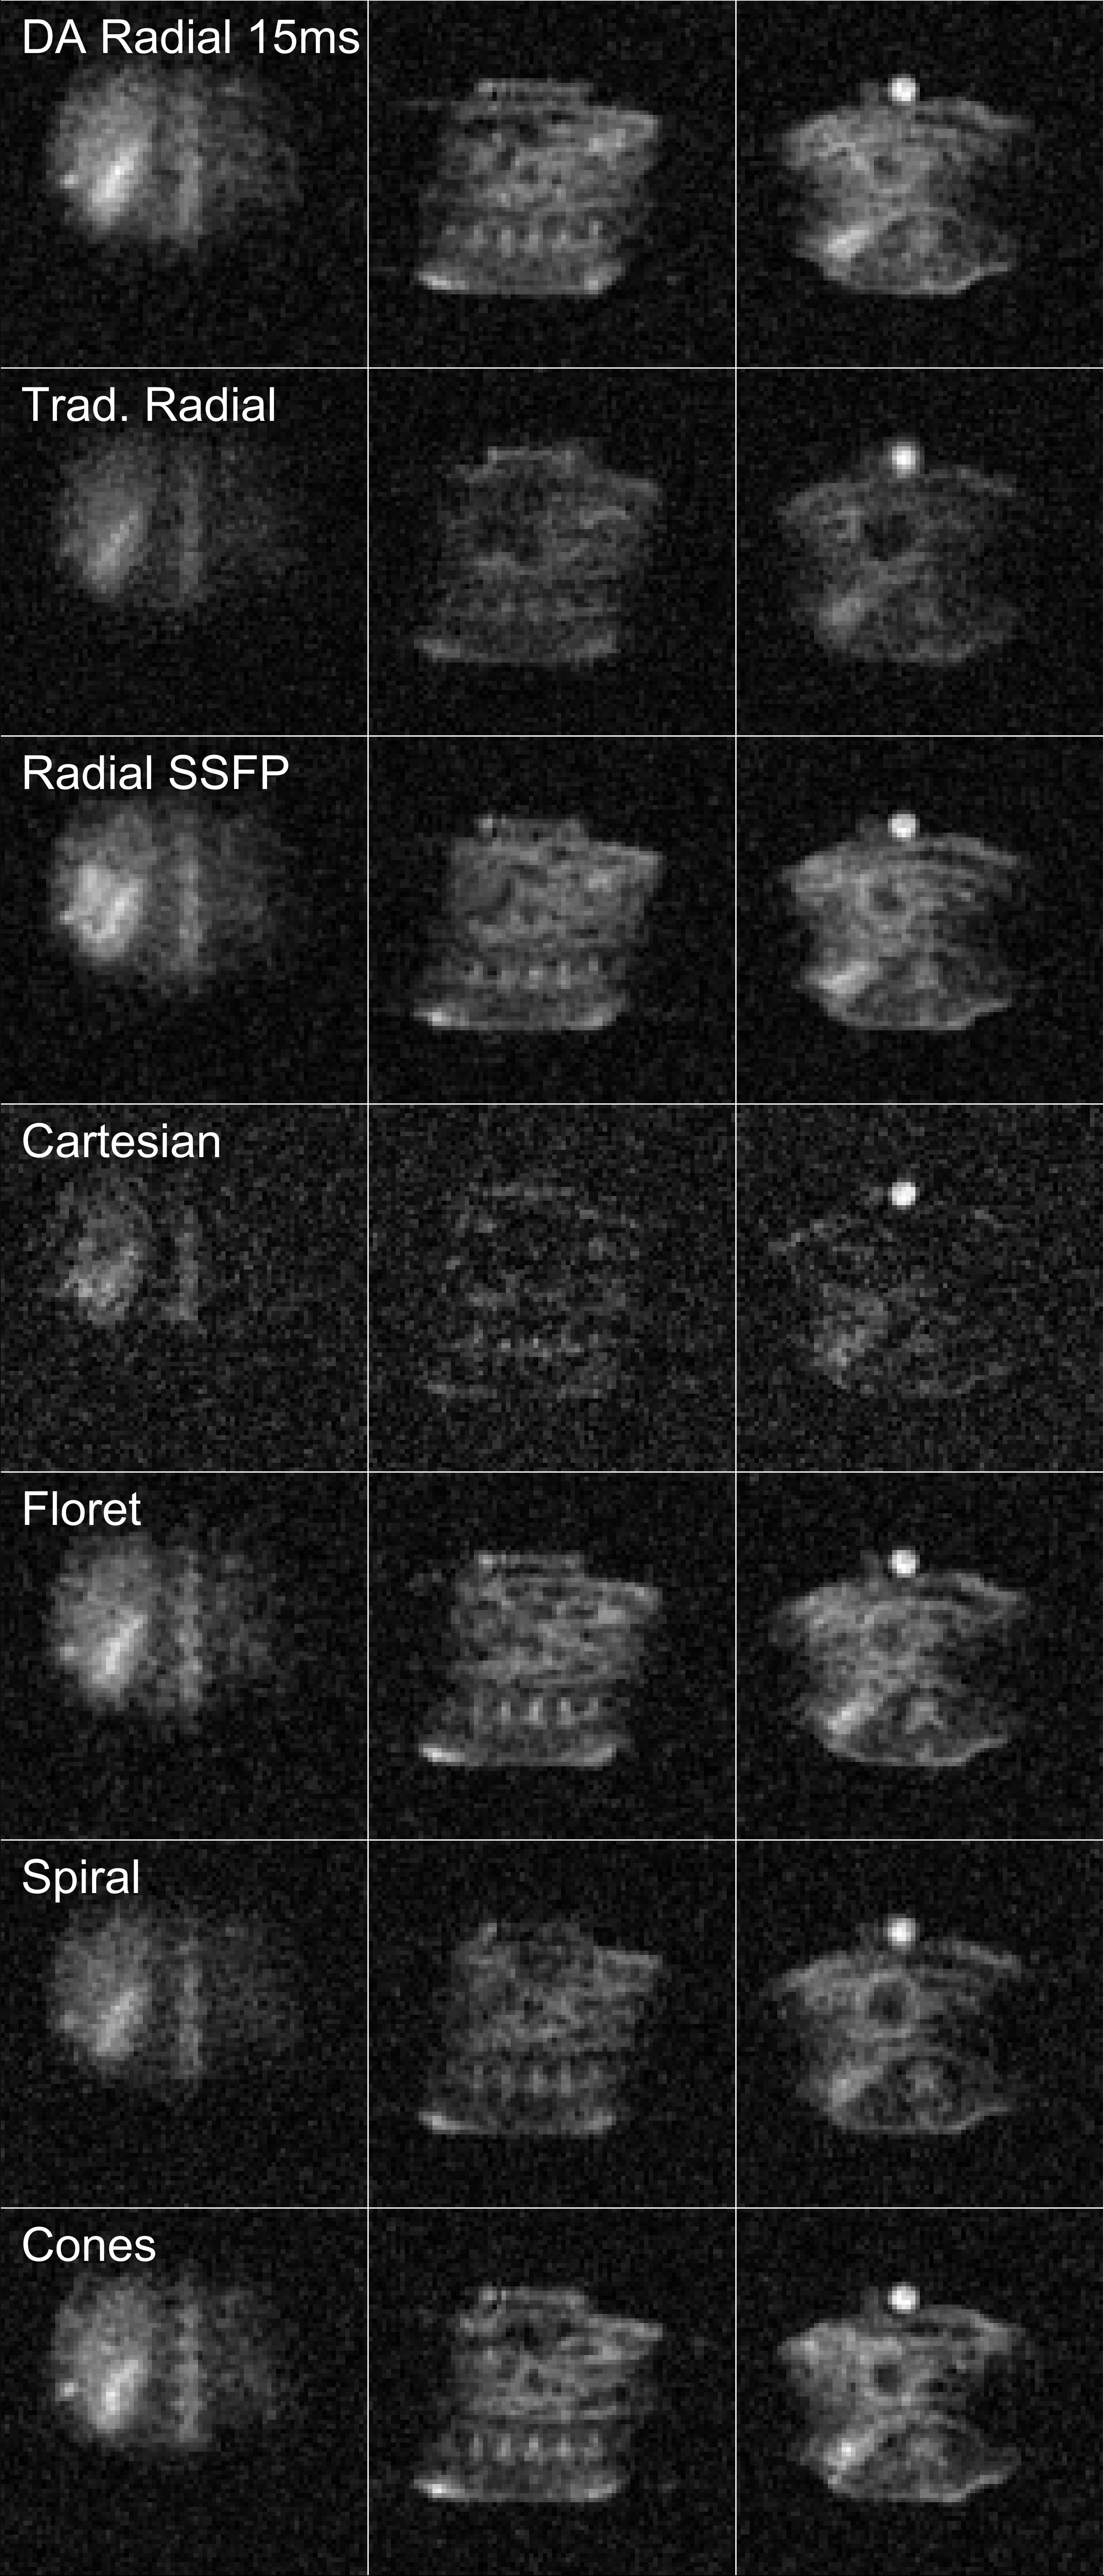
Representative sodium images in brain and abdomen are shown in Figs. 3 and 4, respectively. SNR was calculated by segmenting sodium brain images via thresholding into CSF and tissue (i.e., grey and white matter). Signal was averaged over the whole 3D CSF/tissue compartments, while noise used standard deviation outside the object. The impact of the point-spread-function on SNR is great and must be considered for a fair comparison. Both original and corrected (for PSF volume and exact acquisition time) SNR values in CSF and tissue are listed in Table 1. The following discussion focuses on tissue sodium concentration because of its clinical relevance.SNR-optimal is the 15ms-Density-Adapted Radial trajectory with a corrected tissue SNR of 9.6 (Table 1). Other Density-Adapted Radial durations exhibit smaller SNR values (5.9 to 8.8), mainly because signal is not sampled (especially for the 5ms radial) and partially because apodisation was not optimally matched. No significant difference is visible between GRE and bSSFP, hence substantiating the claim that the short T1/T2 times limit the value of non-GRE acquisitions.
The different encoding schemes exhibit significantly lower corrected SNR-values in tissue as compared to Density-Adapted Radial. Regular constant-amplitude 15ms Radial exhibits with SNR=5.4 almost half the SNR as its density-adapted version, which would require almost 4-times the scan time to compensate for that loss. SNR of Cartesian sampling is impaired by the long additional TE, hence loss to T2*, despite its optimal k-space sampling (sampling density=1). Also, apodisation with a matched-filter is less optimal as compared to centre-out k-space sampling. More intricate sampling schemes such as Rotated Spiral and Floret are more demanding on gradients, which could potentially decrease SNR, along with the suboptimal sampling density.
Acknowledgements
No acknowledgement found.References
[1] Biomedical applications of sodium MRI in vivo. Madelin G, Regatte RR. J Magn Reson Imaging. 2013 Sep;38(3):511-29. doi: 10.1002/jmri.24168.
[2] Sodium MRI revisited. Burstein D, Springer CS Jr. Magn Reson Med. 2019 Aug;82(2):521-524. doi: 10.1002/mrm.27738.
[3] Principles of Nuclear Magnetic Resonance in One and Two Dimensions. Richard R. Ernst. Oxford Science Publications.
[4] Sodium MRI using a density-adapted 3D radial acquisition technique. Nagel AM, Laun FB, Weber MA, Matthies C, Semmler W, Schad LR. Magn Reson Med. 2009 Dec;62(6):1565-73. doi: 10.1002/mrm.22157.
[5] A new design and rationale for 3D orthogonally oversampled k-space trajectories. Pipe JG, Zwart NR, Aboussouan EA, Robison RK, Devaraj A, Johnson KO. Magn Reson Med. 2011 Nov;66(5):1303-11. doi: 10.1002/mrm.22918.
[6] Rapid three-dimensional multiparametric MRI with quantitative transient-state imaging. Gómez PA, Cencini M, Golbabaee M, Schulte RF, Pirkl C, Horvath I, Fallo G, Peretti L, Tosetti M, Menze BH, Buonincontri G. Sci Rep. 2020 Aug 13;10(1):13769. doi: 10.1038/s41598-020-70789-2.
Figures
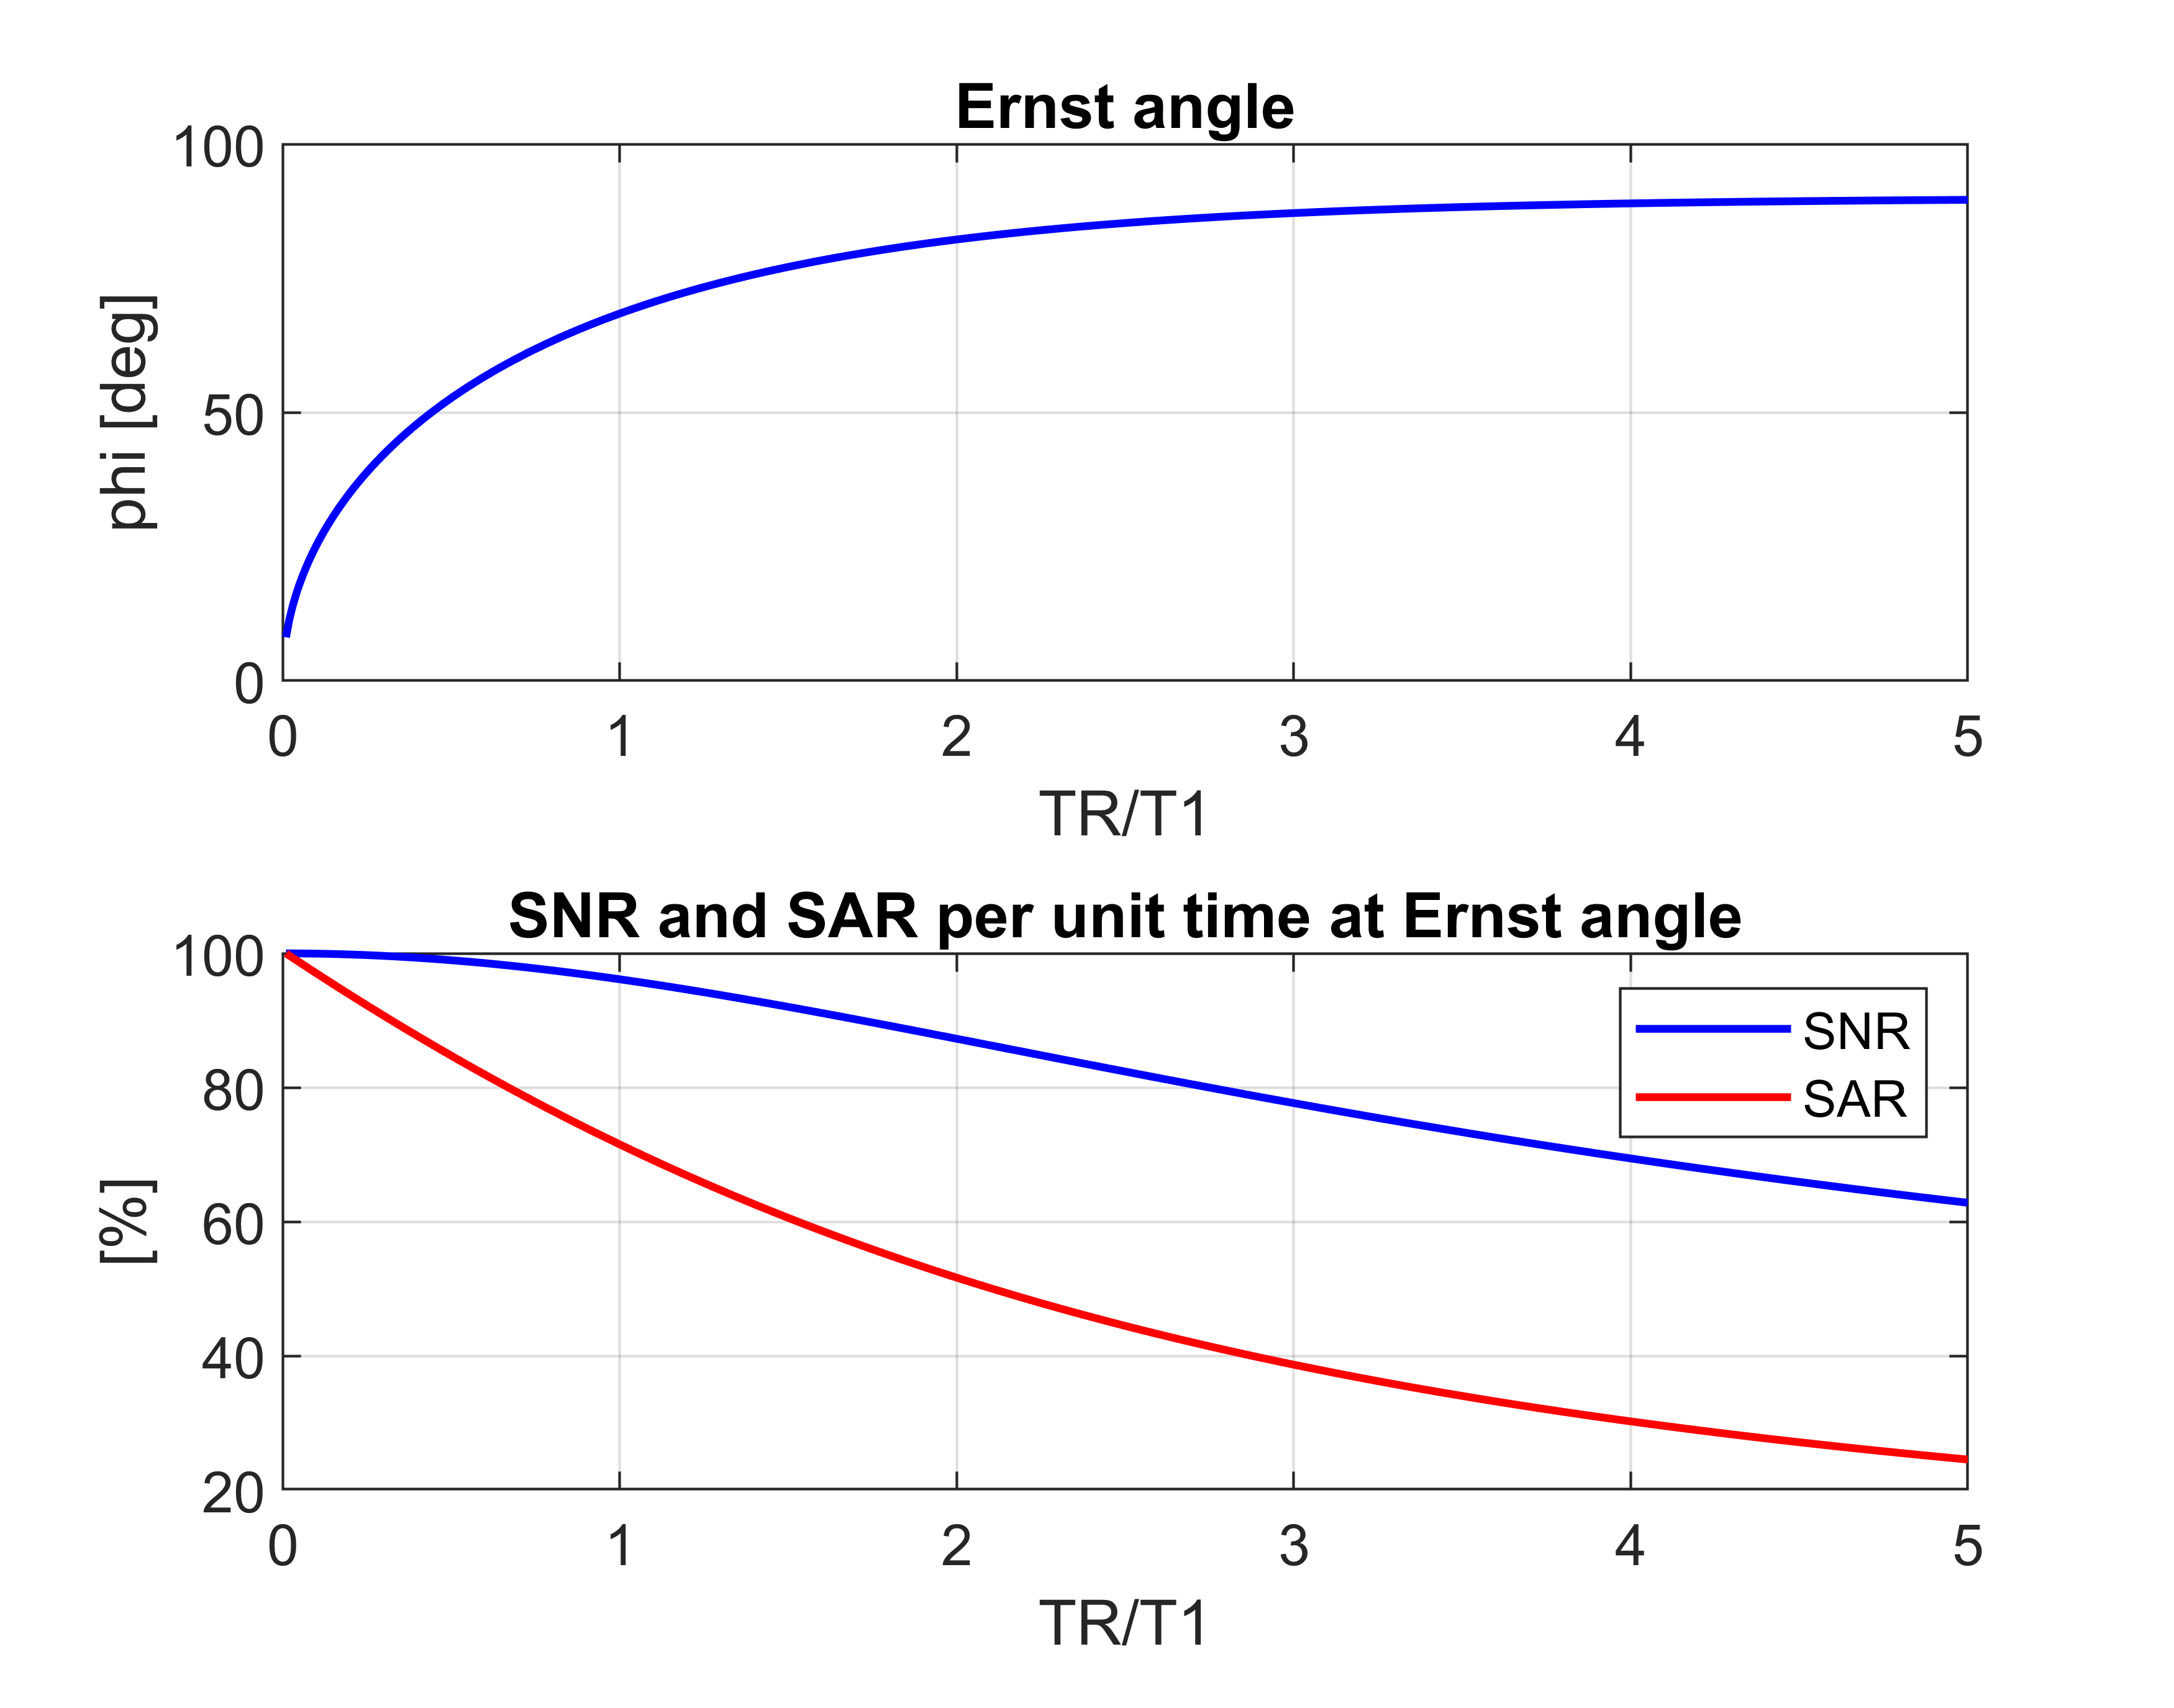
Fig. 1: Simulations to determine SNR-optimal TR and flip angles. While SNR decreases only slightly (by 4%) when going from TR<<T1 to TR=T1, the SAR decreases with 28% much more. Hence, longer TRs can increase SNR if SAR is limiting.
The SNR-optimal excitation flip angle is the Ernst angle φ=arccos(exp(-TR/T1)) . The SNR per unit time using Ernst angle excitation is proportional to Sspoil/√TR, where the steady-state signal is calculated according to Sspoil=(sinφ (1-exp(-TR/T1)))/(1-cosφ exp(-TR/T1)). The power deposition per unit time is proportional to φ2/TR.