3037
Validation of CSI-SSFP with four markers (HDO, Glucose, Glx, and Lactate) for Deuterium Metabolic Imaging in the brain at 16.4T1CMRR, Department of Radiology, University of Minnesota, Minneapolis, MN, United States, 2Weizmann, Rehovot, Israel
Synopsis
Keywords: Deuterium, Deuterium, DMI,MRSI,SSFP
Motivation: DMI's faces a poor SNR, and the detection of vital Glx/lactate metabolites in the brain tumor can be compromised.
Goal(s): This research aims to determine whether the optimized CSI-SSFP imaging method is effective for detecting the four biomarkers (HDO, Glucose, Glx, and Lactate) with improved SNR compared to traditional CSI in rodent brains.
Approach: The approach involves comparing DMI SNR using both traditional CSI and CSI-SSFP for monitoring and imaging the metabolism of injected [6,6’-2H2]-glucose in healthy mouse brains.
Results: CSI-SSFP highlights substantial enhancement of 2-3 times in SNR for Glx and lactate.
Impact: DMI is promising to assess the Warburg effect associated with cancer. The CSI-SSFP method provides several folds of SNR improvement, which is critical to improve sensitivity and resolution aiming for imaging intra-tumor heterogeneity and metabolic reprograming in brain tumors.
INTRODUCTION
Deuterium Metabolic Imaging (DMI) holds a great potential for investigating cellular energy metabolism and tumor abnormality. In brain, it involves tracking the uptake of [6,6’-2H2]-glucose and monitoring the metabolite production of glutamate and glutamine (Glx), lactate, and HDO. This approach allows to map these metabolites, which has been demonstrated in recent studies to be highly effective in “Warburg-effect” contrasting of brain tumors [1-3]. However, DMI faces its primary challenge in terms of relatively poor signal-to-noise ratio (SNR), due to the low γ (gyromagnetic ratio) of 2H spin and the low concentrations of metabolic markers. Balanced Steady-State Free Precession (bSSFP) approaches can enhance SNR by a factor of 2-3 when compared to conventional CSI methods, such as the Ernst Angle condition or FID-SSFP condition, as recently demonstrated in assessments of pancreatic cancer in mice [4-6]. For pancreatic cancer, only three markers are detectable: HDO, Glucose, and Lactate. This study extends the application of the CSI-SSFP sequence [6,7] for optimal detection of four markers (HDO, Glucose, Glx and Lactate) in rodent brain at the ultrahigh field strength of 16.4T.METHODS
In vivo experiments, approved by the University of Minnesota IACUC, were conducted on healthy C57 black mice. DMI involved the intraperitoneal (IP) injection of approximately 2.5 g/kg body weight of [6,6’-2H2]-glucose in PBS, followed by the acquisition of 2H/1H images using a 16.4T Bruker scanner equipped with a dual-frequency surface coil tuned to 697.54 MHz (1H) and 107.07 MHz (2H) [8]. Both conventional 2H CSI with a repetition time (TR) of 62.5 ms and 2H CSI-SSFP with TR=15.6 ms sequences were optimized for DMI with: flip angle of 60°, 16x16x5 matrices, and a field of view (FOV) of 18x18x15mm3. Data acquisition involved sampling 300-point and 64-point gradient-free FIDs at a rate of 5 kHz for CSI and CSI-SSFP, respectively. CSI was performed with 24 weighted averages, 5 minutes per 3D volume, while CSI-SSFP required 24 weighted averages and 4 repetitions (regular averaging), totaling the same 5 minutes for acquisition. The two methods were acquired in an interleave way for a total experimental duration of around 120 minutes.Spatial domains were reconstructed identically using 3D Fourier Transform (FT) after zero-filling to 64x64x5. Images for CSI, derived from a 50 Hz spectrum integral (after FT of the FIDs) for each metabolite, and CSI-SSFP FID points were processed using IDEAL, as described in references [4-5,9]. IDEAL isolated images of individual sites based on a priori known chemical shift positions. SNR maps were generated by subtracting the amplitude of each voxel from the mean noise level and dividing it by the standard deviation of the noise. Noise was collected from a region of interest (ROI) with no signal in the images.
RESULTS & DISCUSSION
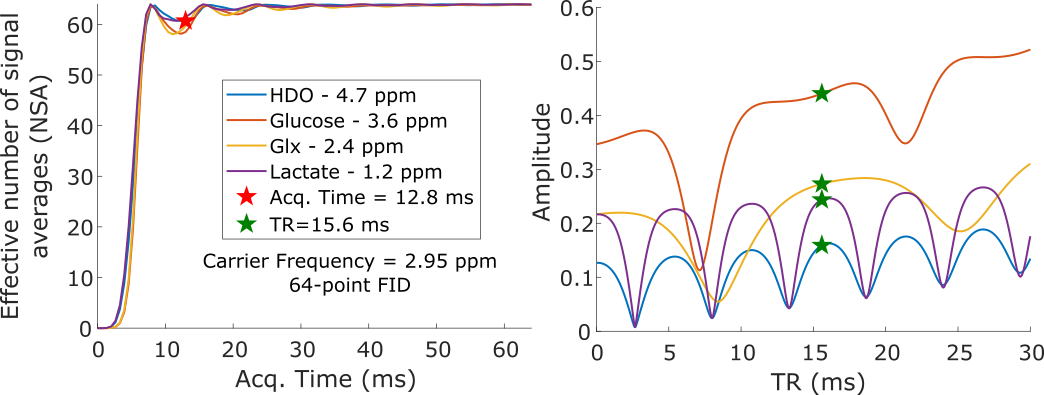
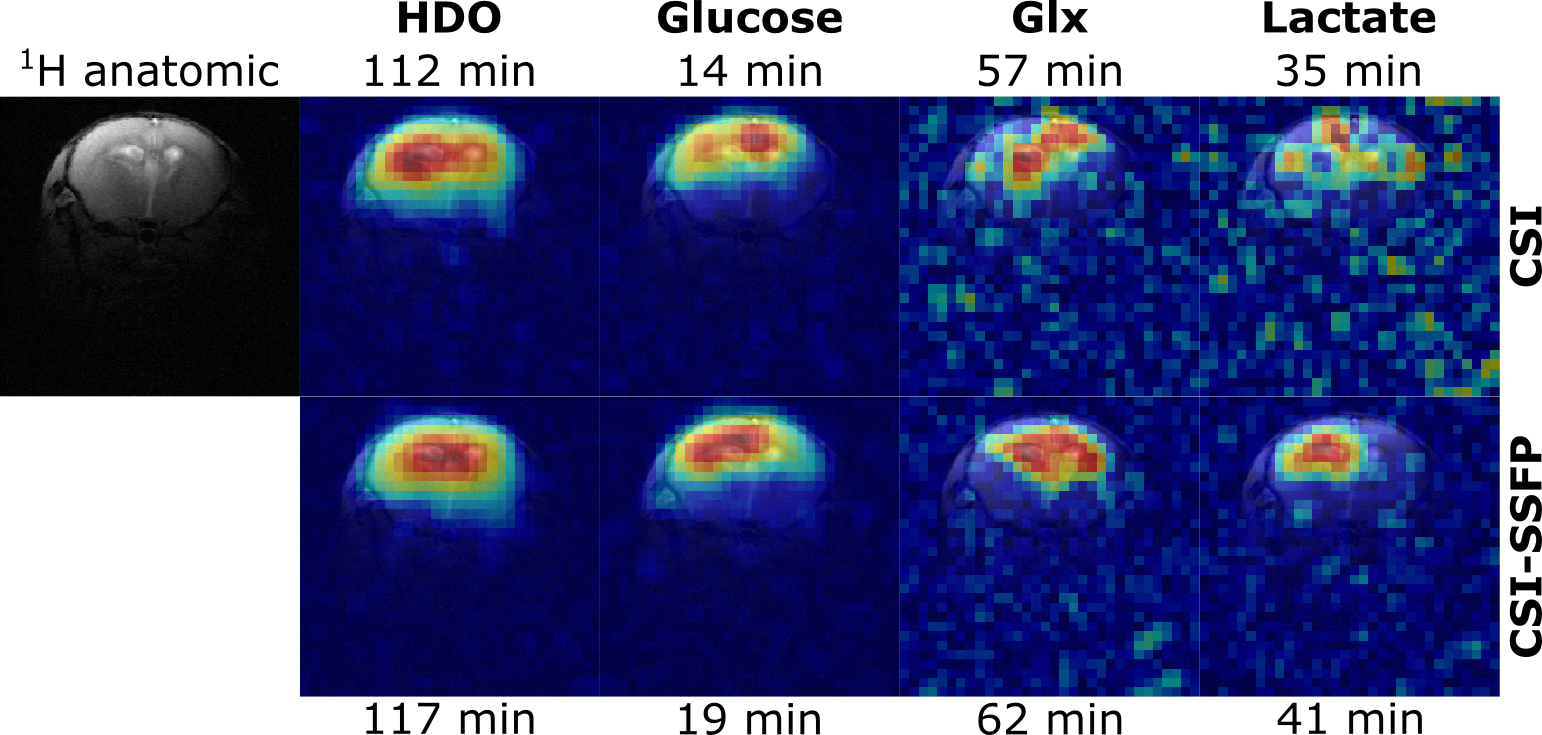
The effective Number of Signal Averages (NSA) in Fig. 1 (left panel) demonstrates that an acquisition time longer than 7.8 ms is sufficient to separate the four metabolites of interest using the IDEAL fitting method [4,9]. By seeking an acquisition time that satisfies this condition and minimizing the TR, we have determined that a TR of 15.6 ms and a carrier frequency of 2.95 ppm represent an optimal combination to avoid stopbands for all metabolites (Fig. 1, right panel).Fig. 2 shows a 1H image obtained from a healthy mouse brain, along with the DMI outcomes recorded at various time points following the IP injection of [6,6’-2H2]-glucose, using both CSI and CSI-SSFP techniques. It's important to highlight the significantly enhanced SNR especially for Glx and lactate in the CSI-SSFP data.
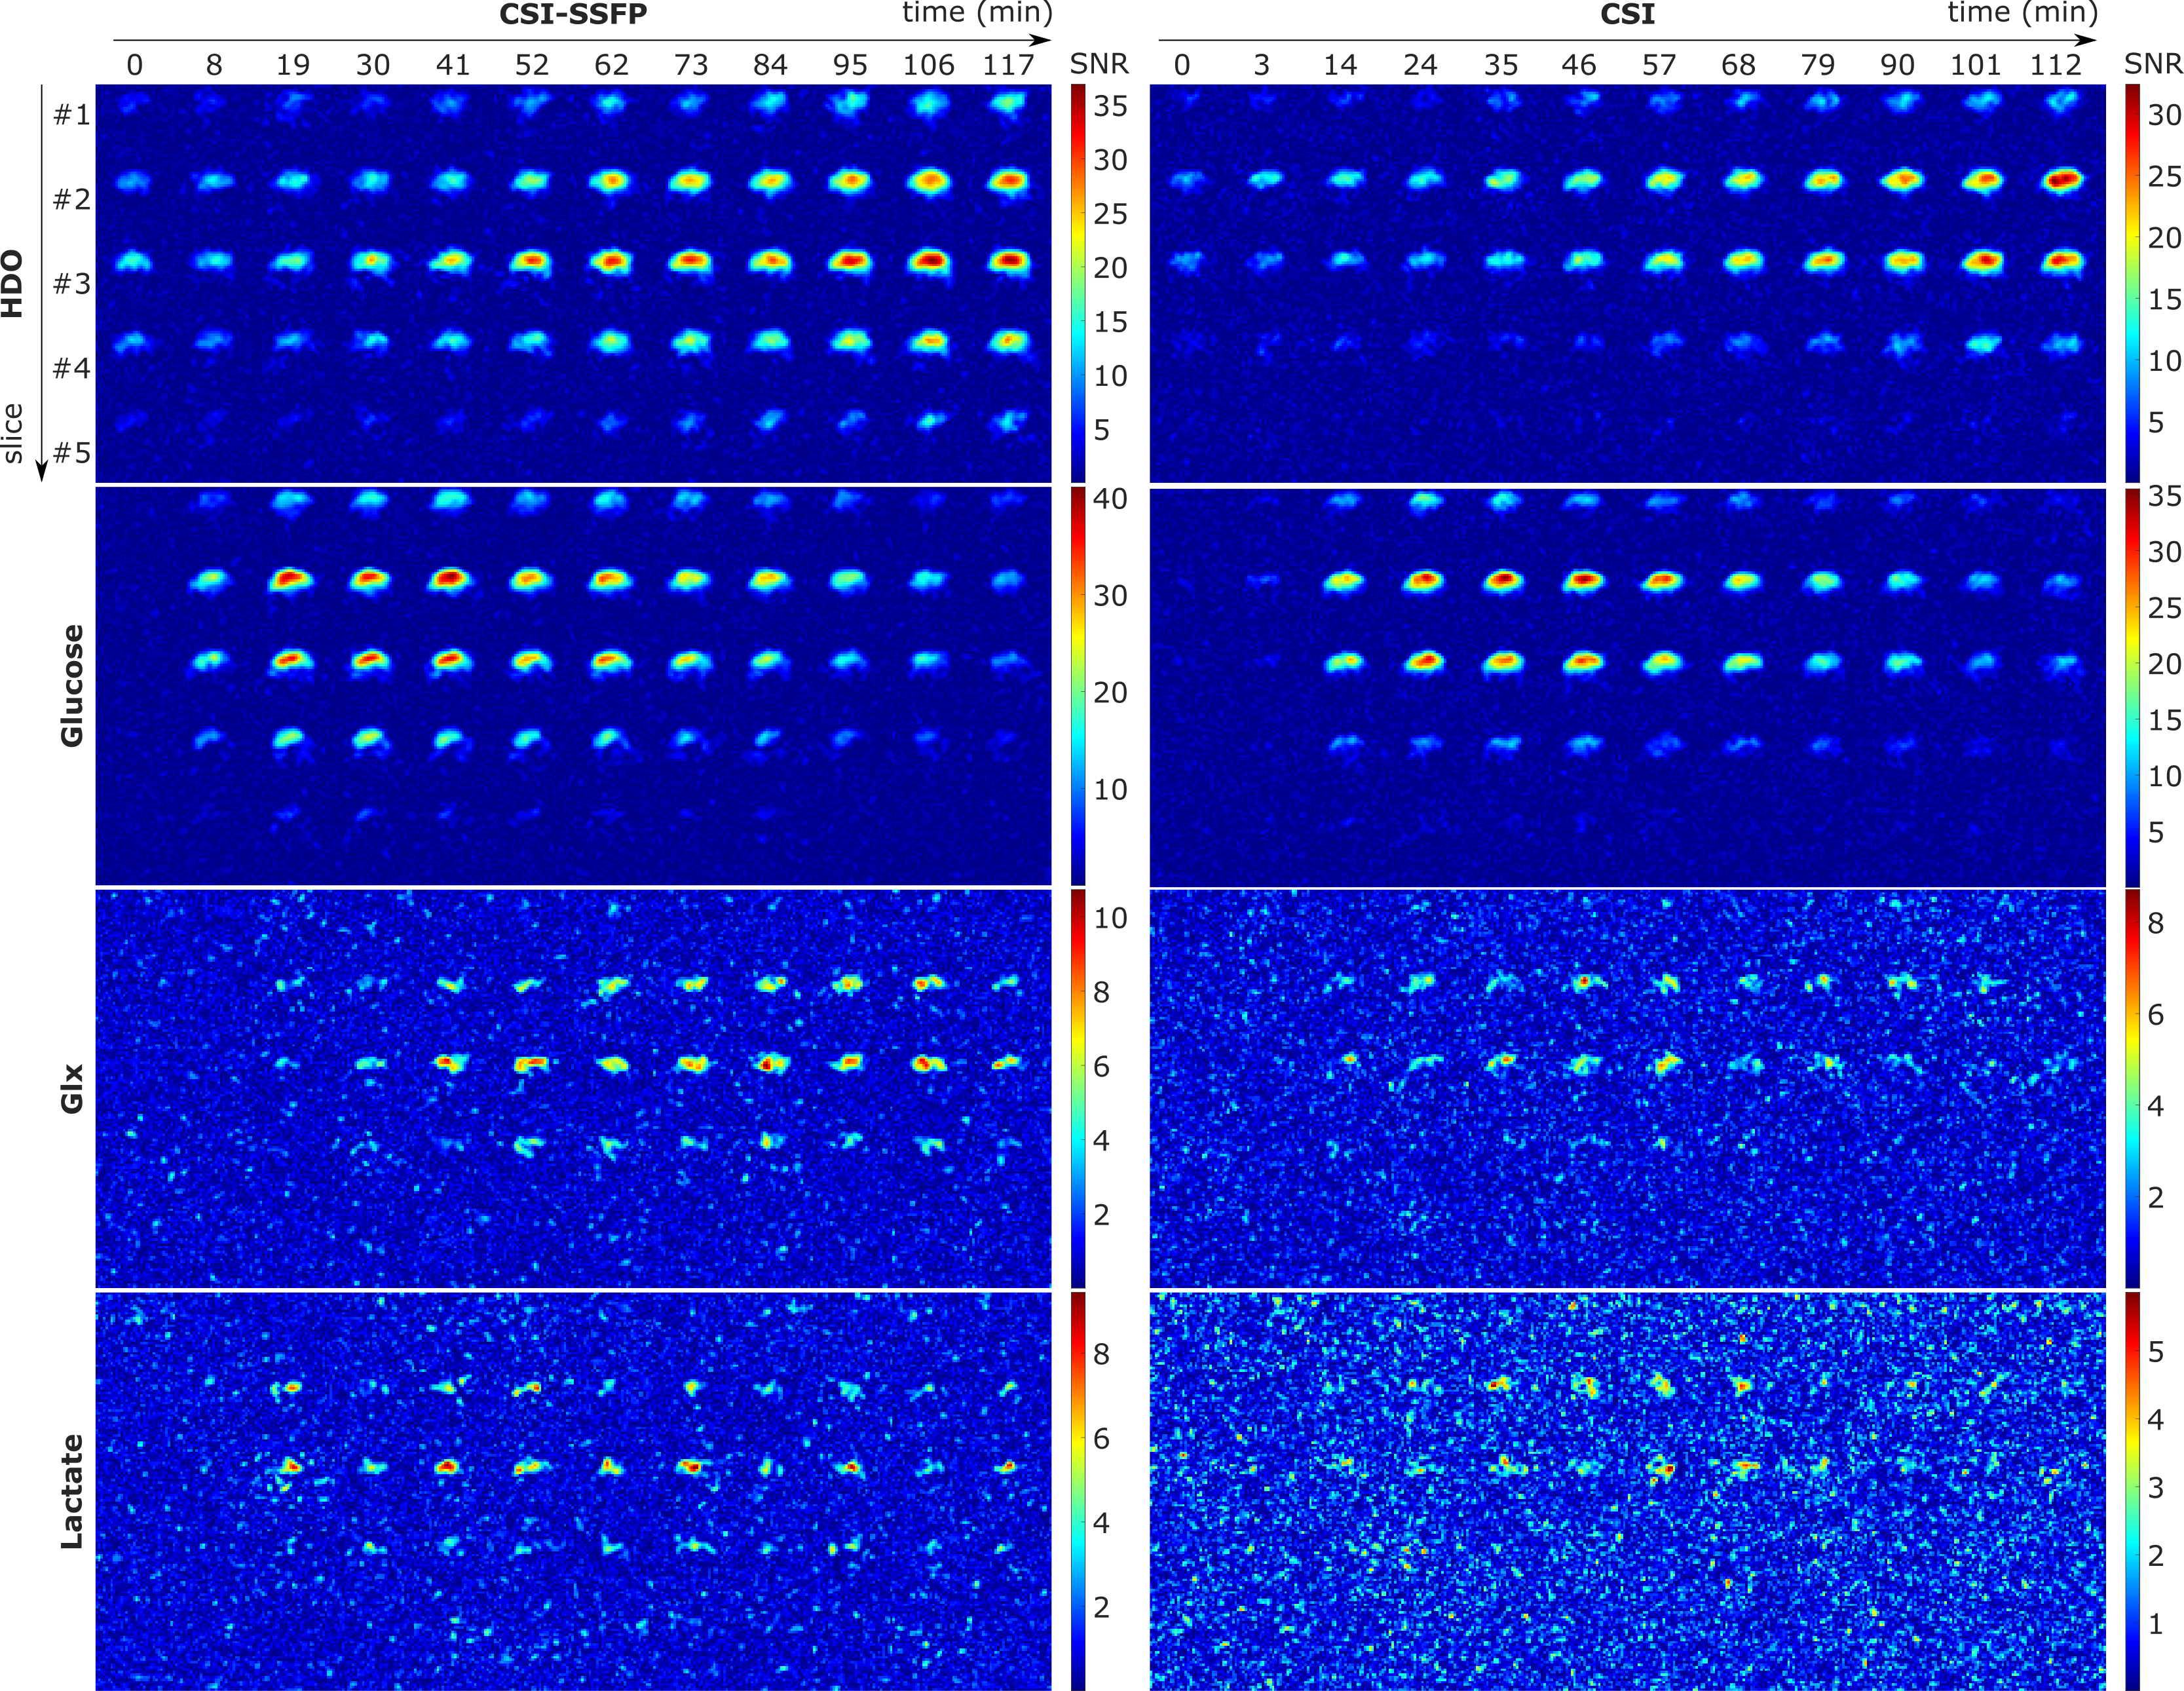
The full dynamic dataset, corresponding to Fig. 2, is presented in Fig. 3. The superior SNR of CSI-SSFP for Glx and lactate is evident. Before injection, only HDO at natural abundance is observed. Following the injection, glucose immediately appears, with its intensity varying over time. Glx and lactate have a delayed appearance, albeit with much lower intensity compared to glucose. HDO levels steadily increase over the entire 2-hour measurement period. Glx and lactate seem to begin decreasing after 60 minutes, with a more pronounced decline in lactate.
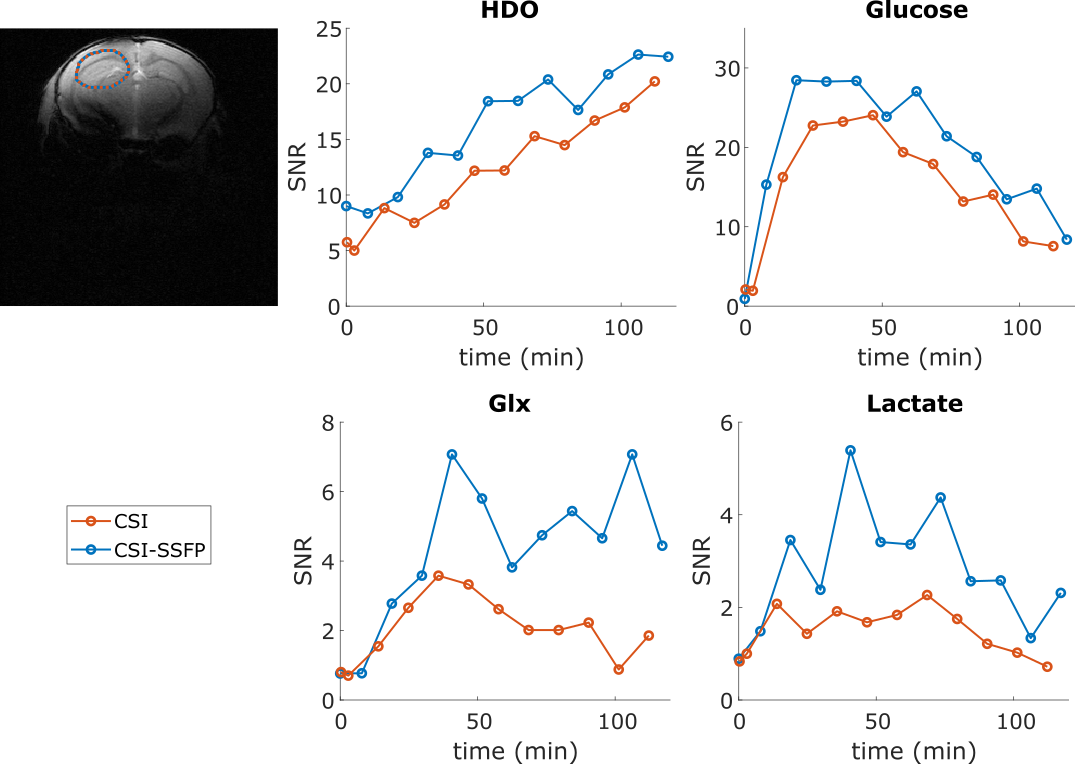
Fig. 4 provides a summary of SNR for individual metabolites across the entire series of time-incremented images, with a specific focus on a ROI, indicating a SNR improvement of approximately 2-3 times.
CONCLUSION
CSI-SSFP was quantitatively assessed in this mice brain study following the injection of [6,6’-2H2]-glucose, focusing on four metabolites of interest (HDO, Glucose, Glx, and Lactate). The CSI-SSFP method demonstrates superior scanning efficiency and enables substantial improvements in SNR. The most significant SNR enhancements were observed, particularly for Glx and lactate, which are crucial metabolites for cancer detection.Acknowledgements
This work was supported in part by NIH grants of R01 CA240953, R01 NS133006, U01 EB026978, S10 OD028712, P41 EB027061, and in part by the Minerva, the Israel Science Foundation, and the Israel Cancer Research Foundation. LF heads the Clore Institute for High-Field Magnetic Resonance Imaging and Spectroscopy, whose support is also acknowledged.References
1. Lu M, Zhu XH, Zhang Y, Low W, Chen W. Simultaneous Assessment of Abnormal Glycolysis and Oxidative Metabolisms in Brain Tumor using In Vivo Deuterium MRS Imaging. Proc Intl Soc Mag Reson Med; 2016; Singapore. p. 3962. https://cds.ismrm.org/protected/16MProceedings/PDFfiles/3962.html
2. Lu M, Zhu XH, Zhang Y, Mateescu G, Chen W. Quantitative assessment of brain glucose metabolic rates using in vivo deuterium magnetic resonance spectroscopy. J Cereb Blood Flow Metab. 2017 Nov;37(11):3518-3530. doi: 10.1177/0271678X17706444. Epub 2017 May 15. PMID: 28503999; PMCID: PMC5669347.
3. De Feyter HM, Behar KL, Corbin ZA, Fulbright RK, Brown PB, McIntyre S, Nixon TW, Rothman DL, de Graaf RA. Deuterium metabolic imaging (DMI) for MRI-based 3D mapping of metabolism in vivo. Sci Adv. 2018 Aug 22;4(8):eaat7314. doi: 10.1126/sciadv.aat7314. PMID: 30140744; PMCID: PMC6105304.
4. Peters, DC, Markovic, S, Bao, Q, et al. Improving deuterium metabolic imaging (DMI) signal-to-noise ratio by spectroscopic multi-echo bSSFP: A pancreatic cancer investigation. Magn Reson Med. 2021; 86: 2604– 2617. https://doi.org/10.1002/mrm.28906
5. Montrazi ET, Bao Q, Martinho RP, et al. Deuterium imaging of the Warburg effect at sub-millimolar concentrations by joint processing of the kinetic and spectral dimensions. NMR in Biomedicine. 2023; 36(11):e4995. doi:10.1002/nbm.4995
6. Montrazi ET, Peters DC, Sasson K, Agemy L, Scherz A, and Frydman L. Improved Deuterium Metabolic Imaging of Cancer by CSI-SSFP MRSI. ISMRM & ISMRT Annual Meeting & Exhibition, 03-08 June 2023, Toronto, ON, Canada. https://cds.ismrm.org/protected/23MPresentations/abstracts/0016.html
7. Speck O, Scheffler K, Hennig J. Fast 31P chemical shift imaging using SSFP methods. Magn Reson Med. 2002 Oct;48(4):633-9. doi: 10.1002/mrm.10279. PMID: 12353280.
8. Zhang G, Zhu W, Li X, Zhu XH, Chen W. Dual-frequency resonant coil design for low-γ X-nuclear and proton magnetic resonance imaging at ultrahigh fields. NMR Biomed. 2023 Aug;36(8):e4930. doi: 10.1002/nbm.4930. Epub 2023 Apr 18. PMID: 36939997.
9. Reeder SB, Pineda AR, Wen Z, Shimakawa A, Yu H, Brittain JH, Gold GE, Beaulieu CH, Pelc NJ. Iterative decomposition of water and fat with echo asymmetry and least-squares estimation (IDEAL): application with fast spin-echo imaging. Magn Reson Med. 2005 Sep;54(3):636-44. doi: 10.1002/mrm.20624. PMID: 16092103.
Figures