3031
Improved spatial resolution for in vivo deuterium metabolic imaging using 2H 3D-FID-MRSI with concentric ring trajectories.1Department of Biomedical Imaging and Image-Guided Therapy, Medical University of Vienna, Vienna, Austria, 2Wellcome Centre for Integrative Neuroimaging, FMRIB,Nuffield Department of Clinical Neurosciences, University of Oxford, Oxford, United Kingdom, 3Christian Doppler Laboratory for MR Imaging Biomarkers (BIOMAK), Vienna, Austria, 4Department of Medicine III, Division of Endocrinology and Metabolism, Medical University of Vienna, Vienna, Austria, 5Institute for Clinical Molecular MRI, Karl Landsteiner Society, Vienna, Austria, 6Department of Psychiatry and Psychotherapy, Comprehensive Center for Clinical Neurosciences and Mental Health (C3NMH), Medical University of Vienna, Vienna, Austria
Synopsis
Keywords: Deuterium, Deuterium, Deuterium Metabolic Imaging, 7T, human brain, Magnetic Resonance Spectroscopic Imaging
Motivation: Sufficiently high spatial resolution for metabolic mapping of brain glucose metabolism is crucial as regional differences are present in many severe brain diseases, such as dementia, tumors and schizophrenia.
Goal(s): To increase spatial resolution for whole brain deuterium metabolic imaging without prolonging scan times.
Approach: Implement density-weighted concentric ring trajectory for 2H FID-MRSI readout to achieve 2.5-fold increase in spatial resolution while maintaining sufficient SNR.
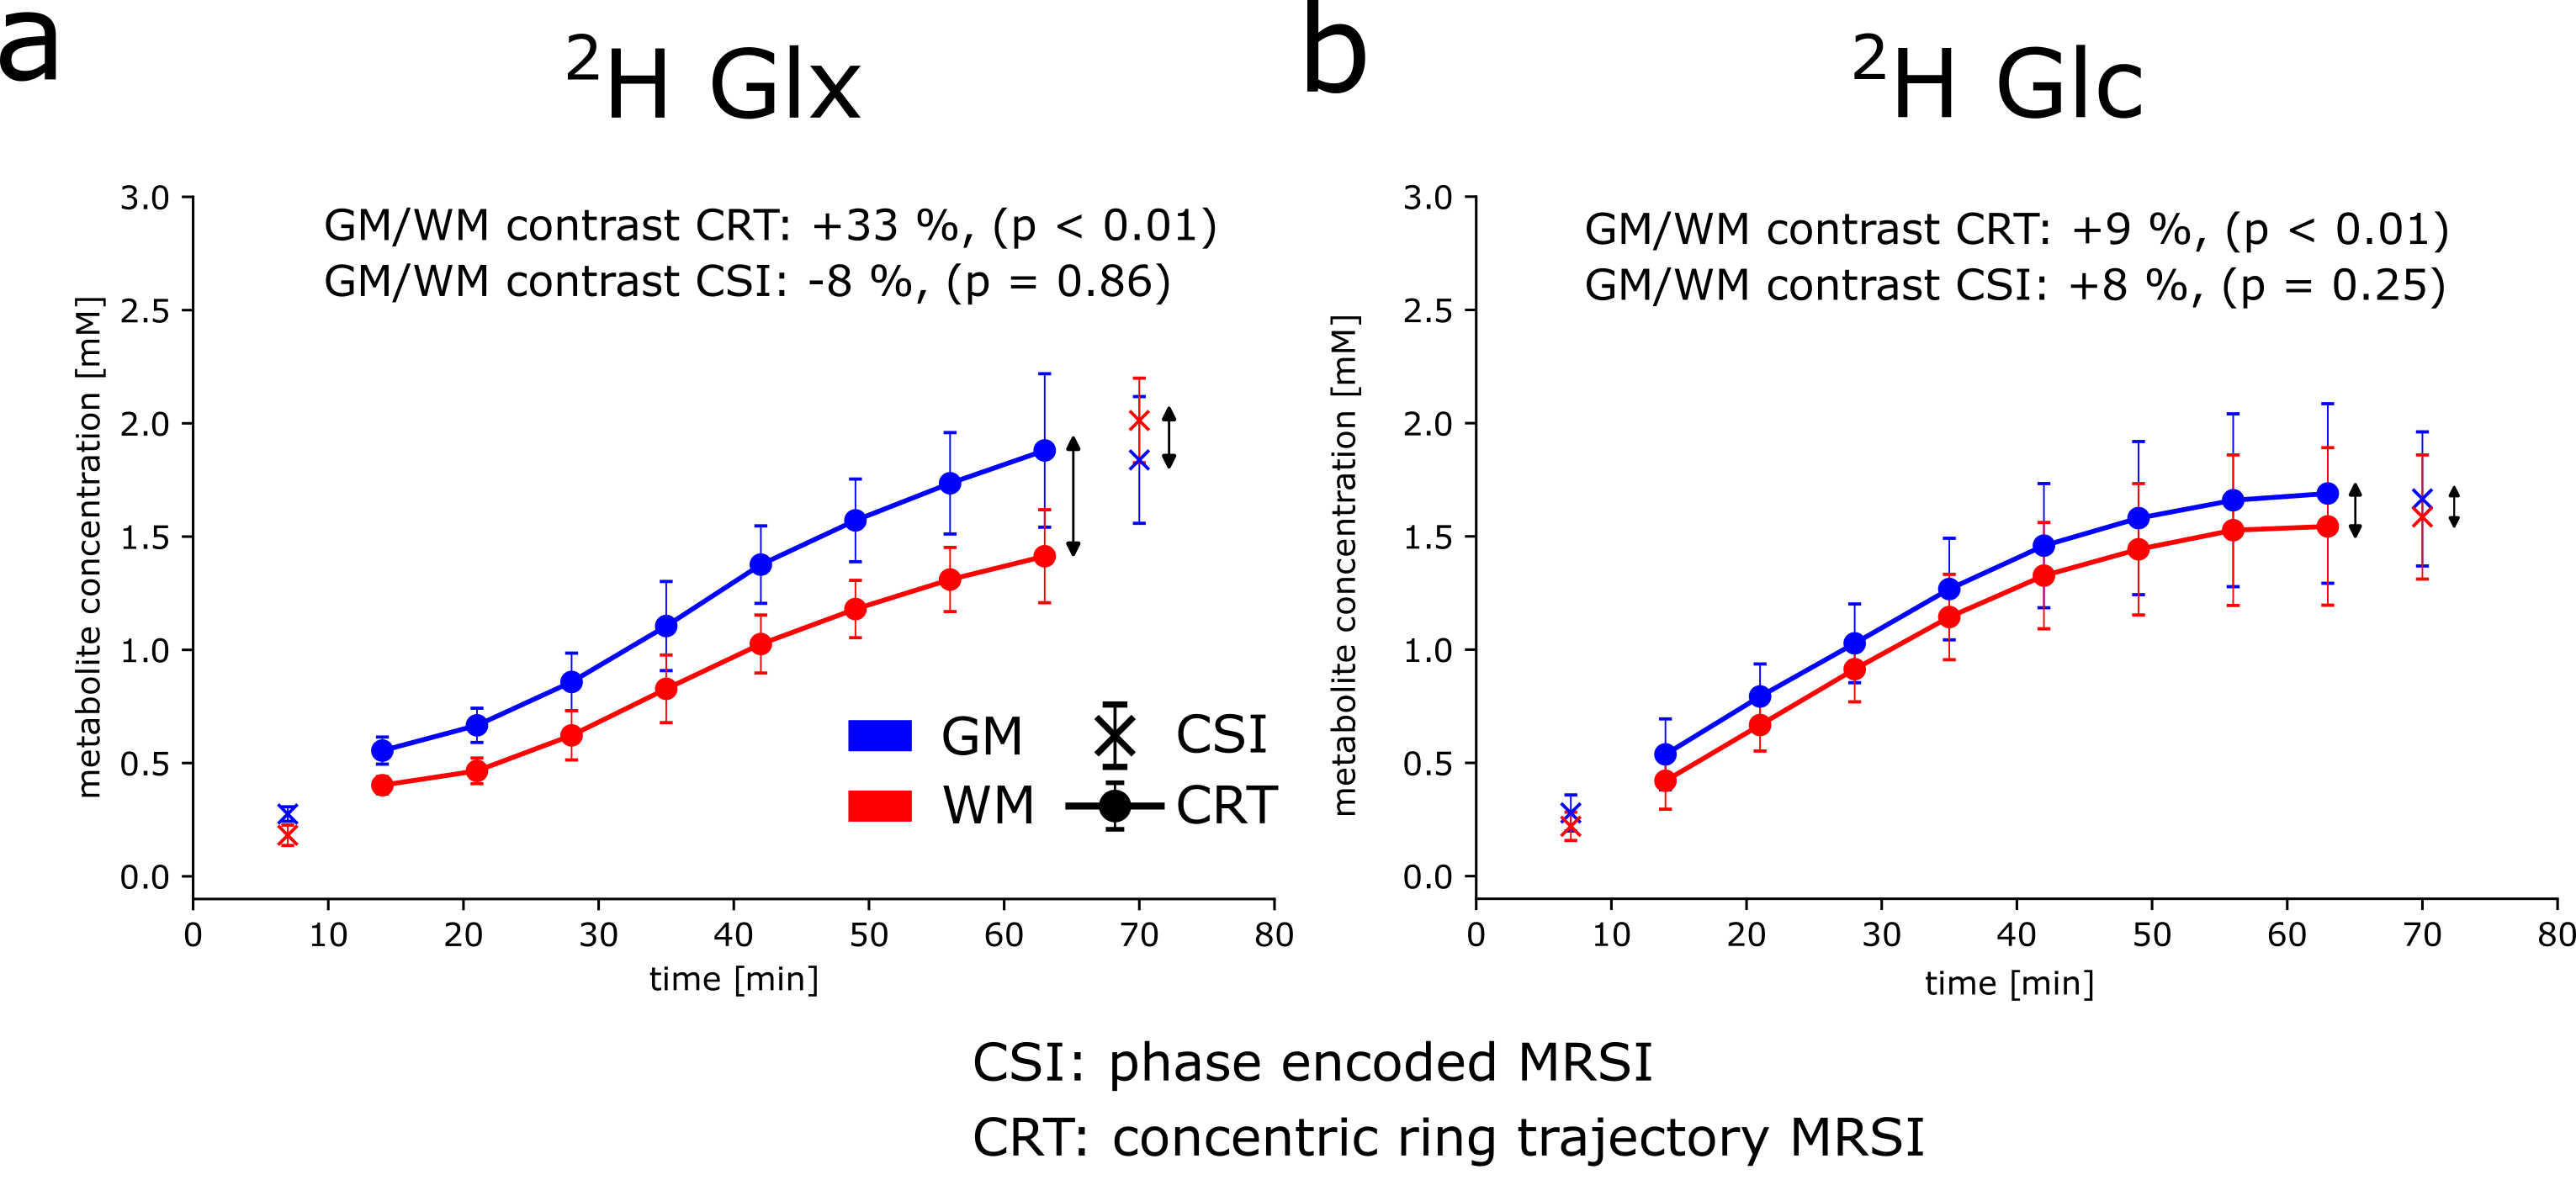
Results: Contrast-enhanced metabolic maps were acquired using CRT with significantly higher (+33%,p<0.01) Glx concentrations in GM regions compared to WM, while no differences were observed using lower resolution phase-encoded MRSI.
Impact: Increased spatial resolution for dynamic deuterium metabolic imaging is crucially needed as many severe brain pathologies feature regional differences in brain glucose metabolism. However, prolonged scan times ultimately limit the achievable spatial resolution using conventional methods for whole brain DMI.
Introduction
Deuterium Metabolic Imaging (DMI) is an emerging Magnetic Resonance technique, which offers non-invasive insight into brain glucose (Glc) uptake and additionally downstream metabolism such as neurotransmitter synthesis of combined glutamate+glutamine (Glx) and lactate production(1-3). Regional differences in glucose metabolism in the brain can be observed in various brain pathologies, such as Alzheimer’s disease, cancer, epilepsy or schizophrenia(4-6). Therefore, sufficiently high spatial resolution is crucial. However, prolonged acquisition times of phase encoded MRSI (chemical shift imaging,CSI) approaches ultimately limit the achievable spatial resolution. Spatial-spectral acquisition schemes e.g., concentric ring trajectories (CRT) can accelerate scan times up to 100-fold compared to phase encoding alone, which allows for acquiring data with higher spatial resolution(7-9). This study aims to implement spatial-spectral sampling schemes for whole-brain 2H FID-MRSI to assess metabolic maps with increased spatial resolution and contrast. Results are compared to lower resolution DMI maps, acquired within the same protocol using CSI.Methods
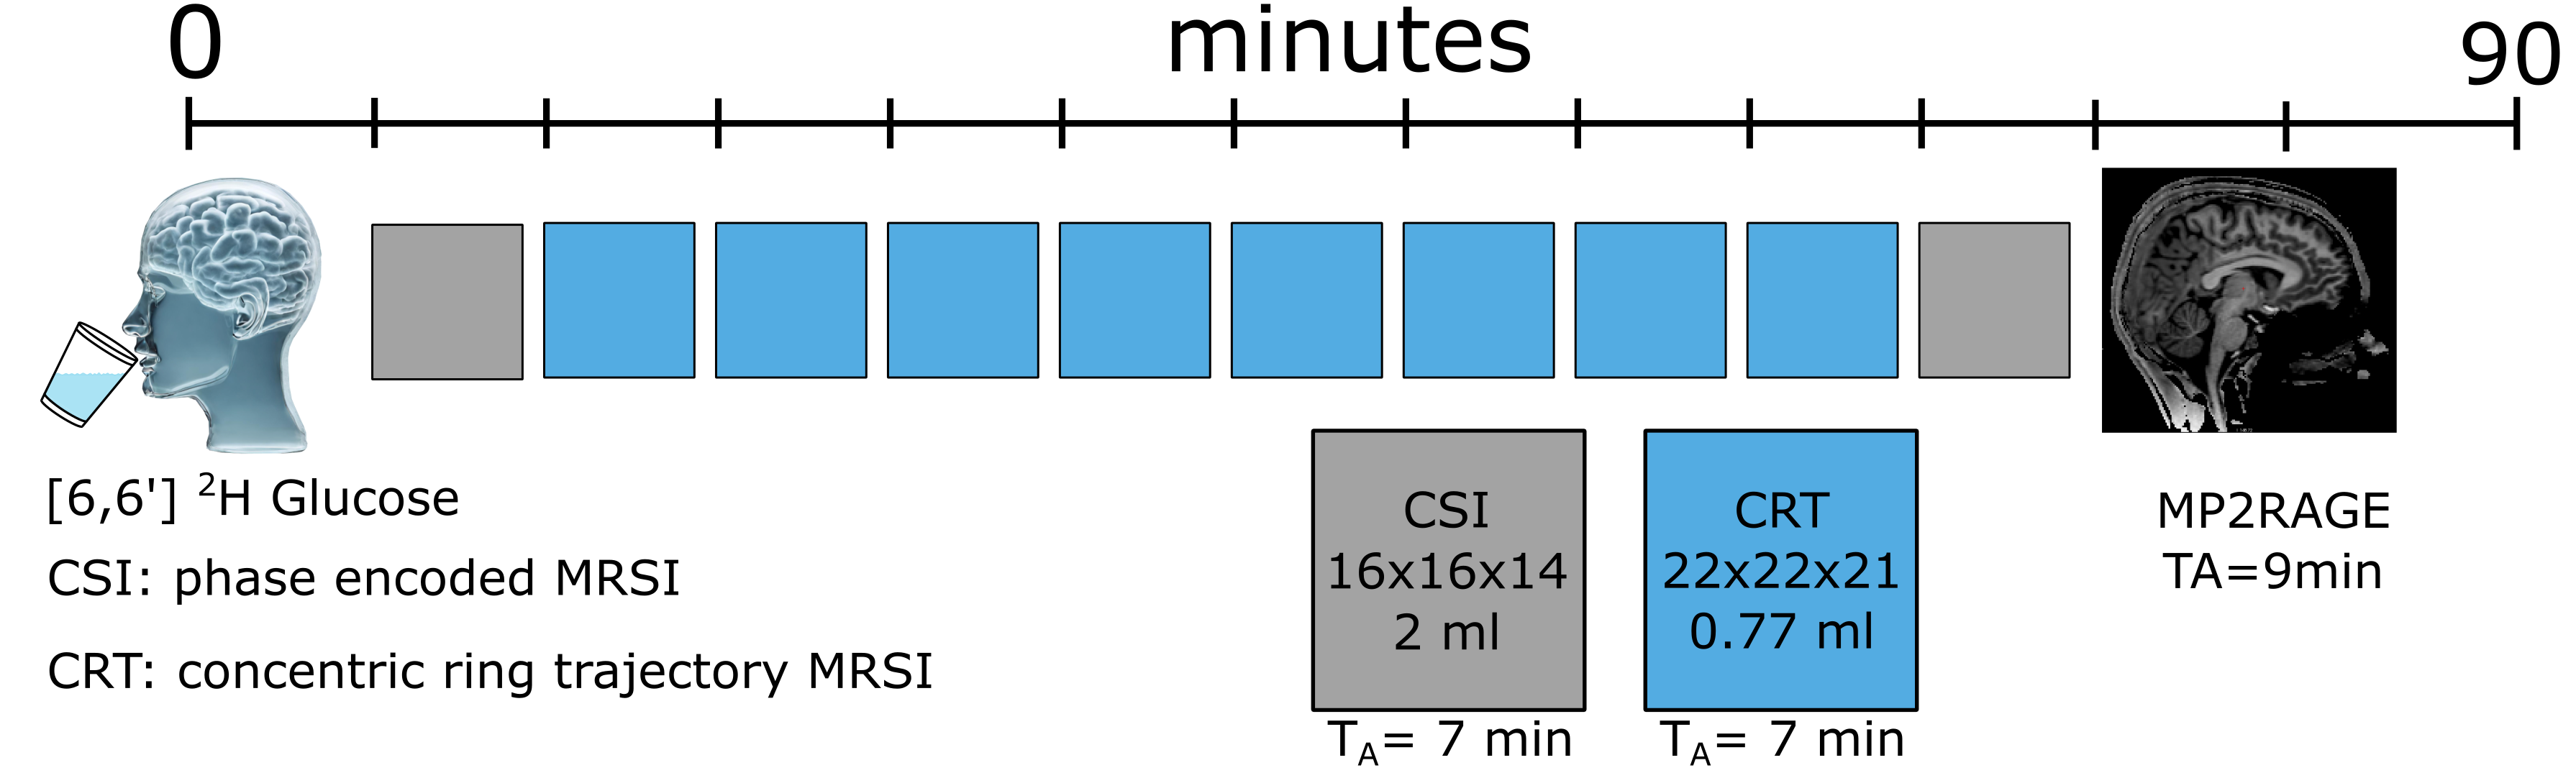
All measurements were performed on an experimental 7T (Terra-dot-Plus) Siemens MR system using a dual-tuned quadrature birdcage head-coil (Stark Contrasts MRI). Six healthy volunteers were scanned (4m/2f) in the morning after overnight fasting and oral [6,6’]-2H glucose administration (0.8 g/kg body weight). Approximately ∼7min after glucose uptake ten whole brain 2H FID-MRSI scans were measured over ∼70 min to acquire metabolic maps of deuterium labeled water, Glc and Glx, see Figure1. Two datasets (first and last time point) were acquired using elliptical phase encoding (CSI) with ∼2ml isotropic resolution (matrix: 16x16x14, FOV:200x200x175mm)(10). Eight datasets (second to eighth time point) were acquired using density-weighted concentric ring trajectories (CRT) (7) with ∼0.77ml isotropic resolution (matrix: 22x22x21, FOV: 200x200x192, Ncircles=43). Following MRSI acquisitions high-resolution anatomical images were acquired (MP2RAGE) for tissue segmentation considering partial volume effects. Data reconstruction and fitting was performed using in-house post-processing (MATLAB R2021, LCModel, Python3.10). To investigate the dynamics of deuterium labeled substrates, Glc and Glx concentrations were regionally averaged over gray (GM) and white matter (WM) regions (threshold CSI>55%, CRT>65%) and across subjects for each time point. To improve the signal-to-noise-ratio (SNR) for CRT data global low-rank denoising was performed using singular value decomposition with modified data shape. Concentration estimation was performed using natural abundance water as internal reference(11) assuming relaxation times and in vivo concentrations from literature(12,13) (2H: water: T1GM/T1WM/T2=350/290/30ms, GlxT1/T2=150/40ms, GlcT1/T2=67/42ms, 2H water concentration: 17.2mM) and considering 40% label loss for Glx(14).Results
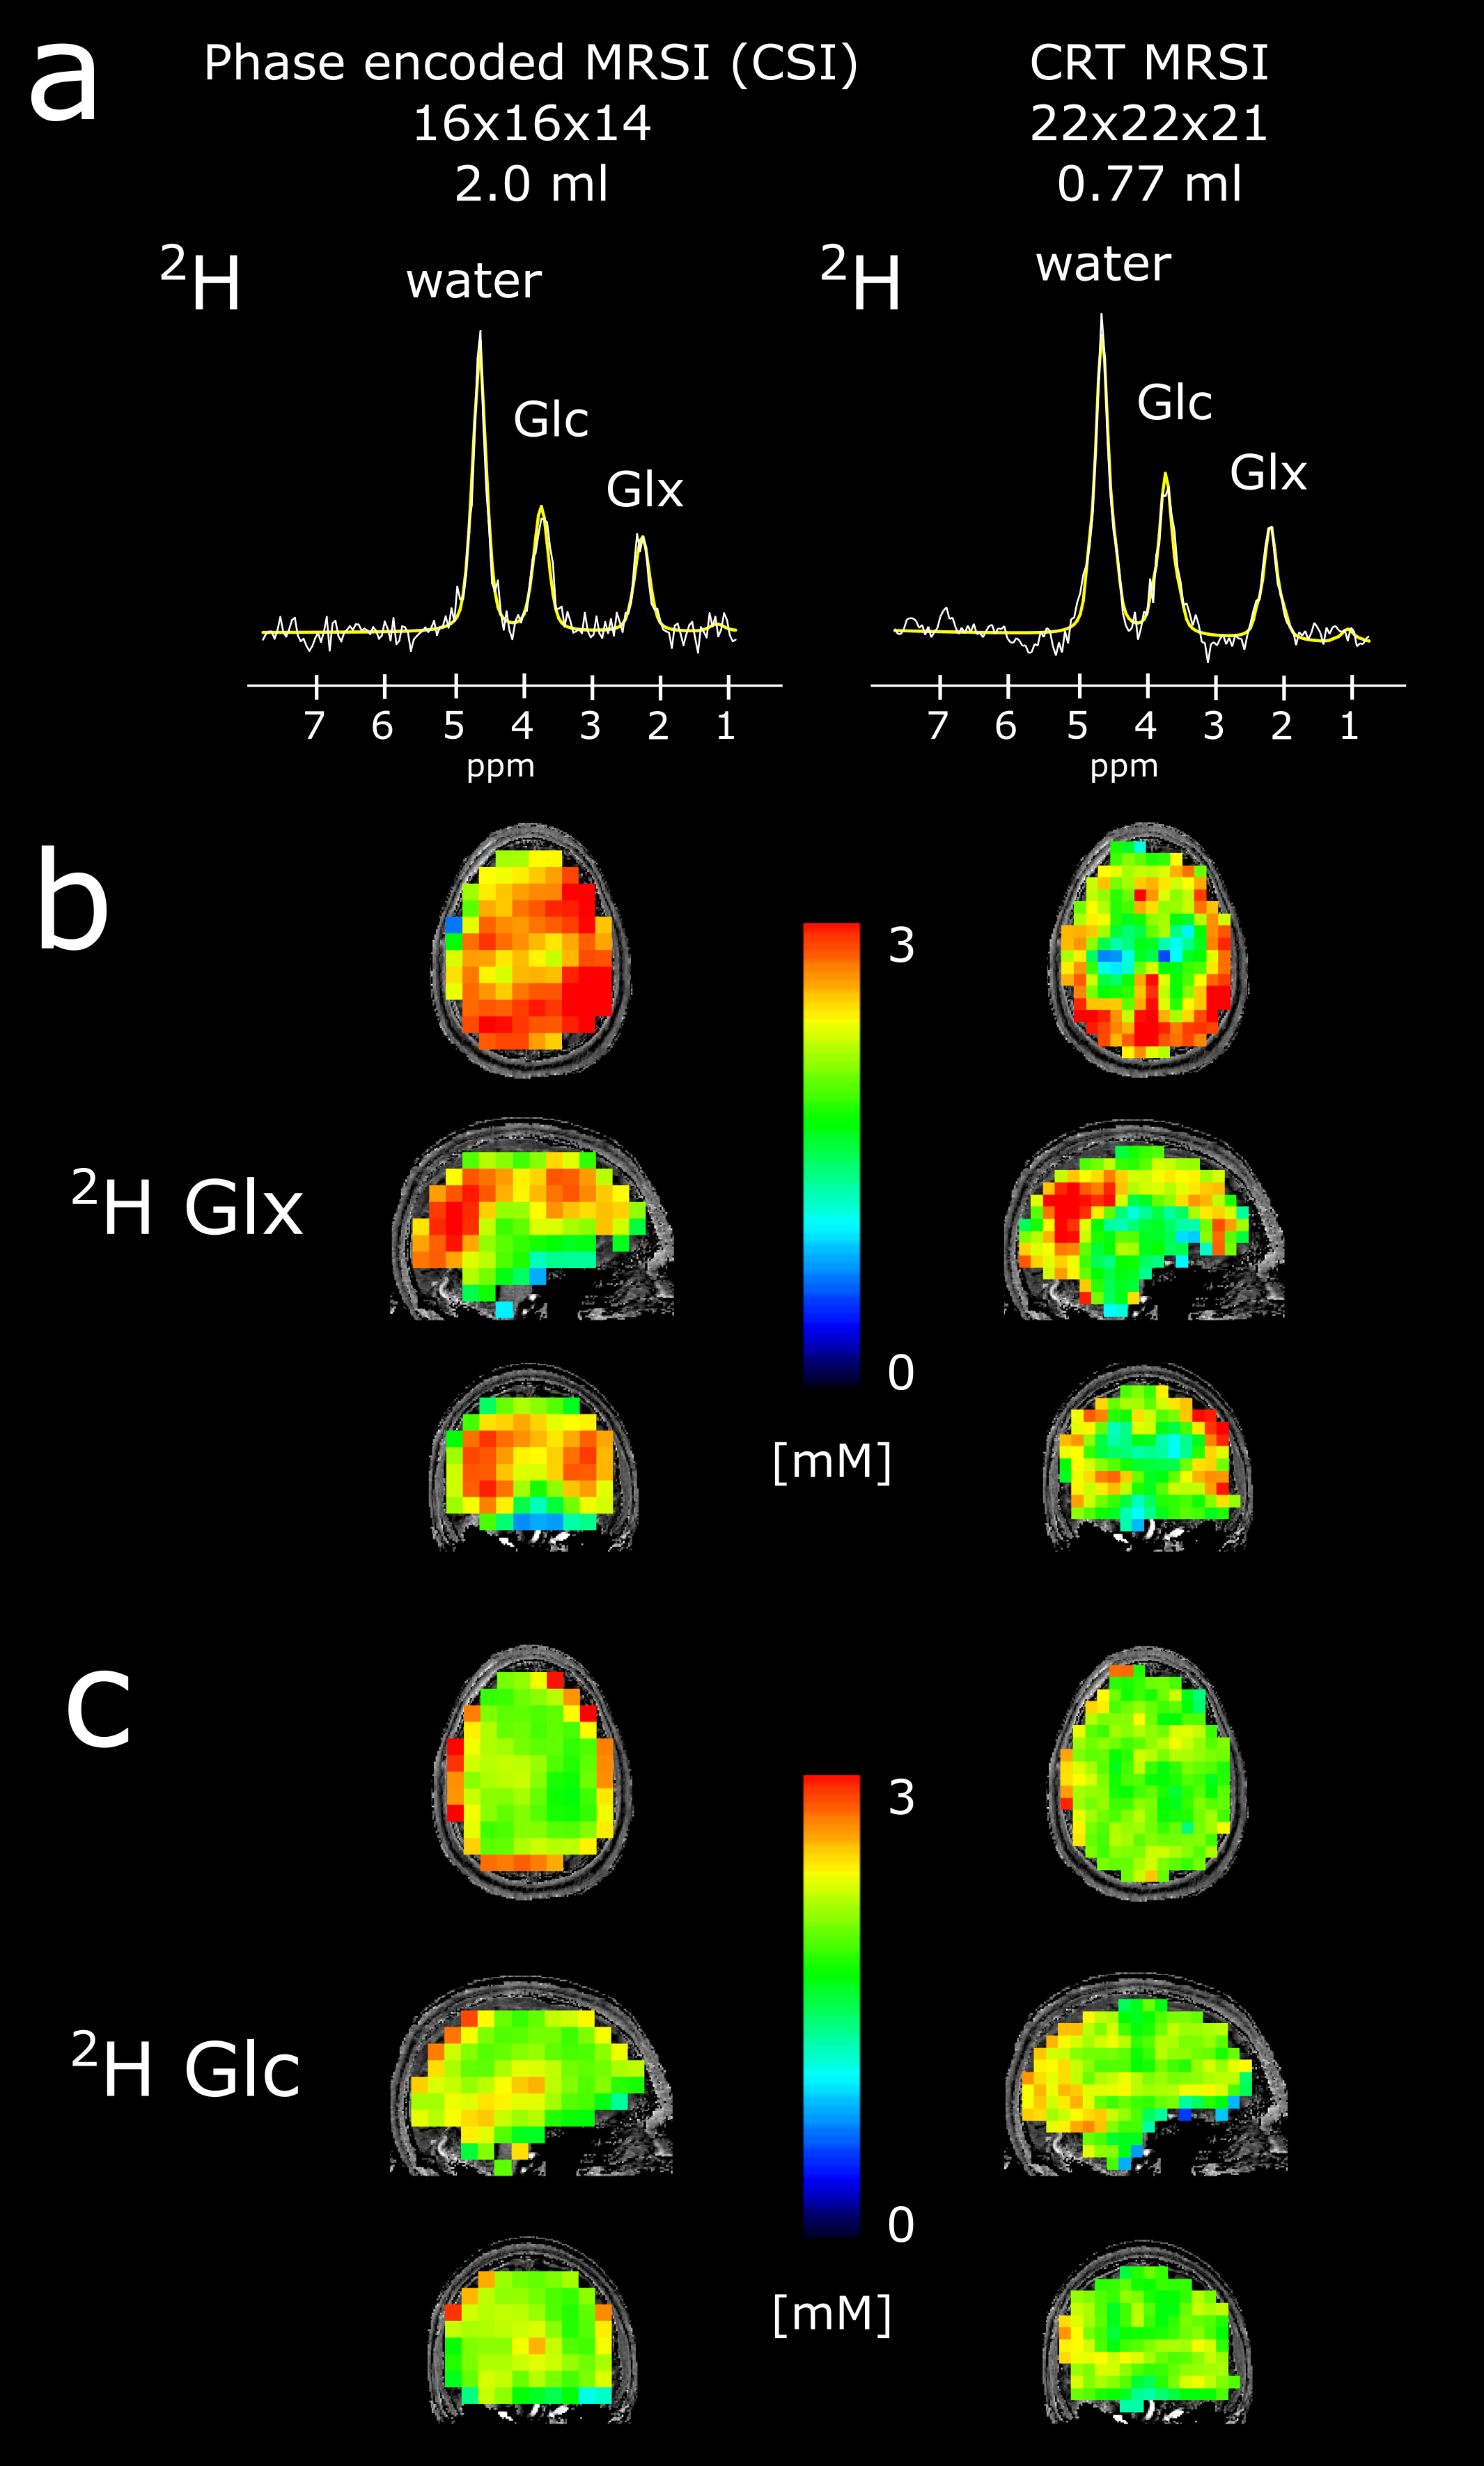
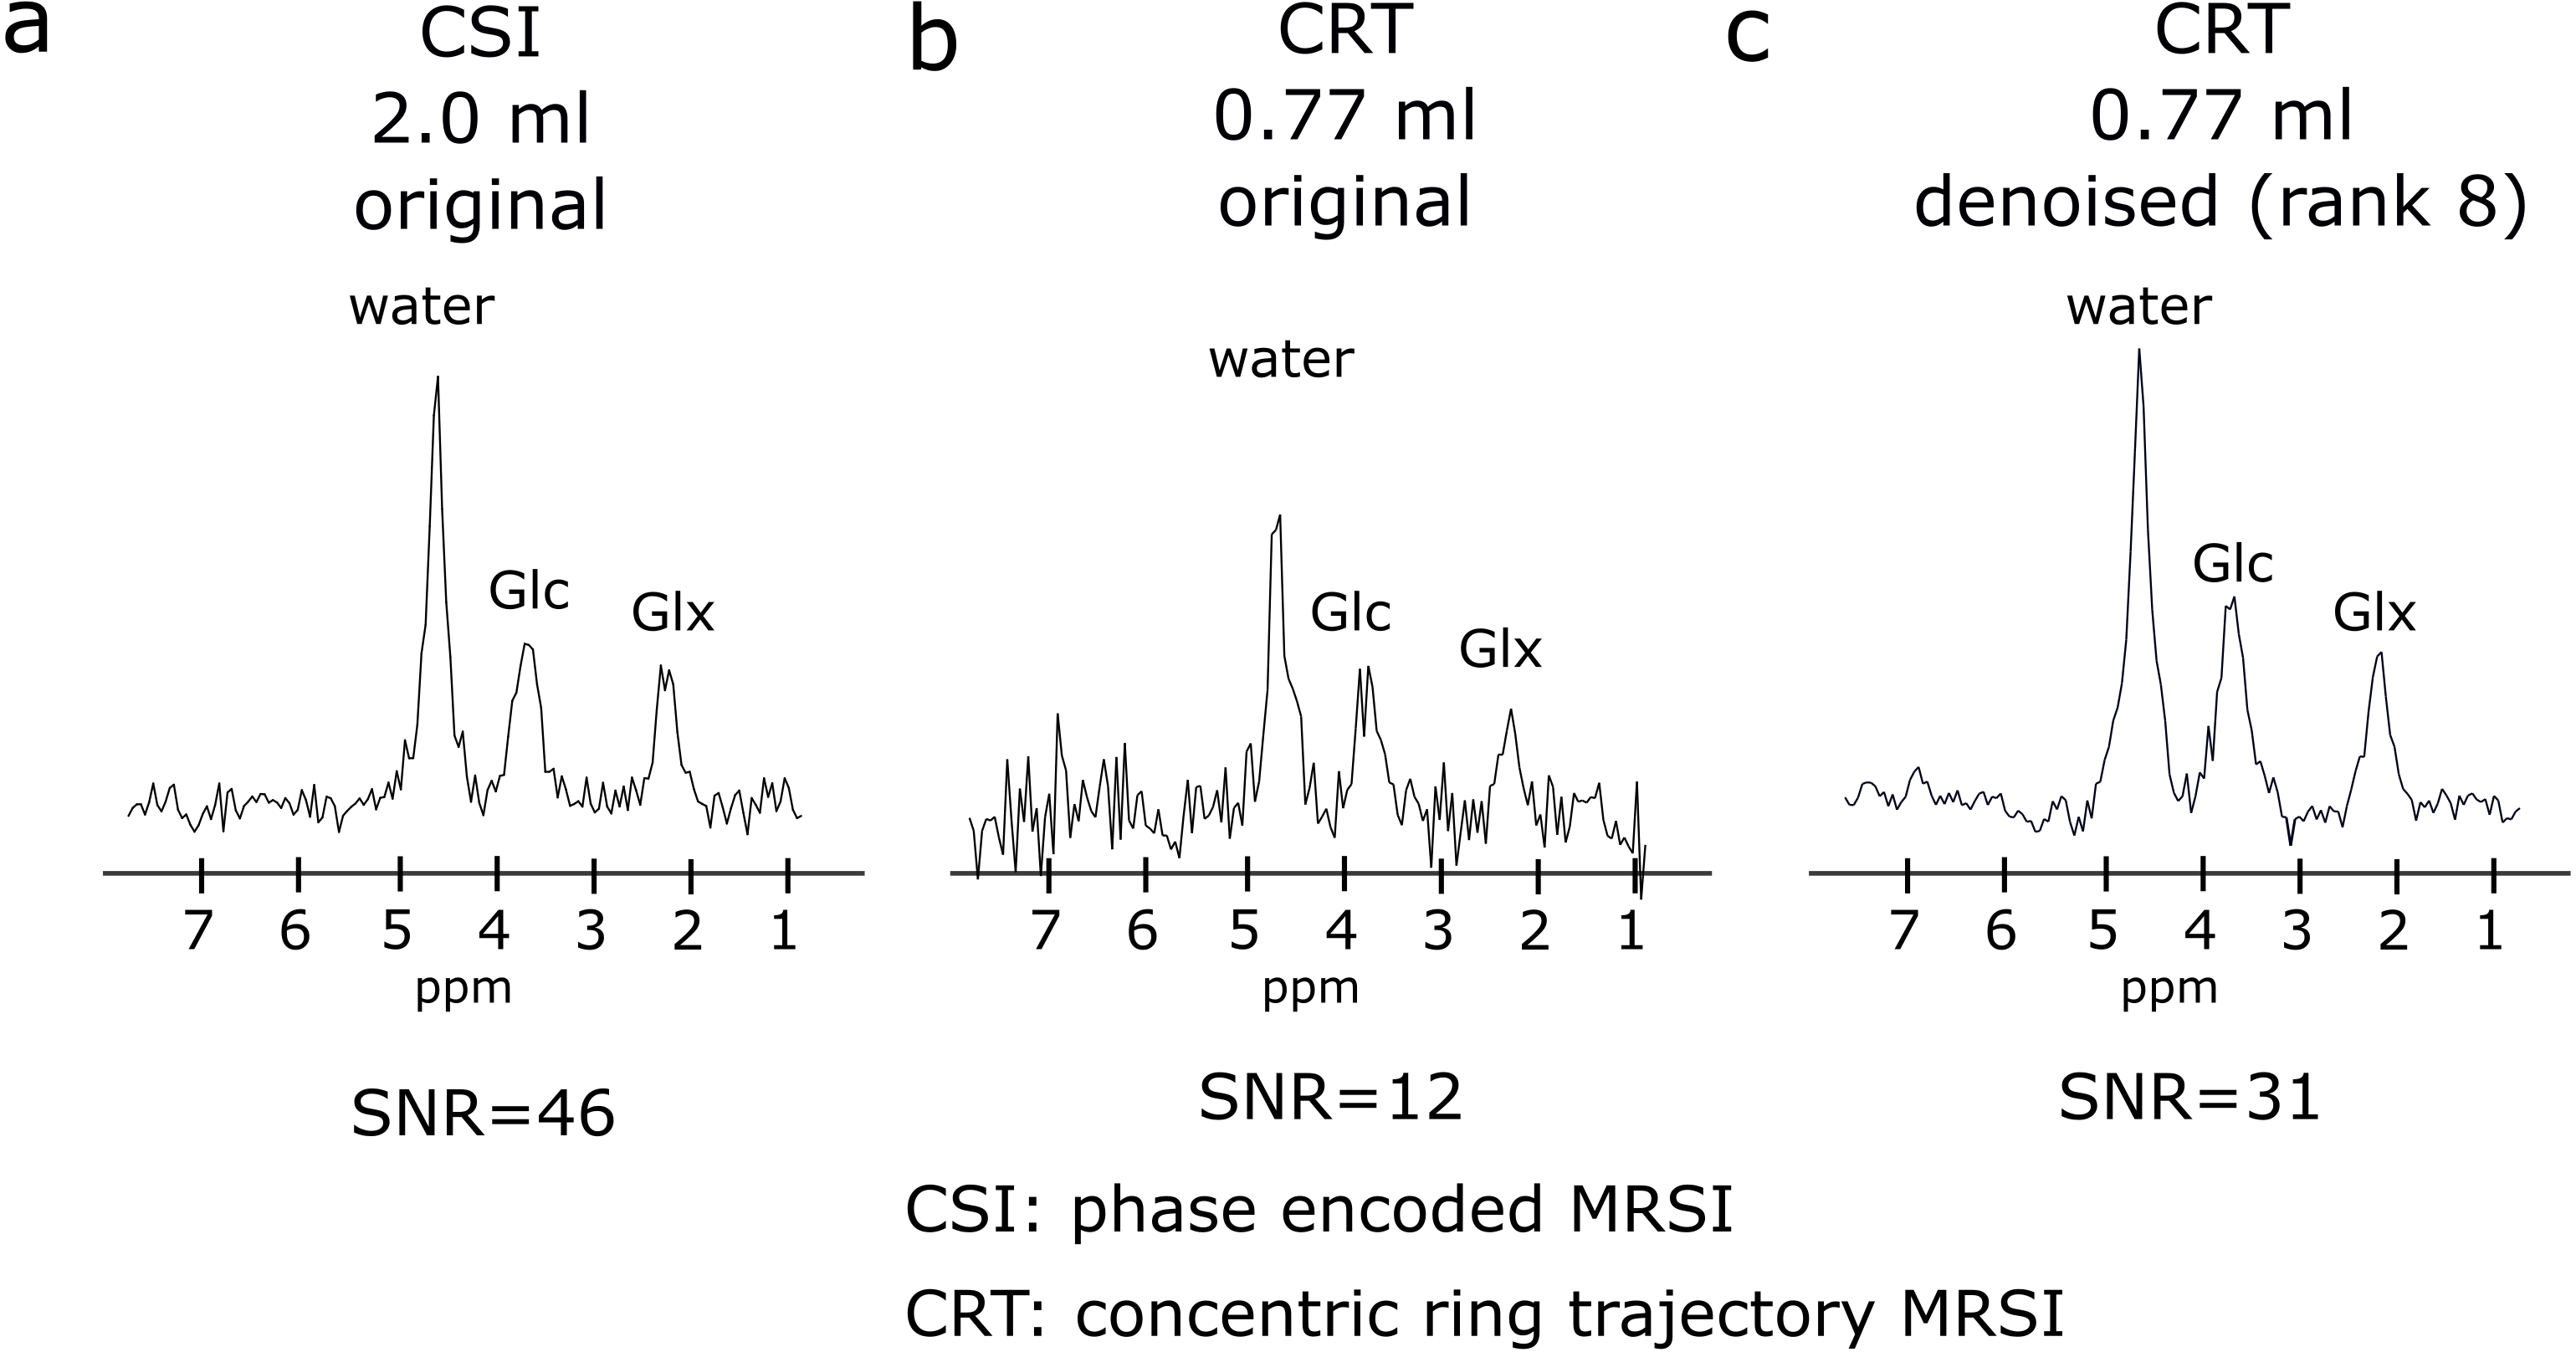
DMI data acquired using CSI achieved SNR (water amplitude/SD of noise) of 27±2 on average. DMI data acquired using CRT achieved initially an SNR of 12±1 and increased significantly (p<0.01) following denoising to 34±4. Representative sample spectra and 3D metabolic maps of 2H Glx and Glc from the last time point (∼77min after tracer uptake) acquired using CSI and CRT sequences are illustrated in Figure2. Time courses of Glx and Glc concentrations regionally averaged over GM and WM and across subjects for CSI and CRT measurements are shown in Figure3. Significantly higher Glx (+33 %,p<0.01) and Glc (+9%,p<0.01) concentrations were observed in GM compared to WM regions for CRT maps while no significant regional differences were observed for CSI maps. Increased GM/WM contrast for CRT maps of Glx is also visually discernible, see Figure2b.Discussion and Conclusion
In this study we successfully implemented 3D FID-MRSI with fast concentric ring trajectory readout (CRT) for whole brain DMI. Using CRT, a 2.5-fold higher spatial resolution could be achieved for metabolic maps of Glc, Glx and water compared to conventional CSI approaches for similar scan durations (7min). While CRT maps of Glx and Glc revealed increased regional contrast i.e., higher concentrations in GM compared to WM dominated regions, no significant differences could be observed for CSI maps. Our results are in excellent agreement with literature as faster metabolic activity has been reported in GM compared to WM dominated regions (TCA cycle rates 68% higher)(15-17), while differences of absolute steady-state glucose levels have been reported to be smaller and comparable in GM and WM due to similar ratios of glucose transport and utilization(18,19). Although the spatial resolution has been significantly improved, the point spread function is still not optimal and increases the effective voxel size causing significant partial volume effects. This could explain that GM/WM contrast of Glx reported in this study (33%) is lower than reported in literature. The CRT acquisition scheme allows for even higher spatial resolutions compared to the current protocol, but is ultimately limited by the inherently low SNR of deuterium labeled metabolites. This could be further improved in future studies by more efficient sampling schemes and better denoising algorithms.Acknowledgements
Austrian Science Fund: KLI 1106, WEAVE I 6037
Christian Doppler Laboratoy for MR Imaging Biomarkers (BIOMAK)
References
1. De Feyter HM, Behar KL, Corbin ZA, Fulbright RK, Brown PB, McIntyre S, Nixon TW, Rothman DL, de Graaf RA. Deuterium metabolic imaging (DMI) for MRI-based 3D mapping of metabolism in vivo. Sci Adv 2018;4(8):eaat7314.
2. De Feyter HM, de Graaf RA. Deuterium metabolic imaging - Back to the future. J Magn Reson 2021;326:106932.
3. Lu M, Zhu XH, Zhang Y, Mateescu G, Chen W. Quantitative assessment of brain glucose metabolic rates using in vivo deuterium magnetic resonance spectroscopy. J Cereb Blood Flow Metab 2017;37(11):3518-3530.
4. Koppenol WH, Bounds PL, Dang CV. Otto Warburg's contributions to current concepts of cancer metabolism. Nat Rev Cancer 2011;11(5):325-337.
5. Manji H, Kato T, Di Prospero NA, Ness S, Beal MF, Krams M, Chen G. Impaired mitochondrial function in psychiatric disorders. Nature Reviews Neuroscience 2012;13(5):293-307.
6. Norat P, Soldozy S, Sokolowski JD, Gorick CM, Kumar JS, Chae Y, Yagmurlu K, Prada F, Walker M, Levitt MR, Price RJ, Tvrdik P, Kalani MYS. Mitochondrial dysfunction in neurological disorders: Exploring mitochondrial transplantation. NPJ Regen Med 2020;5(1):22.
7. Clarke WT, Hingerl L, Strasser B, Bogner W, Valkovic L, Rodgers CT. Three-dimensional, 2.5-minute, 7T phosphorus magnetic resonance spectroscopic imaging of the human heart using concentric rings. NMR Biomed 2023;36(1):e4813.
8. Hingerl L, Bogner W, Moser P, Povazan M, Hangel G, Heckova E, Gruber S, Trattnig S, Strasser B. Density-weighted concentric circle trajectories for high resolution brain magnetic resonance spectroscopic imaging at 7T. Magn Reson Med 2018;79(6):2874-2885.
9. Moser P, Eckstein K, Hingerl L, Weber M, Motyka S, Strasser B, van der Kouwe A, Robinson S, Trattnig S, Bogner W. Intra-session and inter-subject variability of 3D-FID-MRSI using single-echo volumetric EPI navigators at 3T. Magn Reson Med 2020;83(6):1920-1929.
10. Niess F, Strasser B, Hingerl L, Niess E, Motyka S, Hangel G, Krssak M, Gruber S, Spurny-Dworak B, Trattnig S, Scherer T, Lanzenberger R, Bogner W. Reproducibility of 3D MRSI for imaging human brain glucose metabolism using direct ((2)H) and indirect ((1)H) detection of deuterium labeled compounds at 7T and clinical 3T. Neuroimage 2023;277:120250.
11. Gasparovic C, Song T, Devier D, Bockholt HJ, Caprihan A, Mullins PG, Posse S, Jung RE, Morrison LA. Use of tissue water as a concentration reference for proton spectroscopic imaging. Magn Reson Med 2006;55(6):1219-1226.
12. Cocking D, Damion RA, Franks H, Jaconelli M, Wilkinson D, Brook M, Auer DP, Bowtell R. Deuterium brain imaging at 7T during D(2) O dosing. Magn Reson Med 2023;89(4):1514-1521.
13. Seres Roig E, De Feyter HM, Nixon TW, Ruhm L, Nikulin AV, Scheffler K, Avdievich NI, Henning A, de Graaf RA. Deuterium metabolic imaging of the human brain in vivo at 7 T. Magn Reson Med 2023;89(1):29-39.
14. de Graaf RA, Thomas MA, Behar KL, De Feyter HM. Characterization of Kinetic Isotope Effects and Label Loss in Deuterium-Based Isotopic Labeling Studies. ACS Chem Neurosci 2021;12(1):234-243.
15. Hyder F, Fulbright RK, Shulman RG, Rothman DL. Glutamatergic function in the resting awake human brain is supported by uniformly high oxidative energy. J Cereb Blood Flow Metab 2013;33(3):339-347.
16. Pan JW, Stein DT, Telang F, Lee JH, Shen J, Brown P, Cline G, Mason GF, Shulman GI, Rothman DL, Hetherington HP. Spectroscopic imaging of glutamate C4 turnover in human brain. Magn Reson Med 2000;44(5):673-679.
17. Yu Y, Herman P, Rothman DL, Agarwal D, Hyder F. Evaluating the gray and white matter energy budgets of human brain function. J Cereb Blood Flow Metab 2018;38(8):1339-1353.
18. de Graaf RA, Pan JW, Telang F, Lee JH, Brown P, Novotny EJ, Hetherington HP, Rothman DL. Differentiation of glucose transport in human brain gray and white matter. J Cereb Blood Flow Metab 2001;21(5):483-492.
19. Hawkins RA, Mans AM, Davis DW, Hibbard LS, Lu DM. Glucose availability to individual cerebral structures is correlated to glucose metabolism. J Neurochem 1983;40(4):1013-1018.
Figures