3030
A Novel Method to Estimate 23Na Triple Quantum (TQ) Signal: Spin Echo Sequence, Impact of Noise and Proof-of-Concept Imaging1Computer Assisted Clinical Medicine, Medical Faculty Mannheim, Heidelberg University, Germany, Mannheim, Germany, 2Mannheim Institute for Intelligent Systems in Medicine, Medical Faculty Mannheim, Heidelberg University, Mannheim, Germany, Mannheim, Germany, 3Cooperative Core Facility Animal Scanner ZI, Medical Faculty Mannheim, Heidelberg University, Mannheim, Germany, Mannheim, Germany
Synopsis
Keywords: Non-Proton, Non-Proton, 23Na, Sodium, Triple Quantum (TQ)
Motivation: Sodium TQ-signal is potential viable biomarker for cell viability. However, TQ acquisition requires phase-cycling sequences with long scan times, which currently hinder clinical application.
Goal(s): We present a novel method to estimate the TQ-signal directly from the FID without phase-cycling.
Approach: Compare the our method's TQ-signal with the TQTPPI sequence and theoretical prediction. Investigate the impact of noisy data on our method and provide a proof-of-concept imaging sequence.
Results: The TQ-signal of our method was in close agreement with the TQTPPI TQ-signal and the theoretical prediction. Even for low SNR, our method performed well. Proof-of-concept imaging with our method was successfully demonstrated.
Impact: With our method scan time of sodium TQ imaging can be dramatically reduced. This approach may expand TQ imaging applications and thus may leverage the full potential of sodium TQ signal.
Introduction
The sodium triple quantum (TQ) signal is a potential biomarker for cell viability1,2. However, complicated multi-pulse phase cycling sequences, like the TQTPPI3 sequence, have long scan times for the sodium TQ-signal. This limits the application of the TQ-signal for clinical imaging.We recently proposed a novel method to estimate the TQ signal using only a single-pulse sequence4. The TQ signal of this method was in close agreement with the theoretical prediction. However, comparison to the TQTPPI sequence showed deviations since the single-pulse FID decays with T2* relaxation times while the TQTPPI FID decays with the T2 relaxation times. Moreover, there was an unexplained residual TQ signal for a 0% agar sample.
Building on this, in this study, we generalize this method to every equidistantly sampled FID. For a better comparison with the TQTPPI sequence, we apply the method to the FIDs of a spin echo sequence. We investigate the accuracy of the method in low SNR scenarios. Moreover, we demonstrate the applicability of the method to multi-echo radial imaging sequence.
Material and Methods
The sodium FID after excitation and a subsequent evolution period $$$\tau_{evo}$$$ can be described by$$FID(\tau_{evo},t)=A_{SQ}(\tau_{evo})f_{11}^{(1)}(t)+A_{TQ}(\tau_{evo})f_{13}^{(1)}(t),~~~[1]$$
where
$$f_{11}^{(1)}(t)=0.4\exp(-\frac{t}{T_{2s}})+0.6\exp(-\frac{t}{T_{2f}})~~~[2]$$
$$f_{13}^{(1)}(t)=\frac{\sqrt{6}}{5}\left(\exp(-\frac{t}{T_{2s}})-\exp(-\frac{t}{T_{2f}})\right)~~~[3]$$
and $$$A_{SQ}(\tau_{evo})=0.4\exp(-\frac{\tau_{evo}}{T_{2s}})+0.6\exp(-\frac{\tau_{evo}}{T_{2f}})$$$ and $$$A_{TQ}(\tau_{evo})=\frac{\sqrt{6}}{5}\left(\exp(-\frac{\tau_{evo}}{T_{2s}})-\exp(-\frac{\tau_{evo}}{T_{2f}})\right)$$$ are the amplitudes of the SQ and TQ signals, respectively. Thus T31 coherences already contribute to the FID.
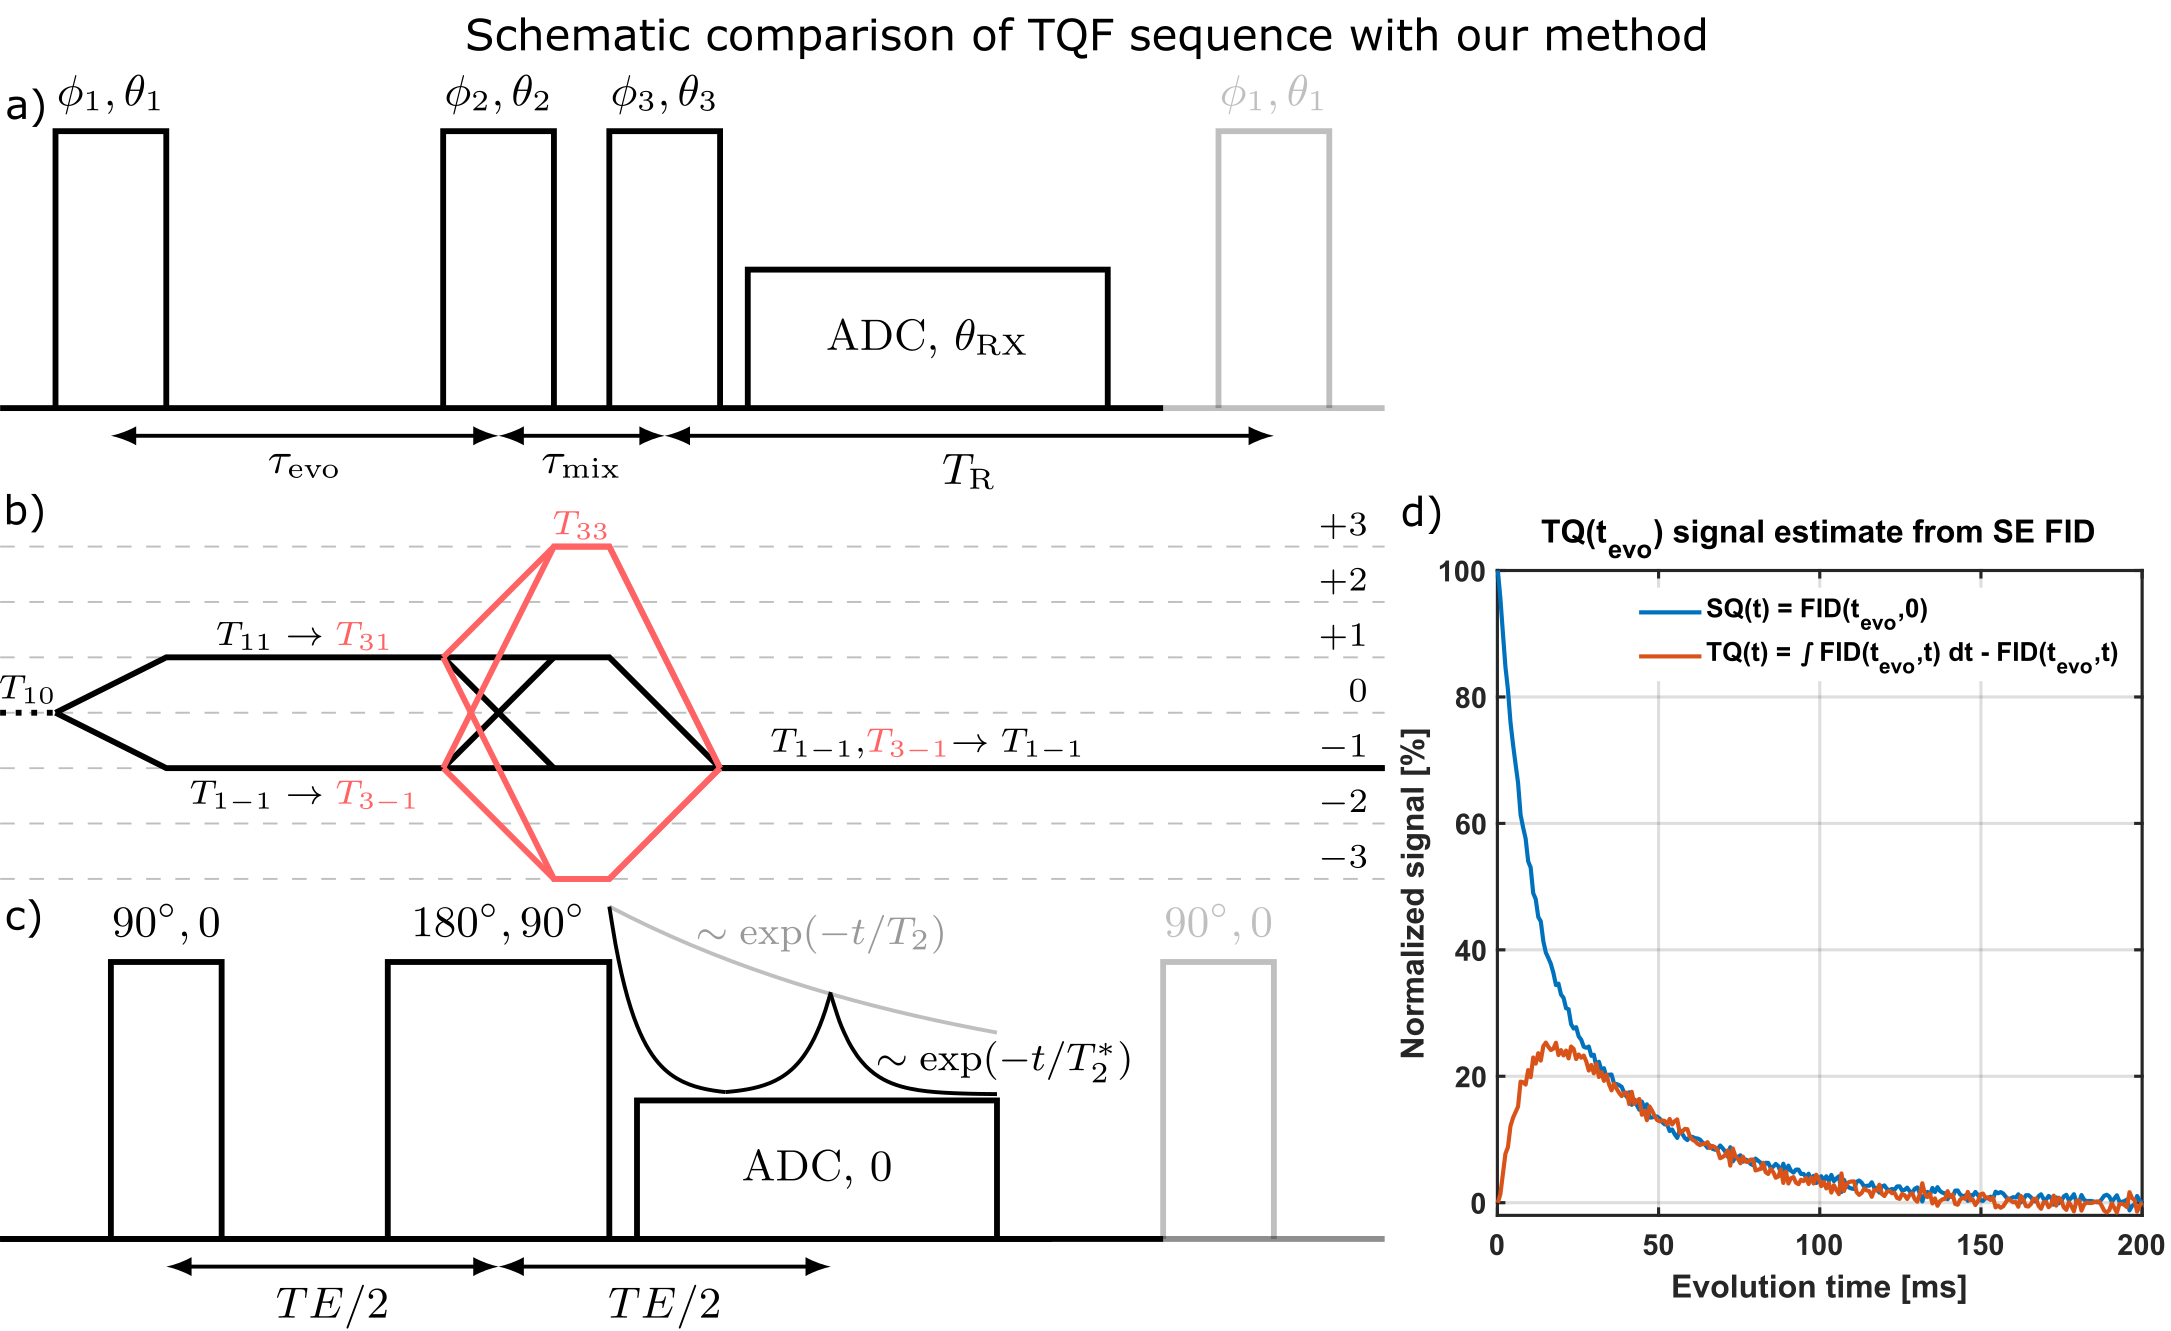
The steps of our method are shown in Fig.1. The TQ signal is then given by4
$$S_{TQ}(\tau_{evo})=\frac{\int_0^\infty~FID(t,\tau_{evo})dt}{\int_0^\infty~FID(t,0)dt}-\frac{\int_0^\infty~FT(FID(t,\tau_{evo}))(\omega,\tau_{evo}))d\omega}{\int_0^\infty~FT(FID(t,0))(\omega,0))d\omega}=\frac{\frac{\sqrt{6}}{5}(T_{2s}-T_{2f})}{A_sT_{2s}+A_fT_{2f}}~~~[4]$$
where the pre-factor
$$\frac{1}{Norm}=\frac{\frac{\sqrt{6}}{5}(T_{2s}-T_{2f})}{A_sT_{2s}+A_fT_{2f}}~~~[5]$$
is the inverse of the normalization factor between theory and our method.
Measurement data was acquired at a 9.4T preclinical MRI (Bruker Biospec 94/20) using a linear 1H/23Na Bruker volume coil. The samples contained 154mM NaCl and [0,2,4,6]% w/w agar. The SE sequence parameters were: TR=500ms, 256 echoes with an echo spacing of 0.78ms in the range [0.137,300]ms and 16 averages.Total acquisition duration of the single-pulse sequence was 45min per sample.
For comparison, we used the fixed-$$$\tau_{evo}$$$ TQTPPI3,5 with 26 different $$$\tau_{evo}$$$ times in the range of 0.1ms to 120ms. Total acquisition duration of the TQTPPI sequence was approximately 3h per sample.
For MR imaging, a multi-echo version of the ultra-short TE (UTE) sequence was used with 64 echoes, TEmin=0.09ms and ΔTE=3.78ms and , TR=300ms, number of averages NA=4, FoV=68x68x68mm3 spatial resolution of 2.125x2.125x2.125mm3, 3176 projections, a receiver bandwidth of 5kHz and a total acquisition duration of 1h3min. Our method was applied voxelvise to the FIDs.
Results/Discussion
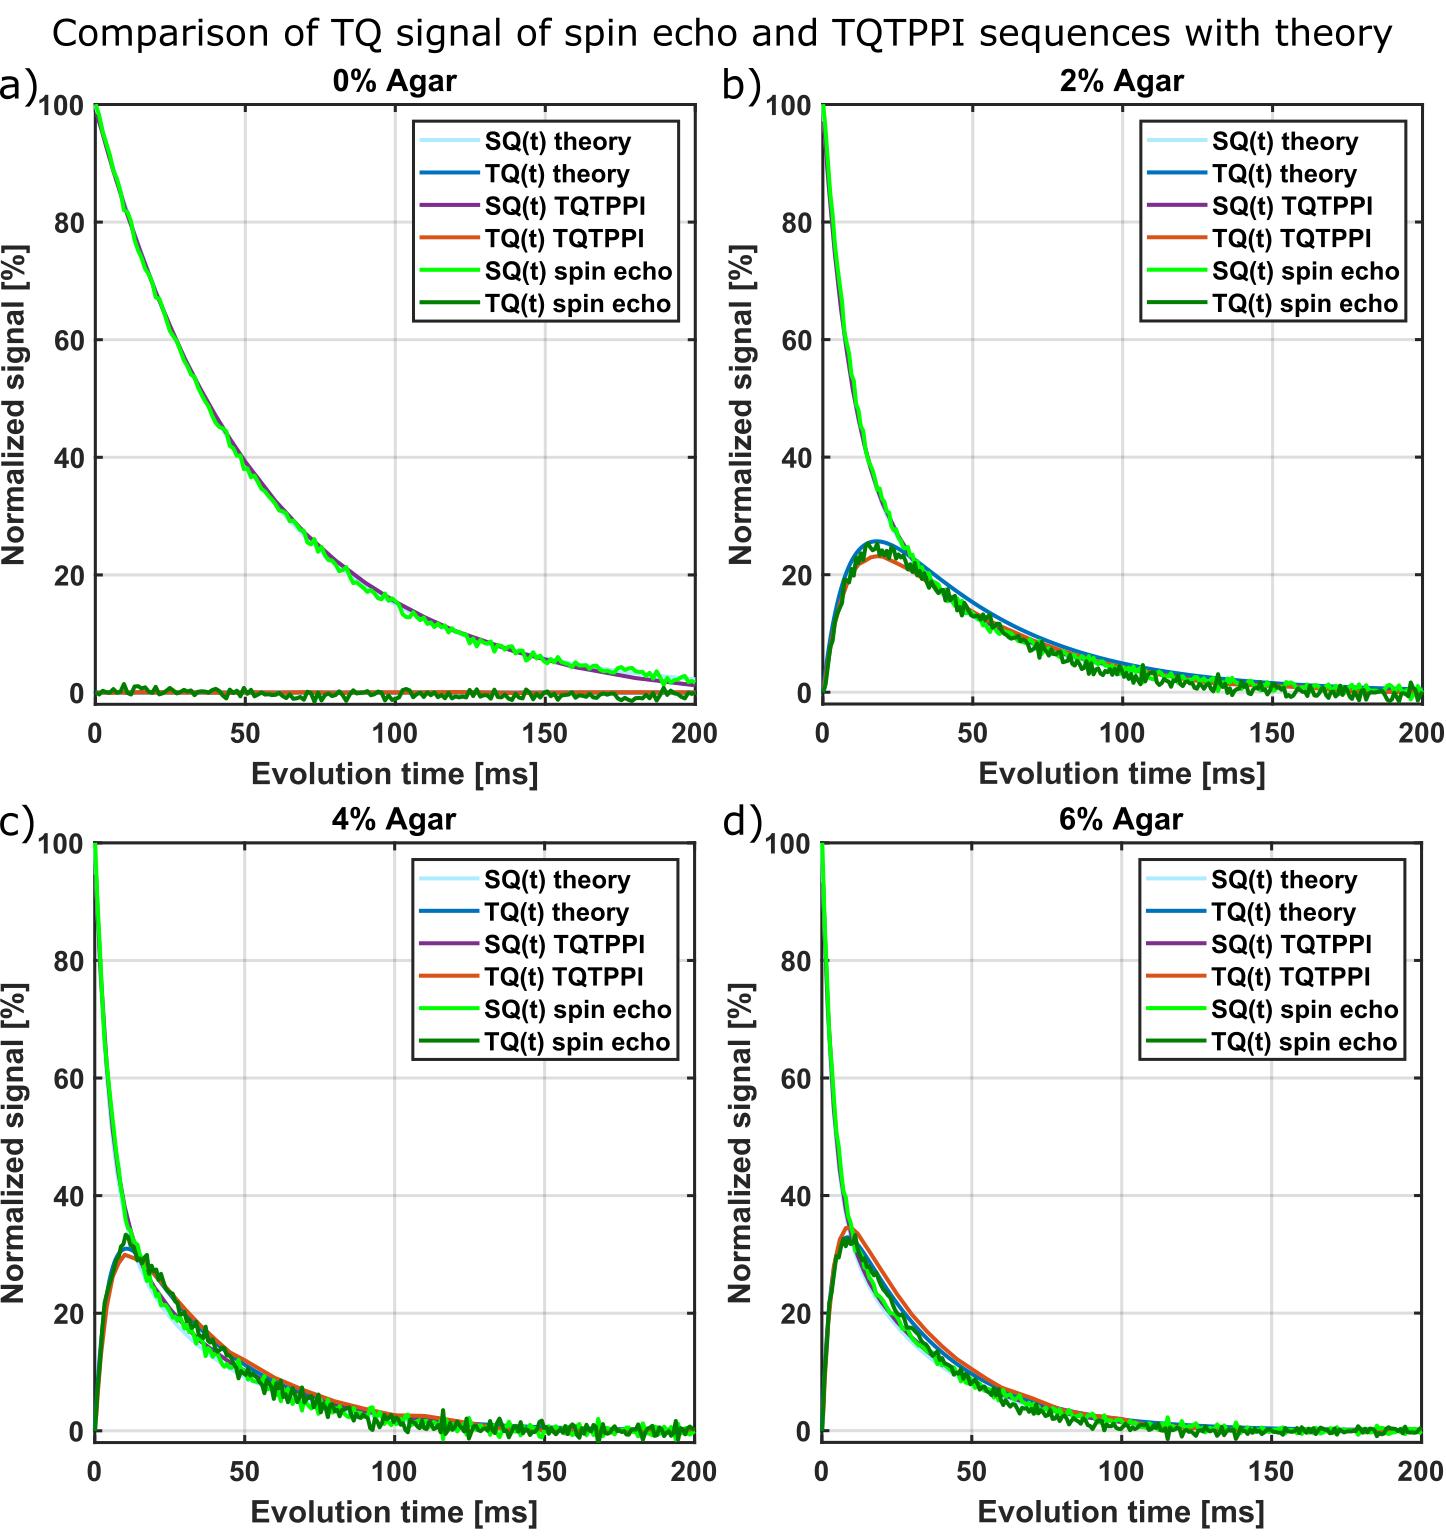
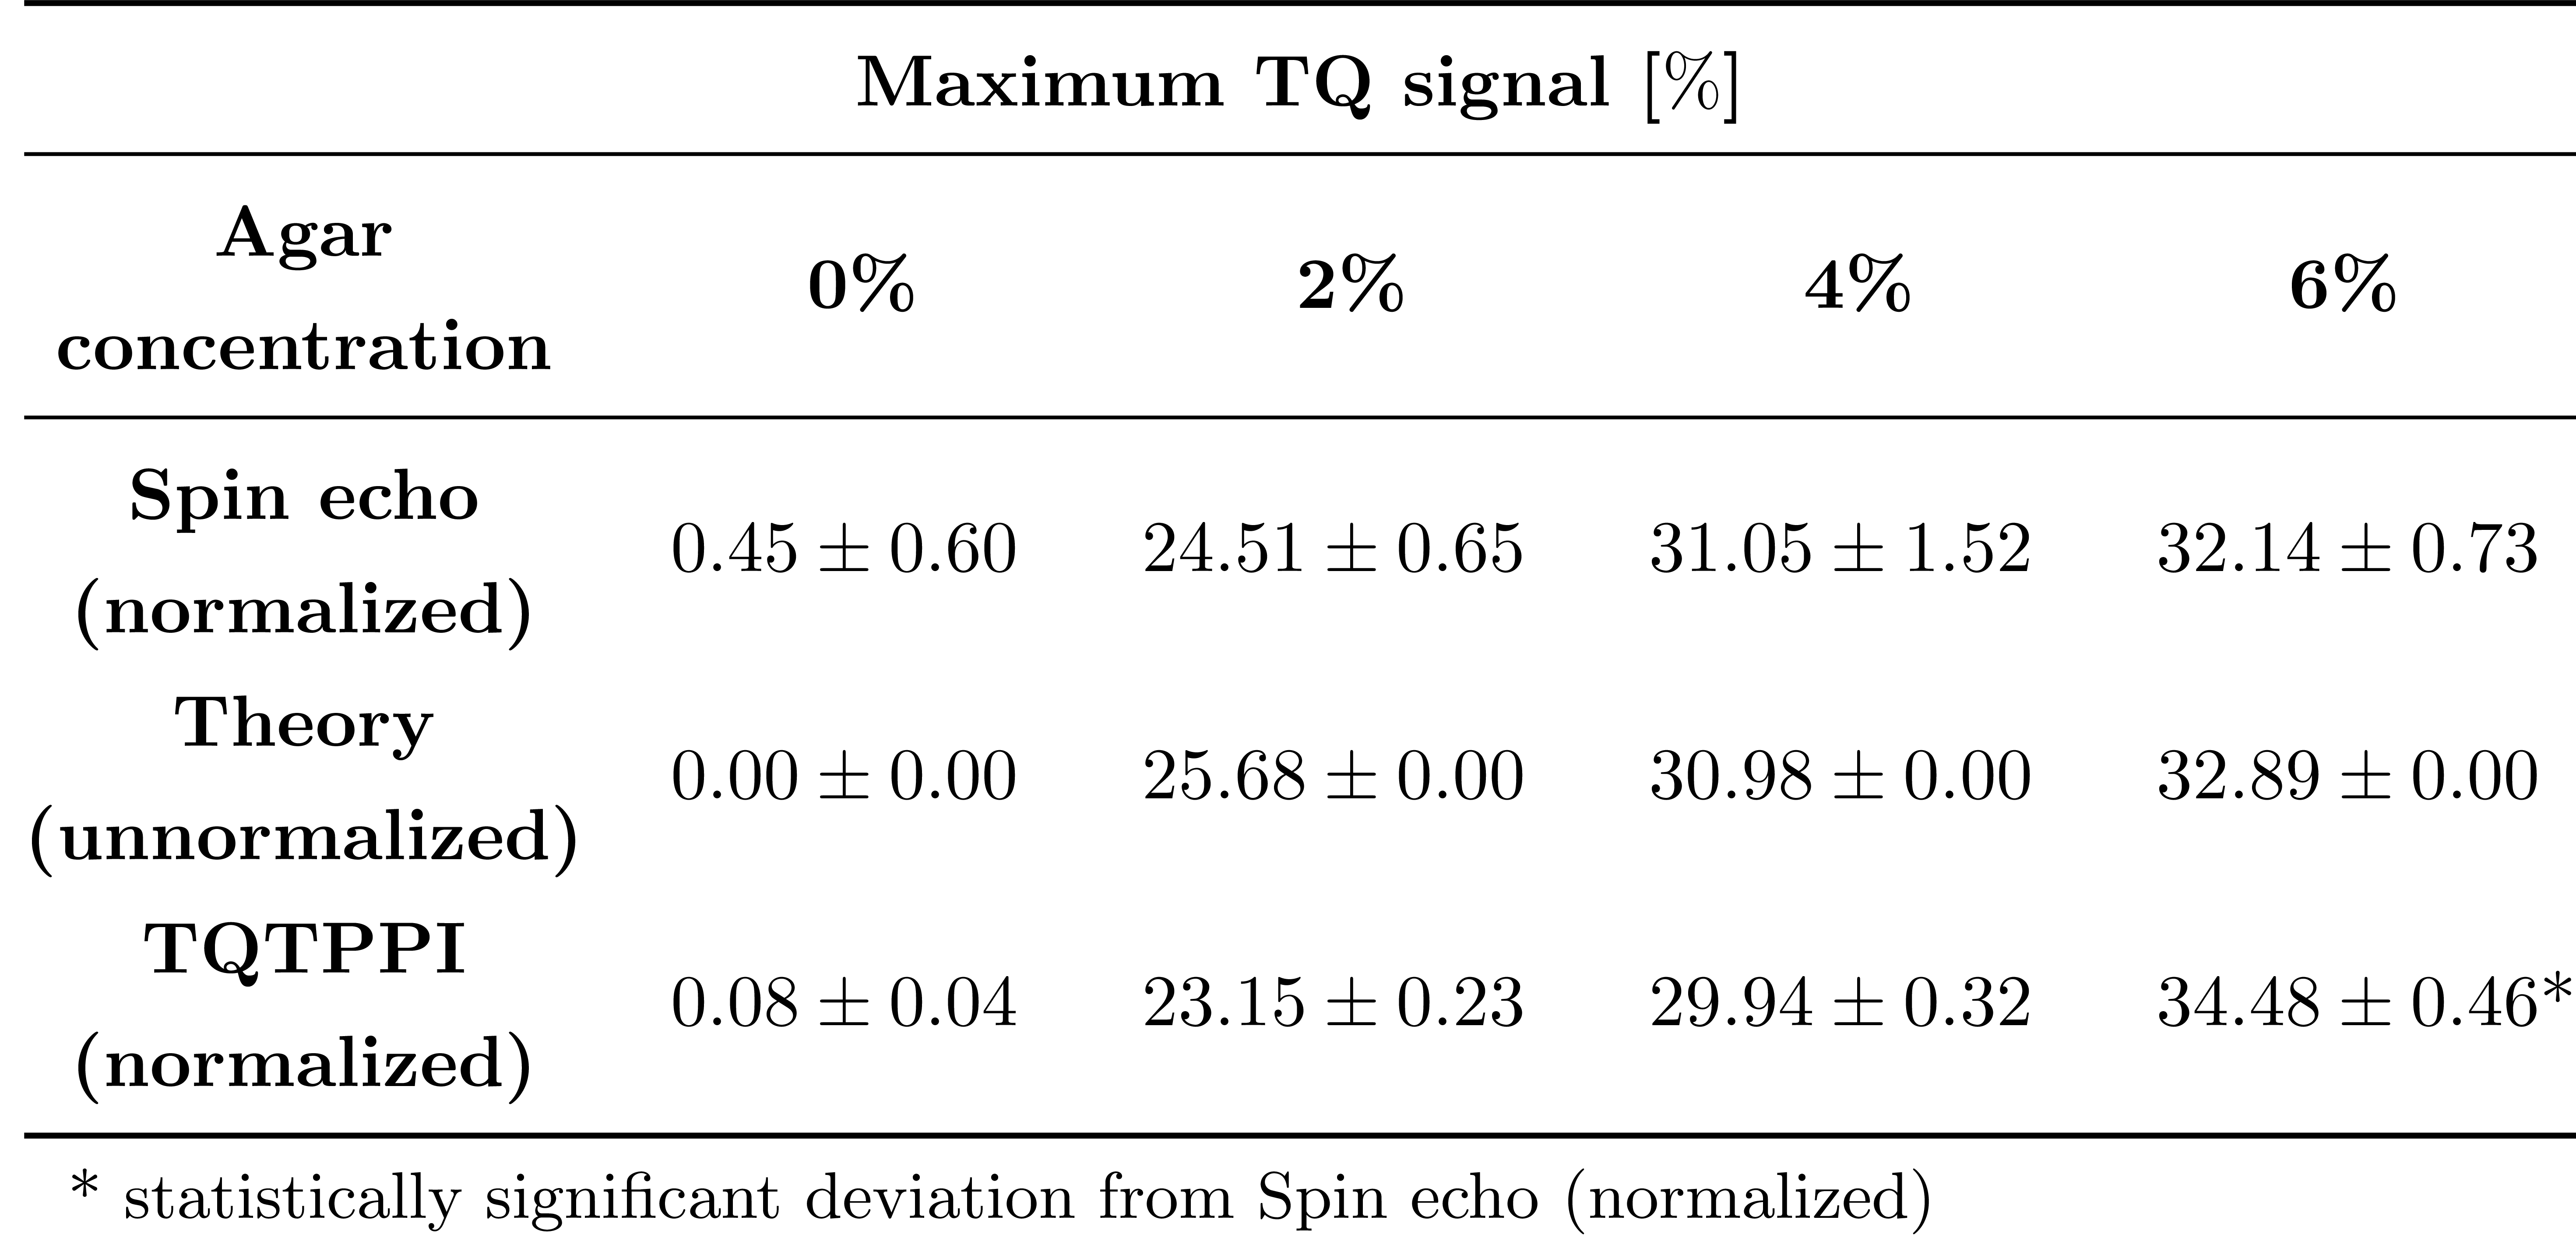
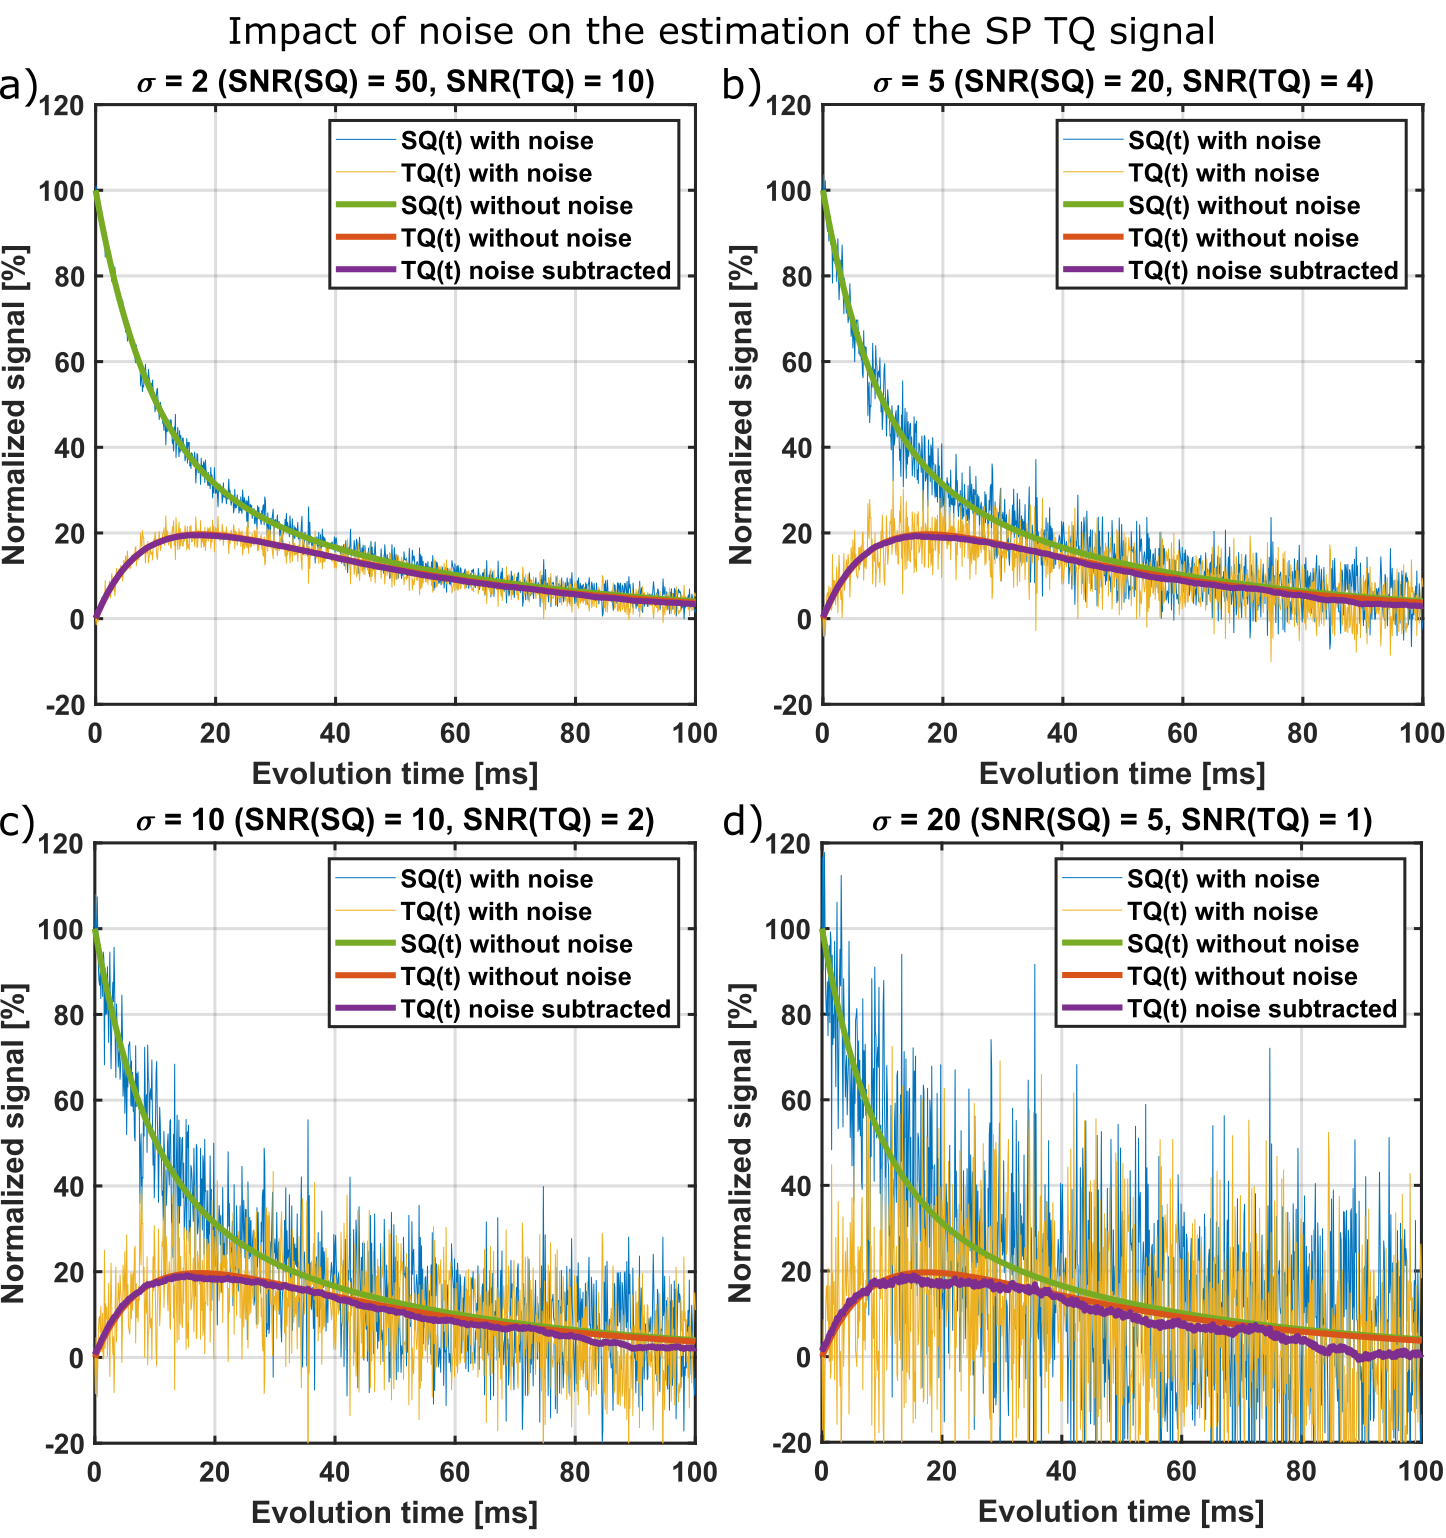
Fig.2 compares this method with the theoretical $$$f_{13}^{(1)}(\tau_{evo})$$$ using $$$T_{2s}$$$ and $$$T_{2f}$$$ from a bi-exponential fit of the FID and the TQTPPI sequence. For all samples and methods, the TQ signals were in close agreement. This is also reflected in the maximum TQ values in Tab.1. Only for the 6% agar sample, the deviation between our method and the TQTPPI sequence was statistically significant. Moreover, the 0% agar sample yielded a vanishing TQ signal as expected.Fig.3 shows the influence of noise on the accuracy of our method. Even for low SNRs, i.e. SQ SNR<10, the systematic error of the method was small for the relevant evolution times around the TQ maximum. Typical 23Na MRI SNR values are equal or larger than 106,7.
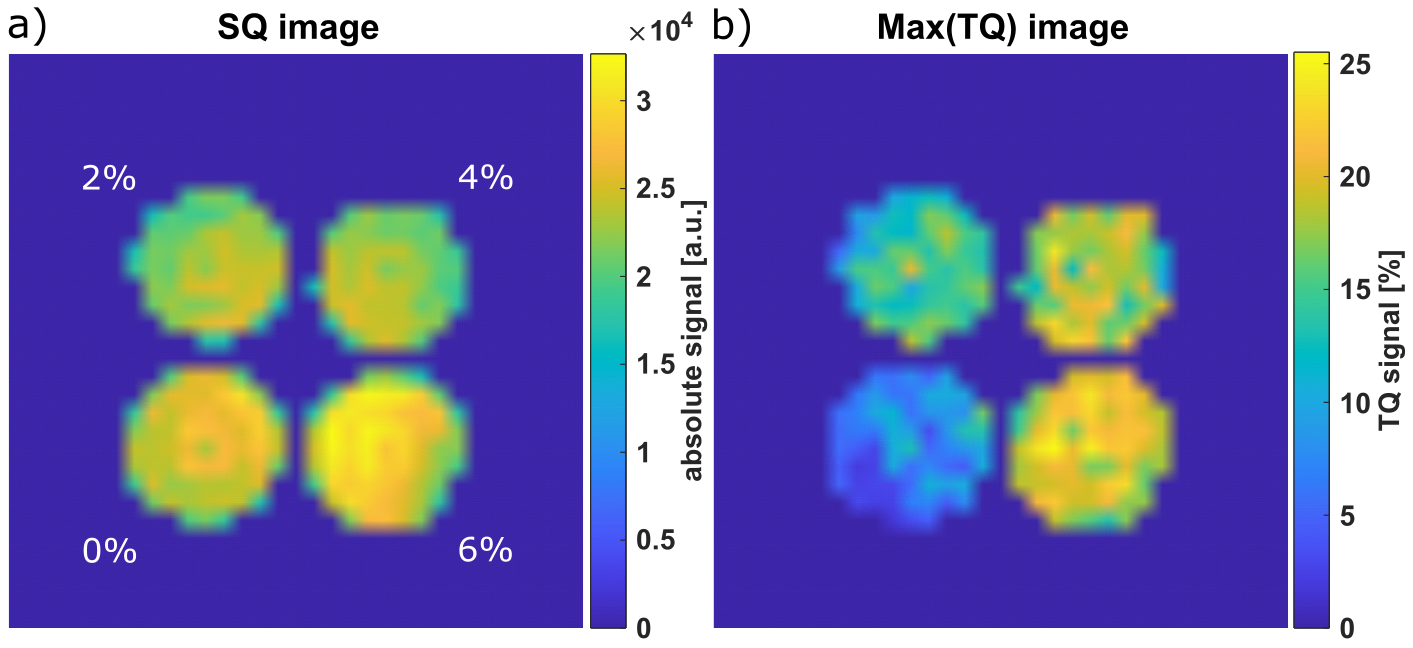
Fig.4 shows SQ and TQ images using a multi-echo UTE sequence and our method. This demonstrates the applicability of our method to imaging in a proof-of-concept. The scan time was the same as for a standard sodium SQ image.
Conclusion
This study presented a novel method for simultaneous SQ and TQ MRI only requiring the FID as input. The TQ signal of the method was in excellent agreement with theoretical prediction and the state-of-the art TQTPPI sequence. Good performance in low SNR scenarios and TQ imaging with SQ time efficiency has been demonstrated. This may leverage the full potential of the sodium TQ signal in clinical applications.Acknowledgements
Part of this work was supported by the German Research Foundation (grant no. 410981386).References
1. Madelin G, Lee J-S, Regatte RR, Jerschow A. Sodium MRI: Methods and applications. Progress in Nuclear Magnetic Resonance Spectroscopy. 2014/05/01/ 2014;79:14-47. doi:https://doi.org/10.1016/j.pnmrs.2014.02.001
2. Madelin G, Regatte RR. Biomedical applications of sodium MRI in vivo. J Magn Reson Imaging. 2013;38(3):511-529. doi:https://doi.org/10.1002/jmri.24168
3. Schepkin VD, Neubauer A, Nagel AM, Budinger TF. Comparison of potassium and sodium binding in vivo and in agarose samples using TQTPPI pulse sequence. J Magn Reson. 2017/04/01/ 2017;277:162-168. doi:https://doi.org/10.1016/j.jmr.2017.03.003
4. Reichert S, Kleimaier D, Schepkin VD, Schad L. 23Na Triple Quantum (TQ) Signal Estimation from Single-Pulse Sequence with Single Quantum (SQ) Time Efficiency. Proc Intl Soc Mag Reson Med. 2023;31
5. Kleimaier D, Schepkin V, Nies C, Gottwald E, Schad LR. Intracellular Sodium Changes in Cancer Cells Using a Microcavity Array-Based Bioreactor System and Sodium Triple-Quantum MR Signal. Processes. 2020;8(10):1267.
6. Blunck Y, Josan S, Taqdees SW, et al. 3D-multi-echo radial imaging of 23Na (3D-MERINA) for time-efficient multi-parameter tissue compartment mapping. Magn Reson Med. 2018;79(4):1950-1961. doi:https://doi.org/10.1002/mrm.26848
7. Nagel AM, Laun FB, Weber M-A, Matthies C, Semmler W, Schad LR. Sodium MRI using a density-adapted 3D radial acquisition technique. Magn Reson Med. 2009;62(6):1565-1573. doi:https://doi.org/10.1002/mrm.22157
Figures