3029
Two-pulse phase-modulated (TPPM) 1H decoupling for detection of the C1-glycogen peak in 13C MRS using a 3T clinical scanner.1Siemens Healthcare K.K., Tokyo, Japan, 2Research Organization of Science and Technology, Ritsumeikan University, Kusatsu, Japan
Synopsis
Keywords: Non-Proton, Non-Proton, Spectroscopy, carbon-13
Motivation: To develop a safe MR method to non-invasively measure skeletal muscle glycogen levels in humans.
Goal(s): To reduce SAR without degrading the spectral quality of the 1H-decoupled C1-glycogen peak in 13C MRS.
Approach: To introduce the two-pulse phase-modulated (TPPM) 1H decoupling scheme, which is widely used for 13C NMR of organic solids, into the 13C MRS pulse sequence for a clinical scanner.
Results: The 1H-decoupled C1-glycogen peak could be obtained from a solution phantom using a clinical 3T scanner while reducing SAR with shortening the duration of the TPPM 1H decoupling during 13C FID acquisition.
Impact: 13C MRS with the TPPM 1H decoupling for measuring human skeletal muscle glycogen levels may be more advantageous at high magnetic fields due to the lower SAR, leading to higher SNR or shorter scan times.
INTRODUCTION
Glycogen has attracted a great deal of interest in relation with the energy metabolism for physical fatigue in skeletal muscle. A non-invasive 13C MRS method has been utilized to detect the C1-glycogen peak without spectral background 1,2. The detection at high fields is advantageous to enhance signal intensity and the weak peaks coupled with adjacent 1H spins should be detected as a single peak using 1H decoupling to increase SNR or to reduce scan times.1H decoupling is achieved with RF irradiation at 1H resonance frequency during 13C FID acquisition. The irradiation leads to high SAR and limits the application at high fields. WALTZ-16 decoupling scheme3 is widely used in in vivo 13C MRS1. Since the pulse widths are on the order of milliseconds in clinical MR scanners, the duration of a WALTZ-16 scheme is a few tens of milliseconds, which may be too long to detect the short-T2* in vivo C1-glycogen peak.
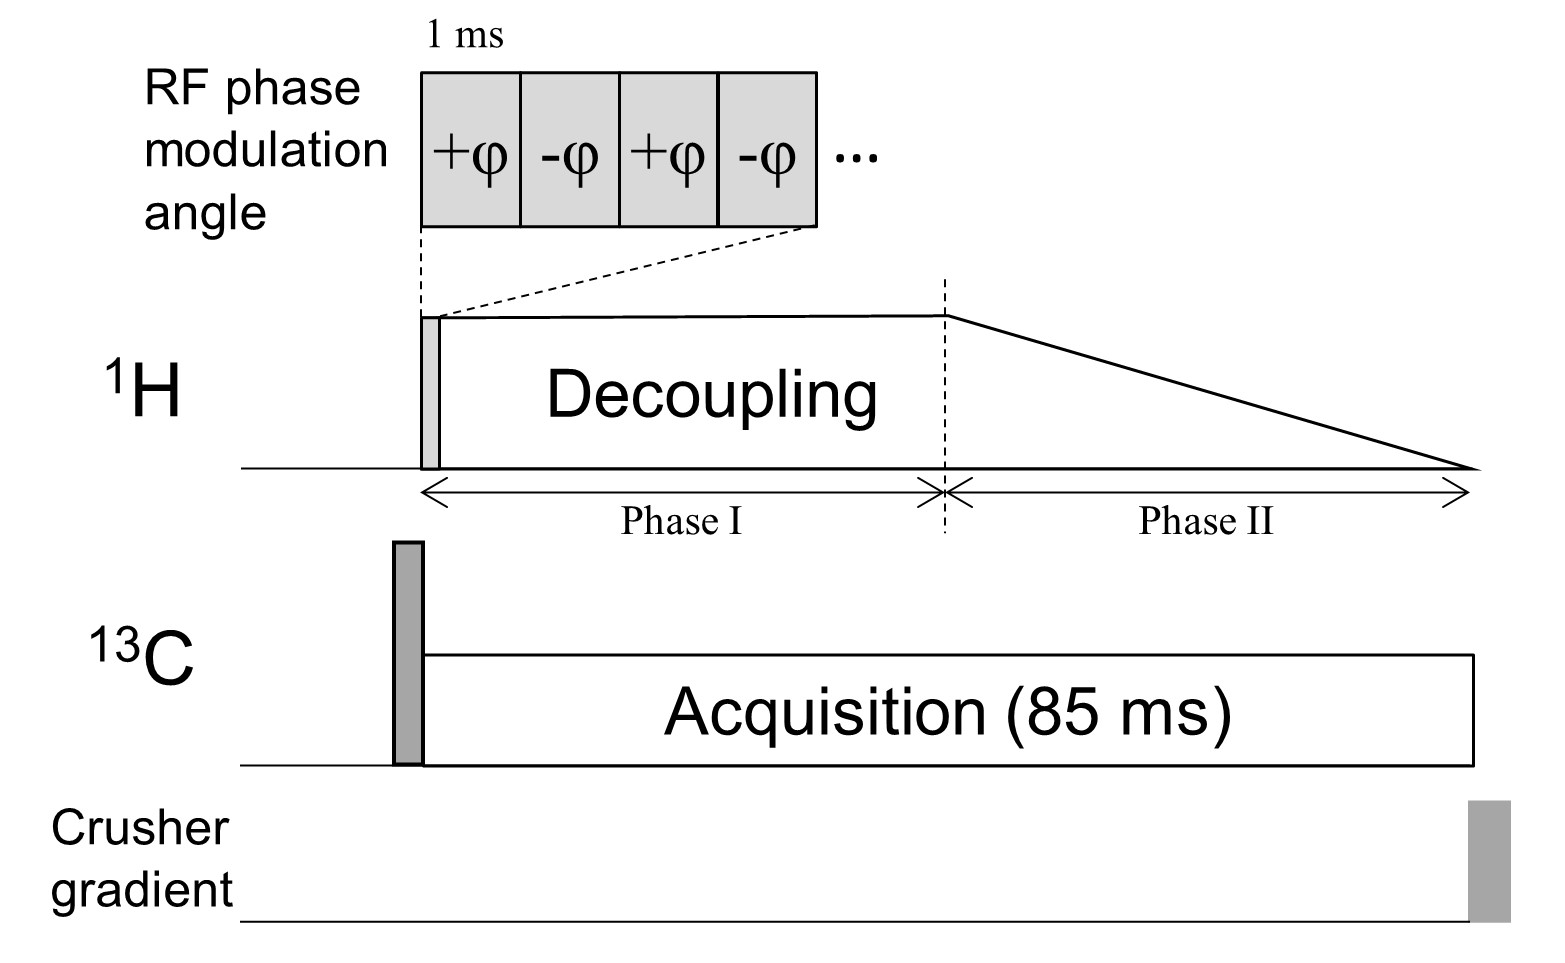
In 13C NMR of organic solids, which requires high 1H decoupling power, the two-pulse phase-modulated (TPPM) 1H decoupling was proposed4 and has been exploited as a more efficient method with high SNR and low RF power than the continuous wave (CW) decoupling 4,5. The TPPM decoupling scheme simply repeats a pair of 180o pulses while changing the positive and negative signs of the RF phase modulation angle (Fig. 1). The pulse pair could be completed within a few milliseconds even in clinical applications, potentially reducing the required decoupling duration and power. Thus, it would be valuable if the TPPM decoupling could be applied to in vivo 13C MRS. In this study, the TPPM decoupling was introduced into the 13C MRS pulse sequence for a clinical scanner to demonstrate 1H decoupling of the C1-glycogen peak from a solution phantom.
METHODS
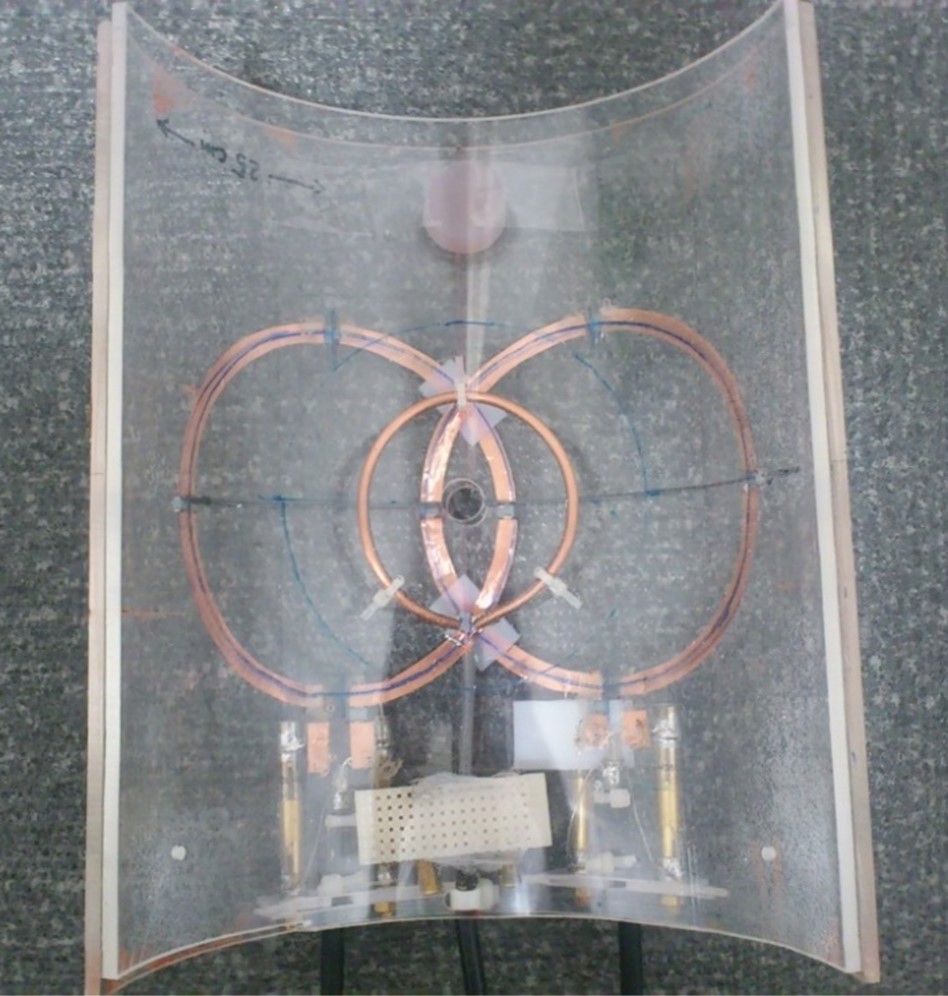
MRS experiments were carried out using a 3T clinical scanner (Skyra, Siemens Healthineers, Erlangen, Germany) and two aqueous solution phantoms containing [1-13C]glucose and oyster glycogen. The molar concentration of the C1-carbons in the glycogen phantom was ~150 mM. RF coils were built for human calf muscle 13C measurement with 1H imaging and decoupling capability (Fig. 2) based on Serés Roig et al6.13C MRS pulse sequences with CW, TPPM and WALTZ-16 decoupling schemes were prepared as research prototypes. The same 1H decoupling amplitude was used in those sequences and was kept constant during 13C FID acquisition for the glucose phantom. For the glycogen phantom, the duration of 13C FID acquisition was divided into two phases as shown in Fig. 1. The reason for setting the second phase is to reduce SAR without detecting noise spikes when the decoupling power is switched off. Other identical 13C MRS parameters: the duration of an excitation rectangular RF pulse = 0.4 ms, acquisition bandwidth = 3 kHz, acquisition time = 85 ms and sampling points = 256. The SAR was simulated on the scanner as an adult male with a 170-cm height and a 70-kg weight. The signal amplitude of the highest C1-glucose peak was measured in the absolute-value display mode on the operational software for the scanner and was calculated as the average of three measurements.
RESULTS
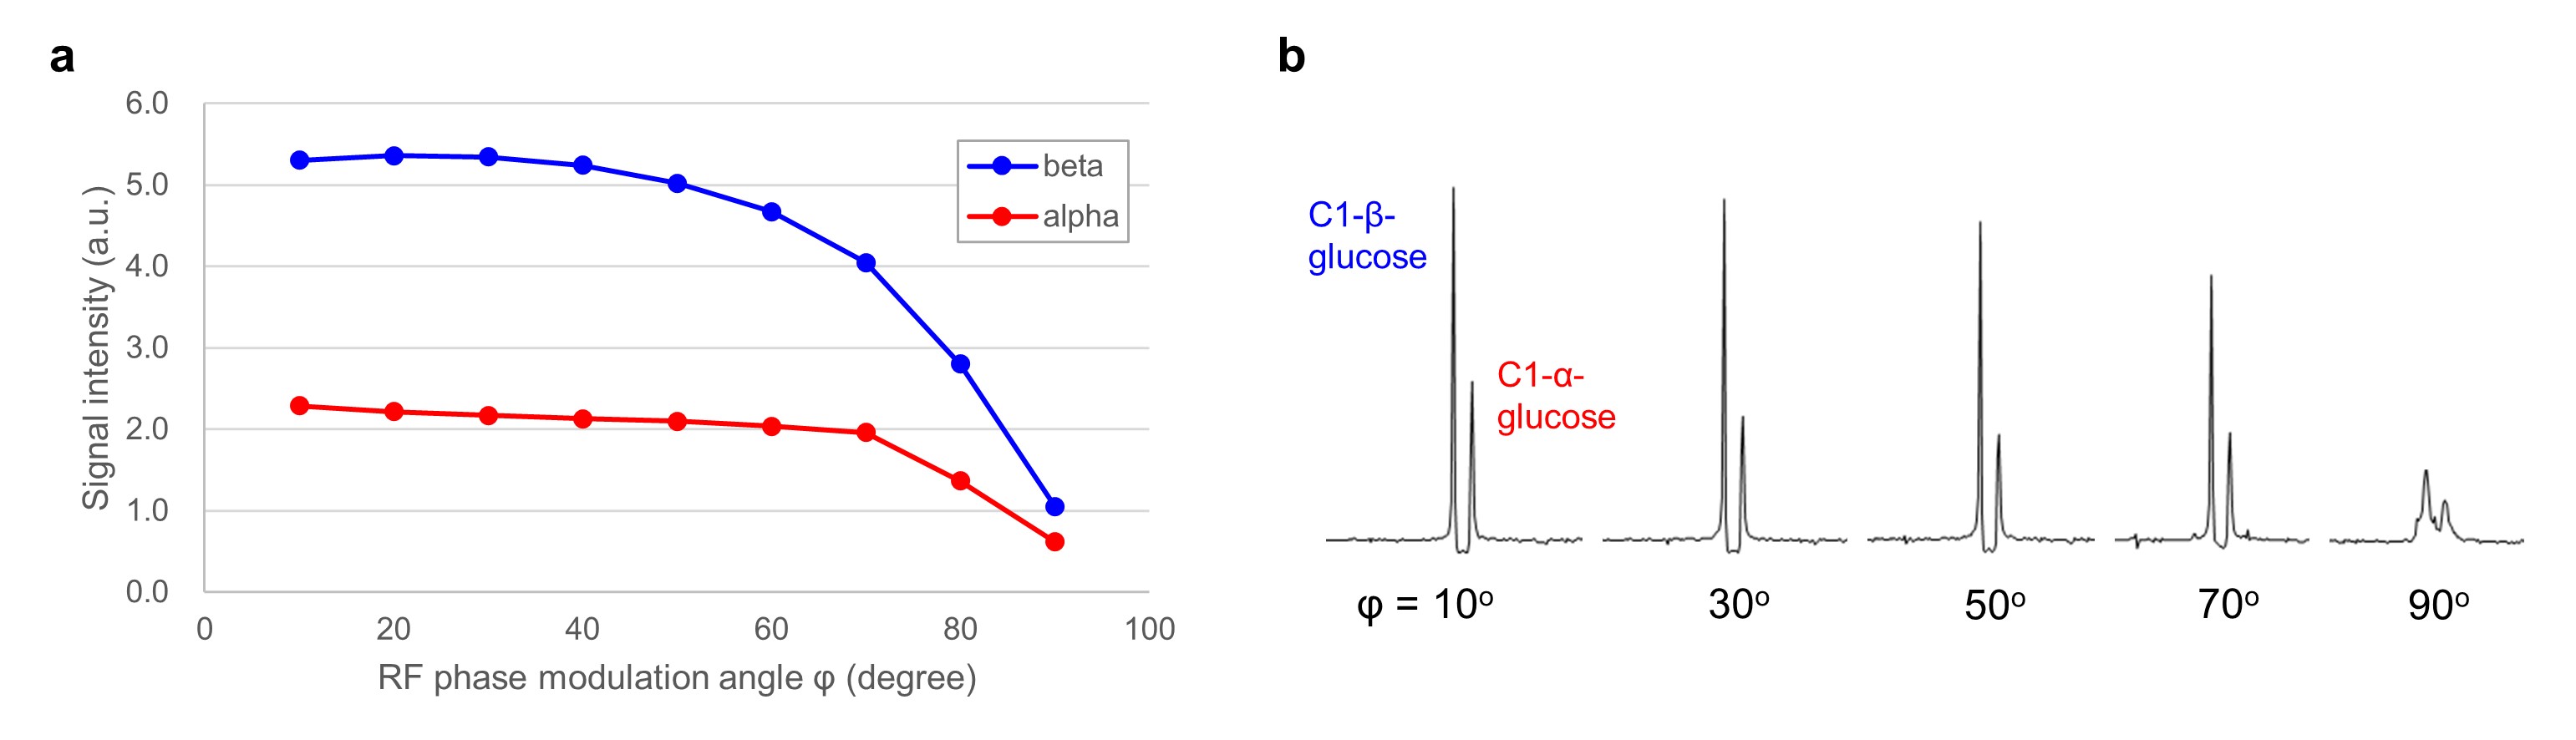
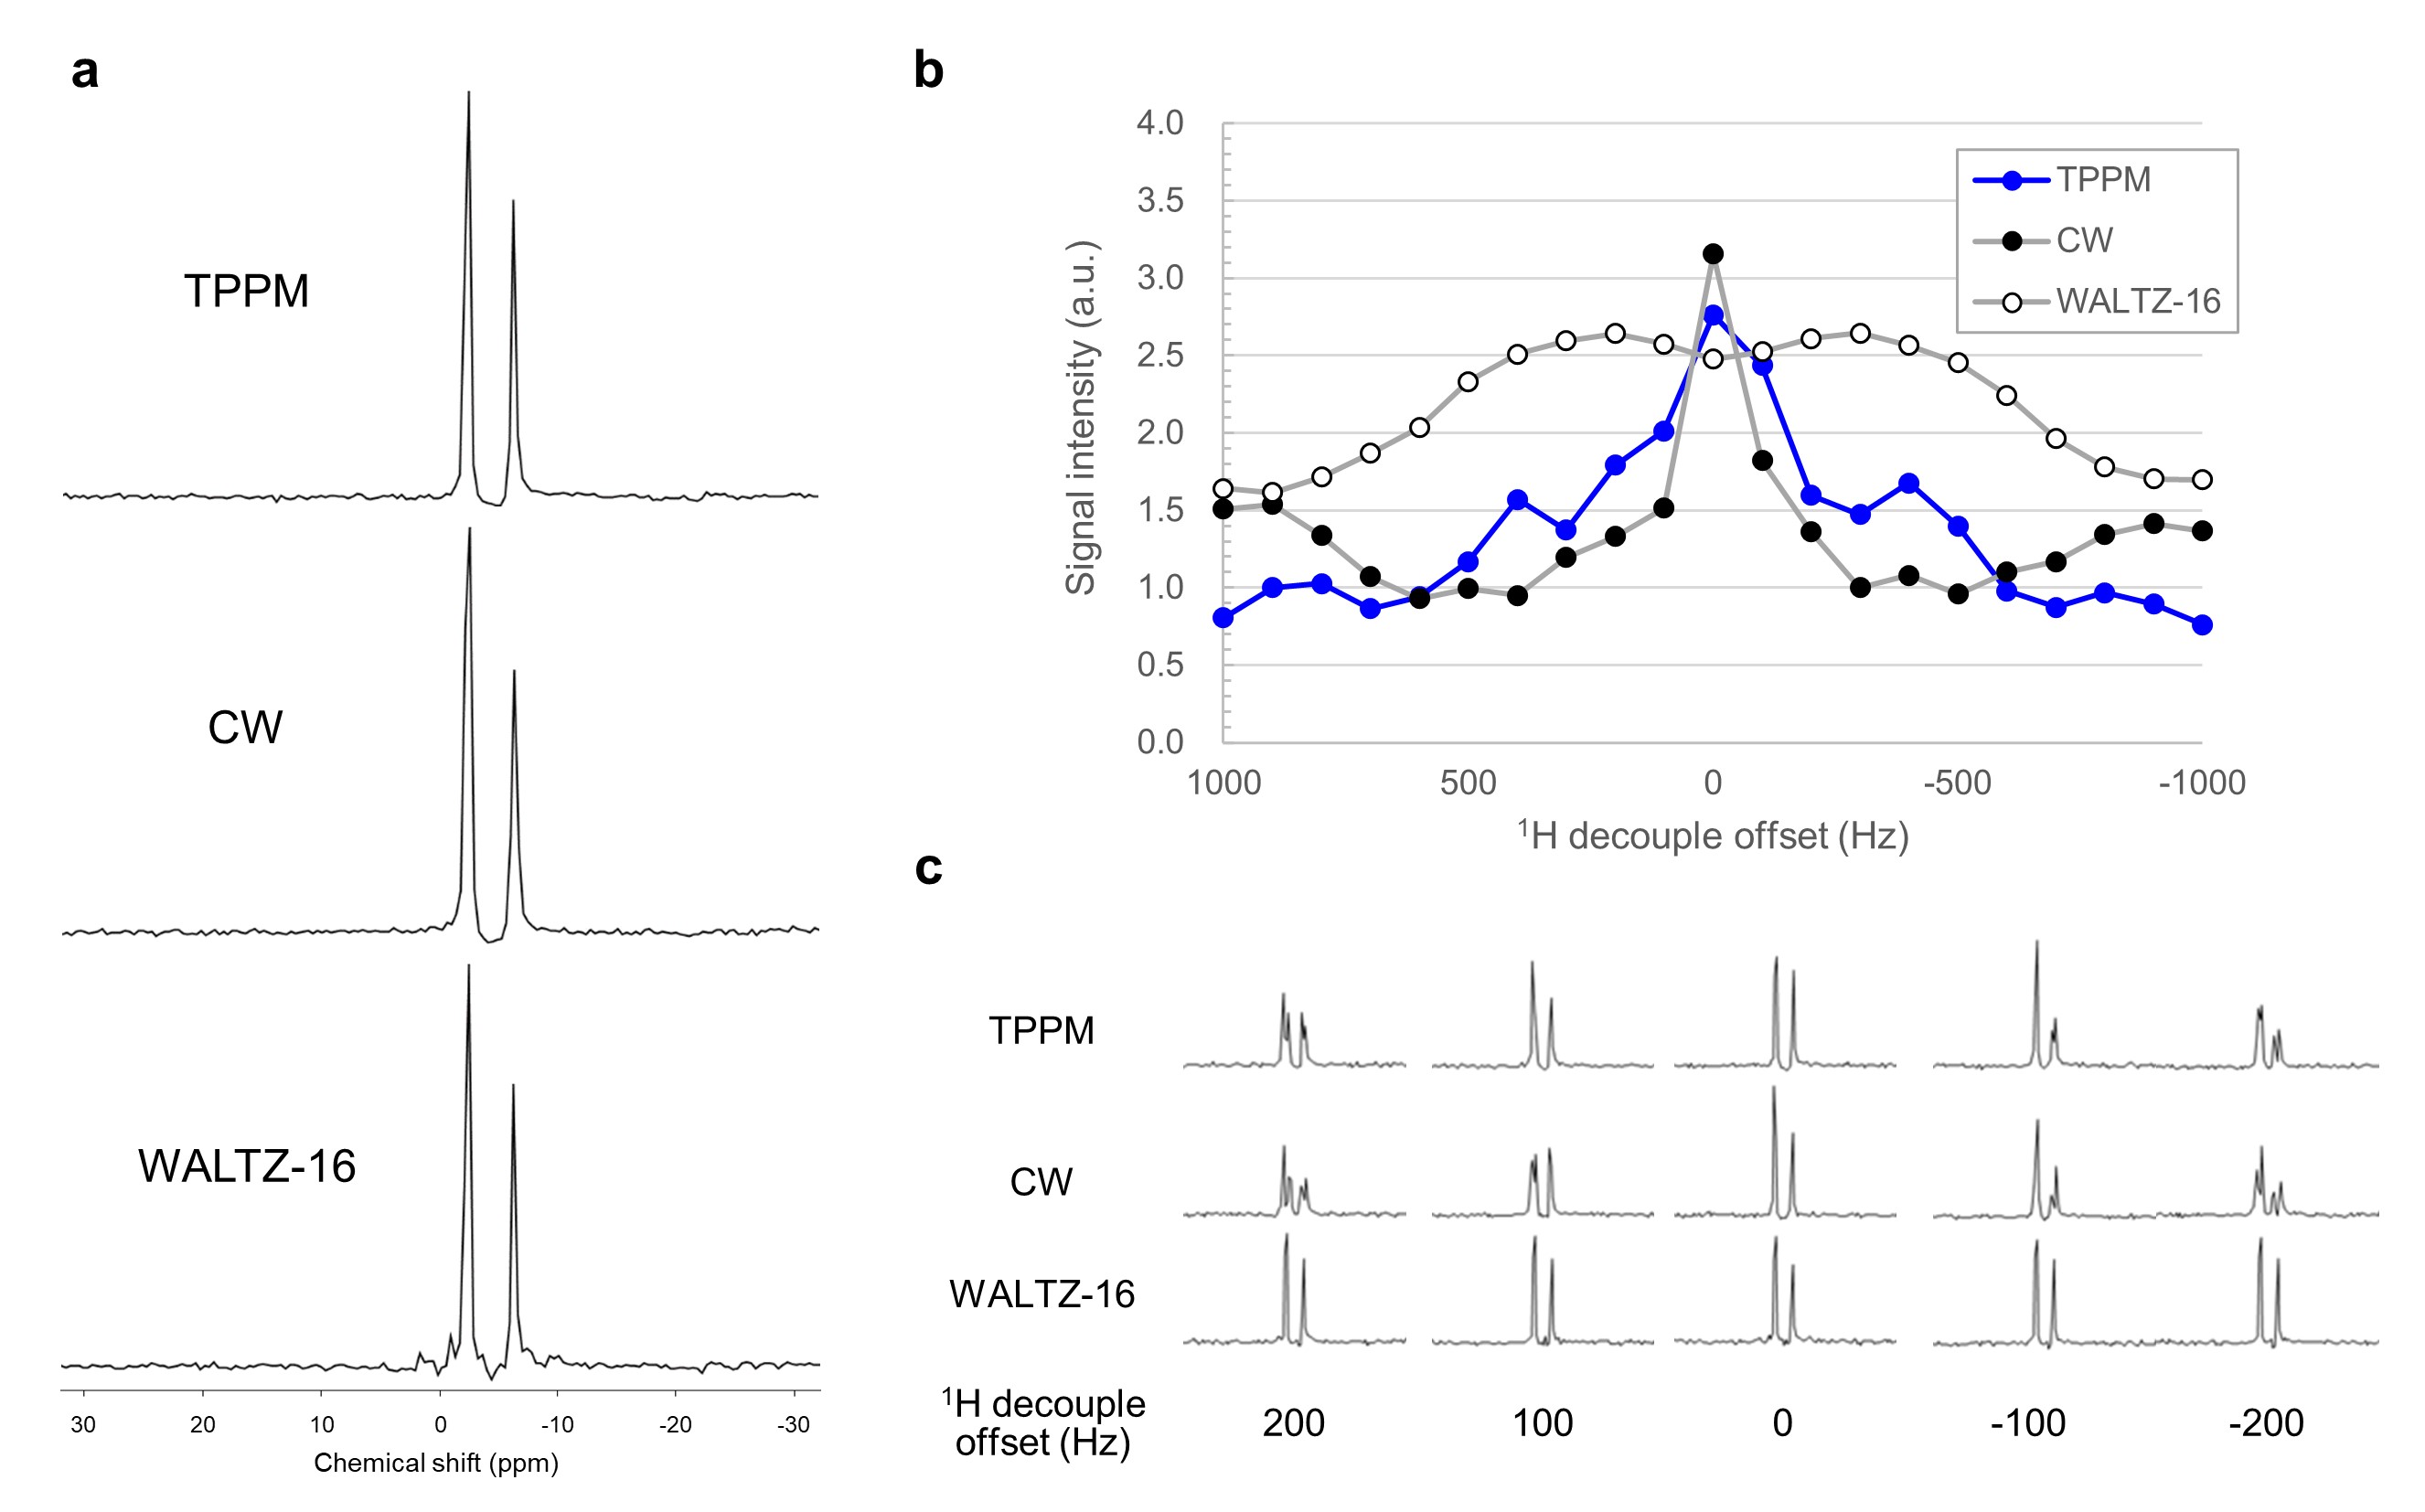
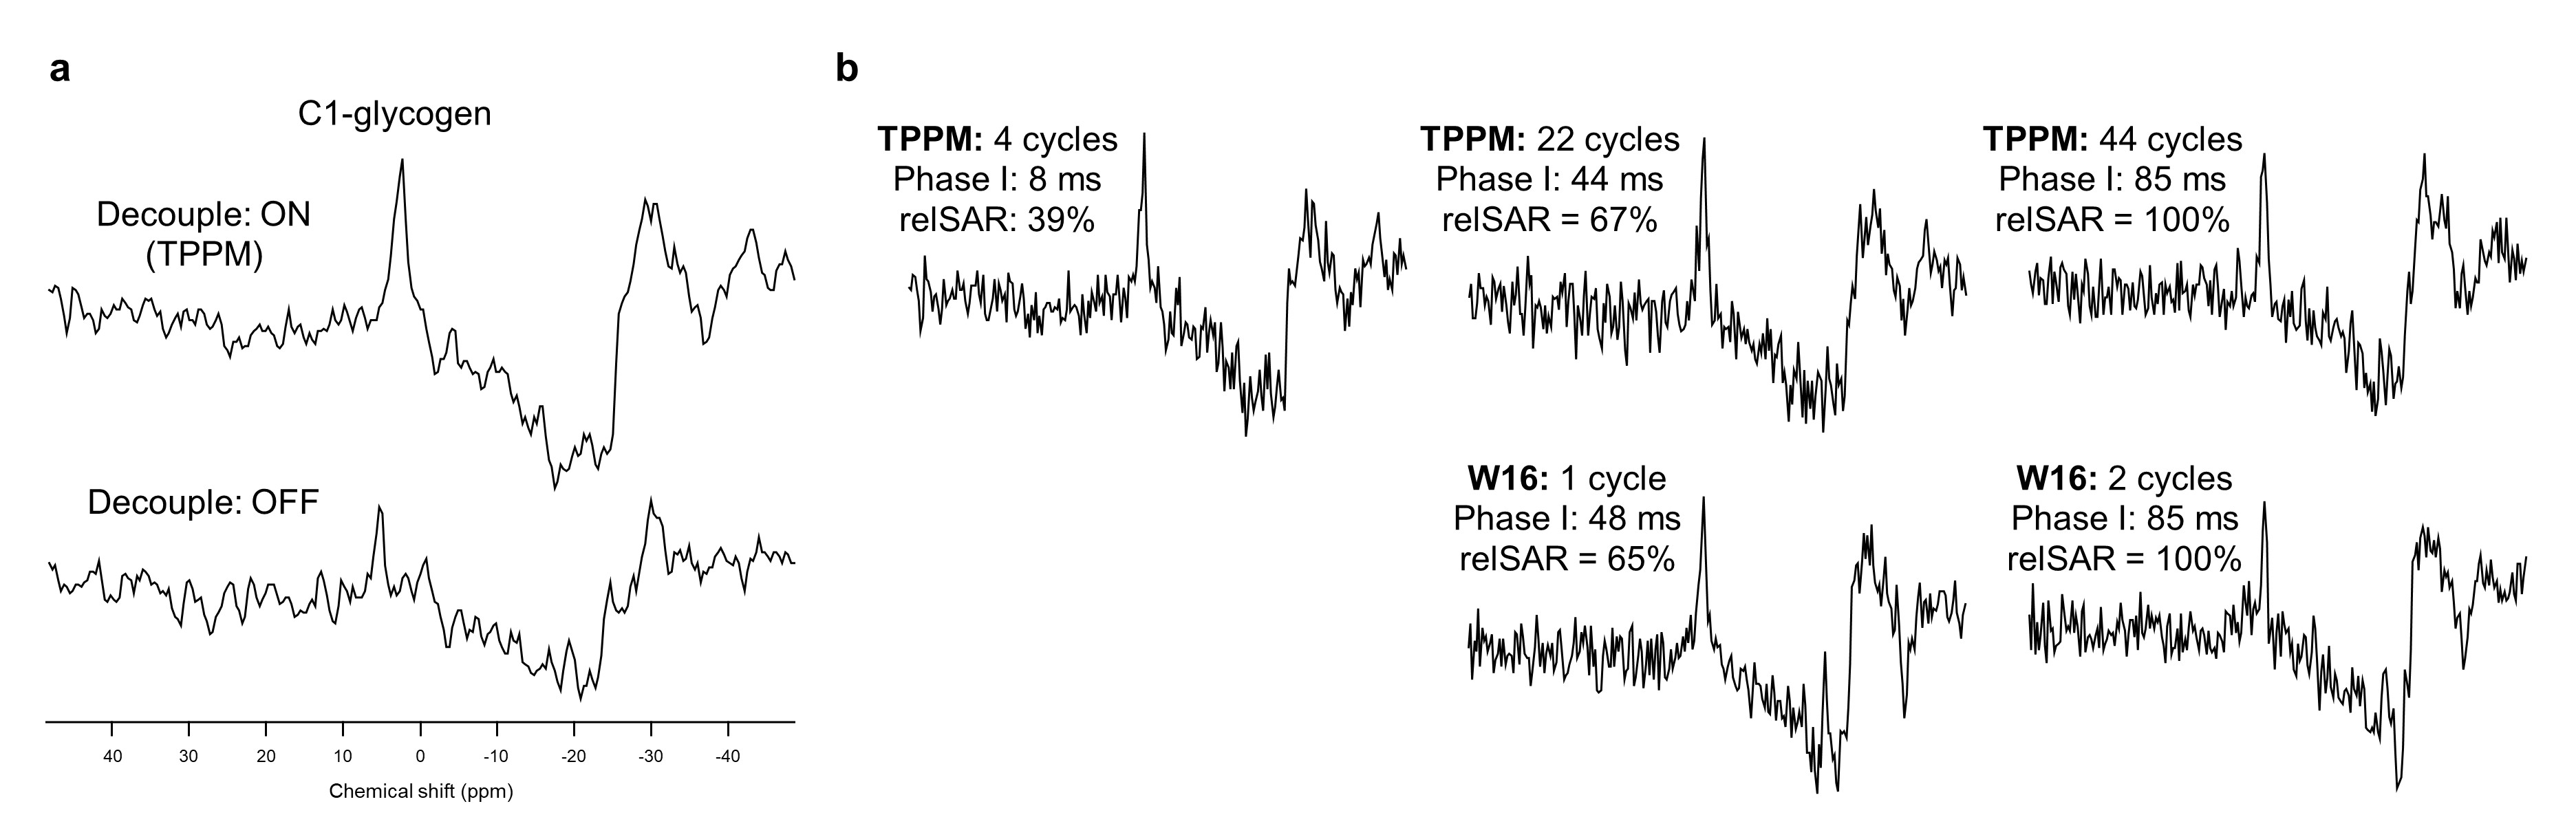
As shown in the results below, the TPPM decoupling could be performed using the clinical 3T scanner. The higher TPPM decoupling effect was achieved with the smaller RF phase modulation angle (Fig. 3). Comparing spectral quality of the 1H-decoupled C1-glucose peaks, sidebands were observed only in the spectrum with WALTZ-16 (Fig. 4a). The decoupling bandwidth with TPPM was slightly wider than that with CW and was narrower than that with WALTZ-16 (Fig. 4b-c). In the 13C spectra of glycogen, the C1-glycogen peak could be 1H-decoupled with the TPPM scheme even if the duration of the first decoupling phase was shortened to 8 ms (Fig. 5b). This reduced the simulated SAR to less than 40% comparing to the SAR with full decoupling during 13C FID acquisition.DISCUSSION
The effectiveness of the TPPM decoupling with the small RF phase modulation angles is consistent with the optimum condition in 13C NMR of organic solids5. The simple TPPM decoupling scheme may contribute to that the sidebands were not observed and may be more applicable to in vivo applications with RF excitations using loop coils than WALTZ-16 which requires 270o and 360o flip angles. Even with the narrow decoupling bandwidth, the TPPM decoupling may be sufficient to detect the C1-glycogen peak from human skeletal muscle.CONCLUSION
The TPPM scheme is applicable for detection of the 1H-decoupled C1-glycogen peak in 13C MRS using clinical 3T scanners.Acknowledgements
No acknowledgement found.References
1. Goluch S et al. Proton-decoupled carbon magnetic resonance spectroscopy in human calf muscles at 7 T using a multi-channel radiofrequency coil. Sci Rep 2018;8:6211.
2. Shiose K et al. Muscle glycogen assessment and relationship with body hydration status: A narrative review. Nutrients 2022;15:155.
3. Shaka AJ et al. Evaluation of a new broadband decoupling sequence: WALTZ-16. J Magn Reson 1983;53:313-340.
4. Bennett AE et al. Heteronuclear decoupling in rotating solids. J Chem Phys 1995;103:6951-6958.
5. Ernst M. Heteronuclear spin decoupling in solid-state NMR under magic-angle sample spinning. J Magn Reson 2003;162:1-34.
6. Serés Roig E et al. A double-quadrature radiofrequency coil design for proton-decoupled carbon-13 magnetic resonance spectroscopy in humans at 7T. Magn Reson Med 2015;73:894-900.
Figures