3027
Translating multiparametric, quantitative MRI from 3T to 7T: A preliminary study.
Zaheer Abbas1, Wieland Worthoff1, Ana-Maria Oros-Peusquens1, and N. Jon Shah1,2,3,4
1Institute of Neuroscience and Medicine 4, INM-4, Forschungszentrum Jülich, Jülich, Germany, 2JARA – BRAIN - Translational Medicine, Aachen, Germany, 3Department of Neurology, RWTH Aachen University, Aachen, Germany, 4Institute of Neuroscience and Medicine, INM-11, Forschungszentrum Jülich GmbH, Jülich, Germany
1Institute of Neuroscience and Medicine 4, INM-4, Forschungszentrum Jülich, Jülich, Germany, 2JARA – BRAIN - Translational Medicine, Aachen, Germany, 3Department of Neurology, RWTH Aachen University, Aachen, Germany, 4Institute of Neuroscience and Medicine, INM-11, Forschungszentrum Jülich GmbH, Jülich, Germany
Synopsis
Keywords: Data Processing, Quantitative Imaging
Motivation: Quantitative MRI at clinical strengths is well-established, yet RF inhomogeneity at ultrahigh-field strength, such as 7T, complicates tissue-specific measurement.
Goal(s): To extend quantitative water content mapping from clinical to ultrahigh-field MRI.
Approach: We utilize a modified variable flip angle method to acquire high-resolution parametric maps at 7T within 7.5 minutes.
Results: Method validity is affirmed by comparing water content and relaxometry data from a healthy cohort against 3T benchmarks and reported literature.
Impact: This technique paves the way for advanced brain tissue analysis at ultrahigh-field MRI (7T), crucial for accurate neurological assessment.
Introduction
Recent advances in ultrahigh-field, such as 7 Tesla (T), MRI technology have significantly enhanced our ability for detailed brain tissue characterization, particularly through quantitative imaging. Established quantitative methods, including absolute water content and relaxation time measurements at 1.5T and 3T, have proven effective in studying neuropathologies such as Alzheimer's, Parkinson's, and brain tumours across various patient cohorts1,2,3. Measuring tissue water content using ultrahigh-field MRI poses challenges; specifically, the radiofrequency (RF) inhomogeneity arising from brain tissue electromagnetic properties. To address this issue, the longitudinal relaxation time (T1) can be combined with an initial estimate of the proton-density (PD) to achieve PD bias correction4,5. The quantification of water content at 1.5T and 3T is well-explored4,5,6,7. Building upon this published literature, this study aims to adapt such established clinical methodologies to ultrahigh-field strength. Water content imaging methods were used to acquire quantitative water content maps from a healthy volunteer cohort, statistical comparisons and region of interest-based analysis performed to validate the methods.Methods
MR data from 10 healthy males (age: 28±8) were acquired using a 7T MAGNETOM Terra scanner with a 32-element NOVA coil and a 3T PRISMA scanner with a 64-element head coil. Structural MRI used an MP2RAGE sequence at 7T - TR=4500ms/TE=1.99ms with a 0.75 mm³ isotropic resolution.The quantitative MRI protocol involved an M0-weighted multi-echo gradient echo (GRE) scan (TR=1800ms, FA=40°, TE1=5.8ms/ΔTE=5.0ms, 9-Echoes, acquisition time (TA)= 5.5min) for water content estimation, necessitating corrections for B1Tx inhomogeneity, T2*-decay, T1-saturation, and receive non-uniformity. This included additional T1-weighted GRE (TR=600ms, FA=70°, TE=5.8ms/TA=1.5min) and Turbo FLASH (TR=7000ms, FA= 90°, TE=17ms/TA=0.5min) sequences for relaxation time and B1Tx estimation, respectively. The signal at zero echo time is reconstructed using an appropriate parametric model of the gradient echo decay. Measurement of the static field B0 and T2* was performed using M0-weighted GRE acquisition, and the influence of T1 effects on the estimated water content map is evaluated using a dedicated method4 and prior calibration to the lateral ventricles4,5. Parametric maps with 1mm in-plane resolution were obtained from a 7.5-minute acquisition at both fields.Brain segmentation and statistical analysis: Quantitative maps were registered to the MP2RAGE sequence prior to registration with the MNI template. Brain segmentation was conducted using the statistical parametric toolbox (SPM12)8, and the corresponding water content values for white matter (WM), grey matter (GM), and cerebrospinal fluid (CSF). Statistical analyses were performed, comparing water content and relaxation time values at 3T with those at 7T, as well as with corresponding values reported in the literature6,7,9,10,11,12.
Results
The workflow and the complete post-processing pipeline used to calculate water content maps for all volunteers are schematically illustrated in Figure 1. Transverse slices depicting measured water content and relaxation time maps at both field strengths for a representative participant are presented in Figure 2a-2c. Histograms displaying the distribution of water content and relaxation times across the whole brain are shown in Figure 2d. Figure 3 provides a table of the water content and relaxation time values for WM and GM. The average water content in WM at 3T was found to be 70.1% with a standard deviation (SD) of ±1.6%; at 7T, it was insignificantly higher at 70.5% (SD±2.6%) at 7T. For GM, the average water content at 3T was measured at 80.7% (SD±3.6%), and at 7T 81.3% (SD±5.8%). The mean T1 values over the entire WM were 970ms (SD±33ms) at 3T and 1310ms (SD±97ms) at 7T. For the entire GM, the T1 values were 1423ms (SD±101ms) at 3T and 1693ms (SD±151ms) at 7T. T2* relaxation times for WM were 49ms (SD±8ms) at 3T and 24ms (SD±6.2ms) at 7T. In GM, T2* values were 56ms (SD±13ms) at 3T and 31ms (SD±10.8ms) at 7T.Discussions and Conclusions
Our preliminary results suggest that quantitative water content mapping at 7T is in good agreement with 3T water content mapping and available literature. The protocol used for image acquisition within the current study framework is time-efficient (7.5 minutes) compared to original protocol reported in Abbas et.al. 2014 (14 minutes)4, mainly due to a more efficient T2* mapping and a shortened B1Tx mapping acquisition time. The resulting water content and relaxation times are consistent with existing literature. As expected, tissue class water content does not display field dependence, whereas the T2* values are shortened and the T1 values prolonged and the WM-GM contrast reduced. This comparison can be extended using atlases from a large number of volunteers to investigate possible regional differences between fields. These results suggest that 7T MRI could enhance clinical imaging by providing rapid, high-resolution scans without sacrificing diagnostic quality, supporting its potential for routine clinical adoption.Acknowledgements
The authors are deeply grateful to the participants for their generous cooperation.References
1. Shah et al.: Quantitative cerebral water content mapping in hepatic encephalopathy. NeuroImage 41, 706–717, 200889186, 2008.2. Shah et al.: A novel MRI-based quantitative water content atlas of the human brain. NeuroImage 252, 119014, 2022.
3. Oros-Peusquens et al.: Methods for molecular imaging of brain tumours in a hybrid MR-PET context: Water content, T2 ⁄ , diffusion indices and FET-PET. Methods 130, 135–151, 2017.
4. Abbas et al.: Analysis of Proton-Density Bias Corrections Based on T1 Measurement for Robust Quantification of Water Content in the Brain at 3 Tesla. Magn. Reson. Med. 72, 1735–1745, 2014.
5. Abbas et al.: Quantitative water content mapping at clinically relevant field strengths: A comparative study at 1.5 T and 3 T. NeuroImage, 106, 404–413, 2015.
6. Neeb et al.: Fast quantitative mapping of absolute water content with full brain coverage. NeuroImage 42(3), 1094-1109, 2008.
7. Neeb et al.: A new method for fast quantitative mapping of absolute water content in vivo. NeuroImage 31, 1156 – 1168, 2006.
8. Ashburner et al.: Unified segmentation. NeuroImage 26, 839–851, 2005.
9. Gelman et al.: Interregional variation of longitudinal relaxation rates in human brain at 3.0 T: relation to estimated iron and water contents. Magn. Reson. Med. 45, 71–79, 2001.
10. Volz et al.: Correction of systematic errors in quantitative proton density mapping. Magn. Reson. Med. 68, 74–85, 2012a.
11. Warntjes et al.: Novel method for rapid, simultaneous T1, T2*, and proton density quantification. Magn. Reson. Med. 57, 528–537, 2007.
12. Whittall et al.: In vivo measurement of T2 distributions and water contents in normal human brain. Magn. Reson. Med. 37, 34–43, 1997.
Figures
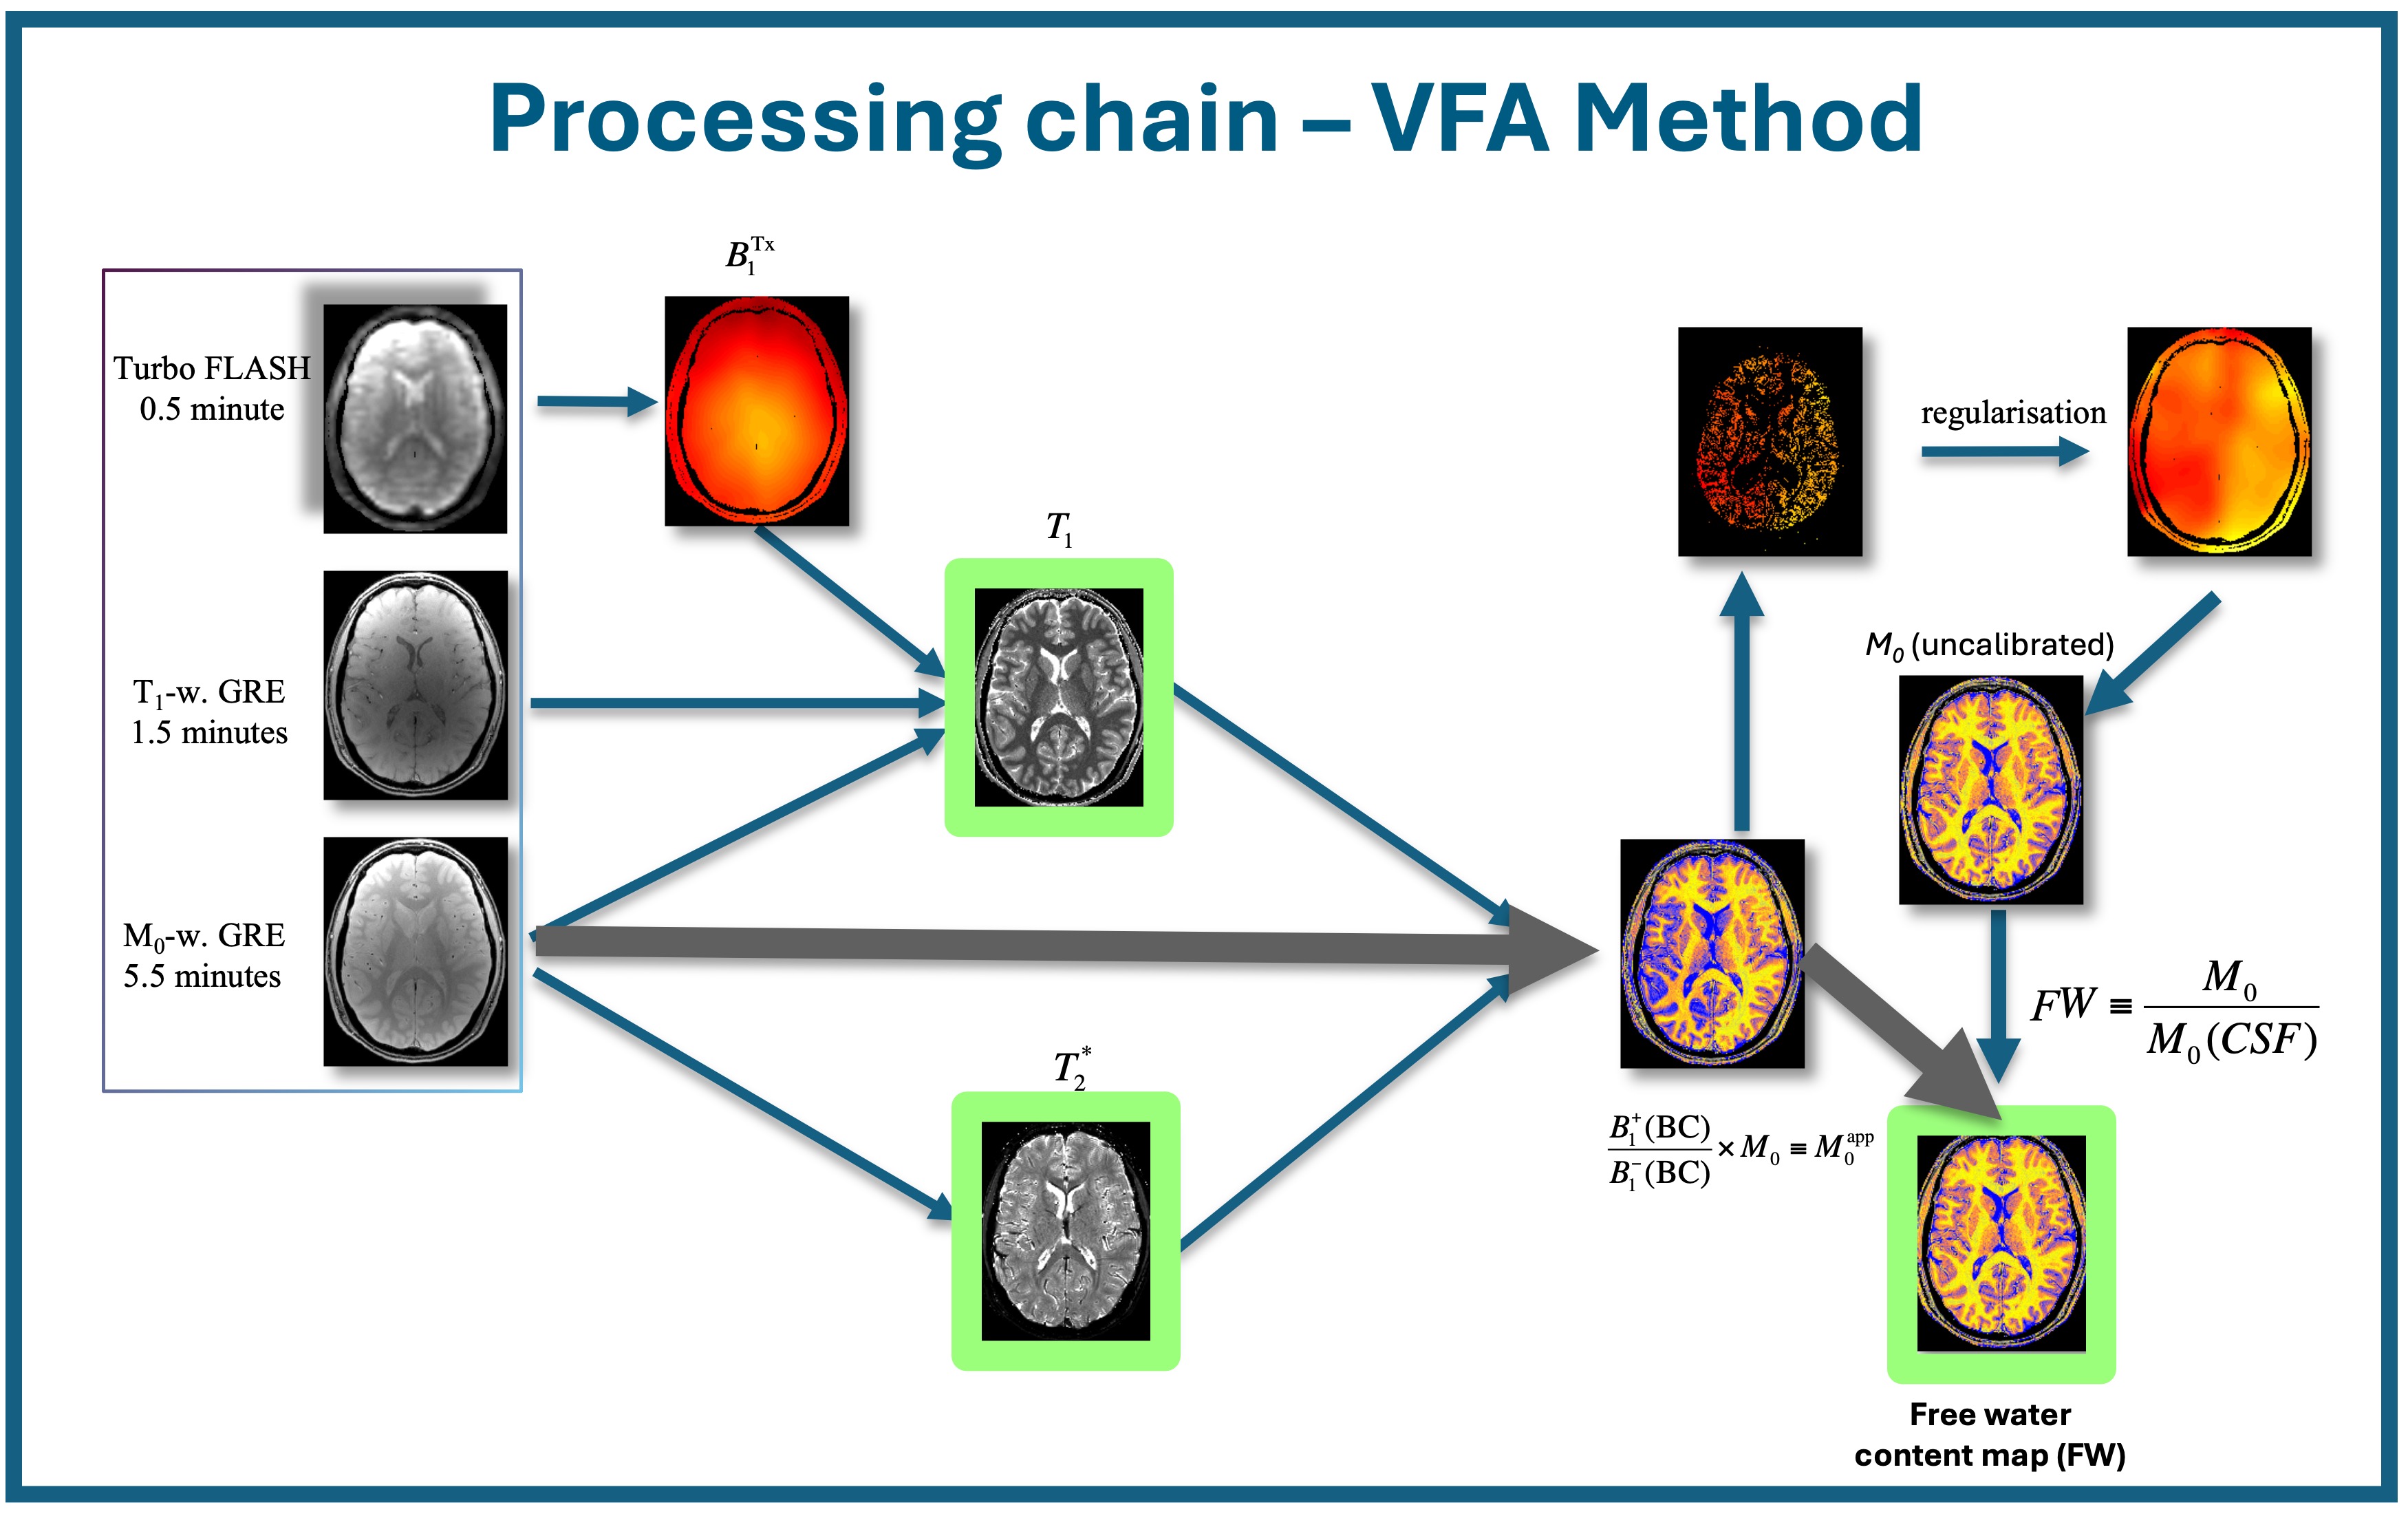
Figure 1. Graphical pipeline summarizing steps for estimating quantitative measures.
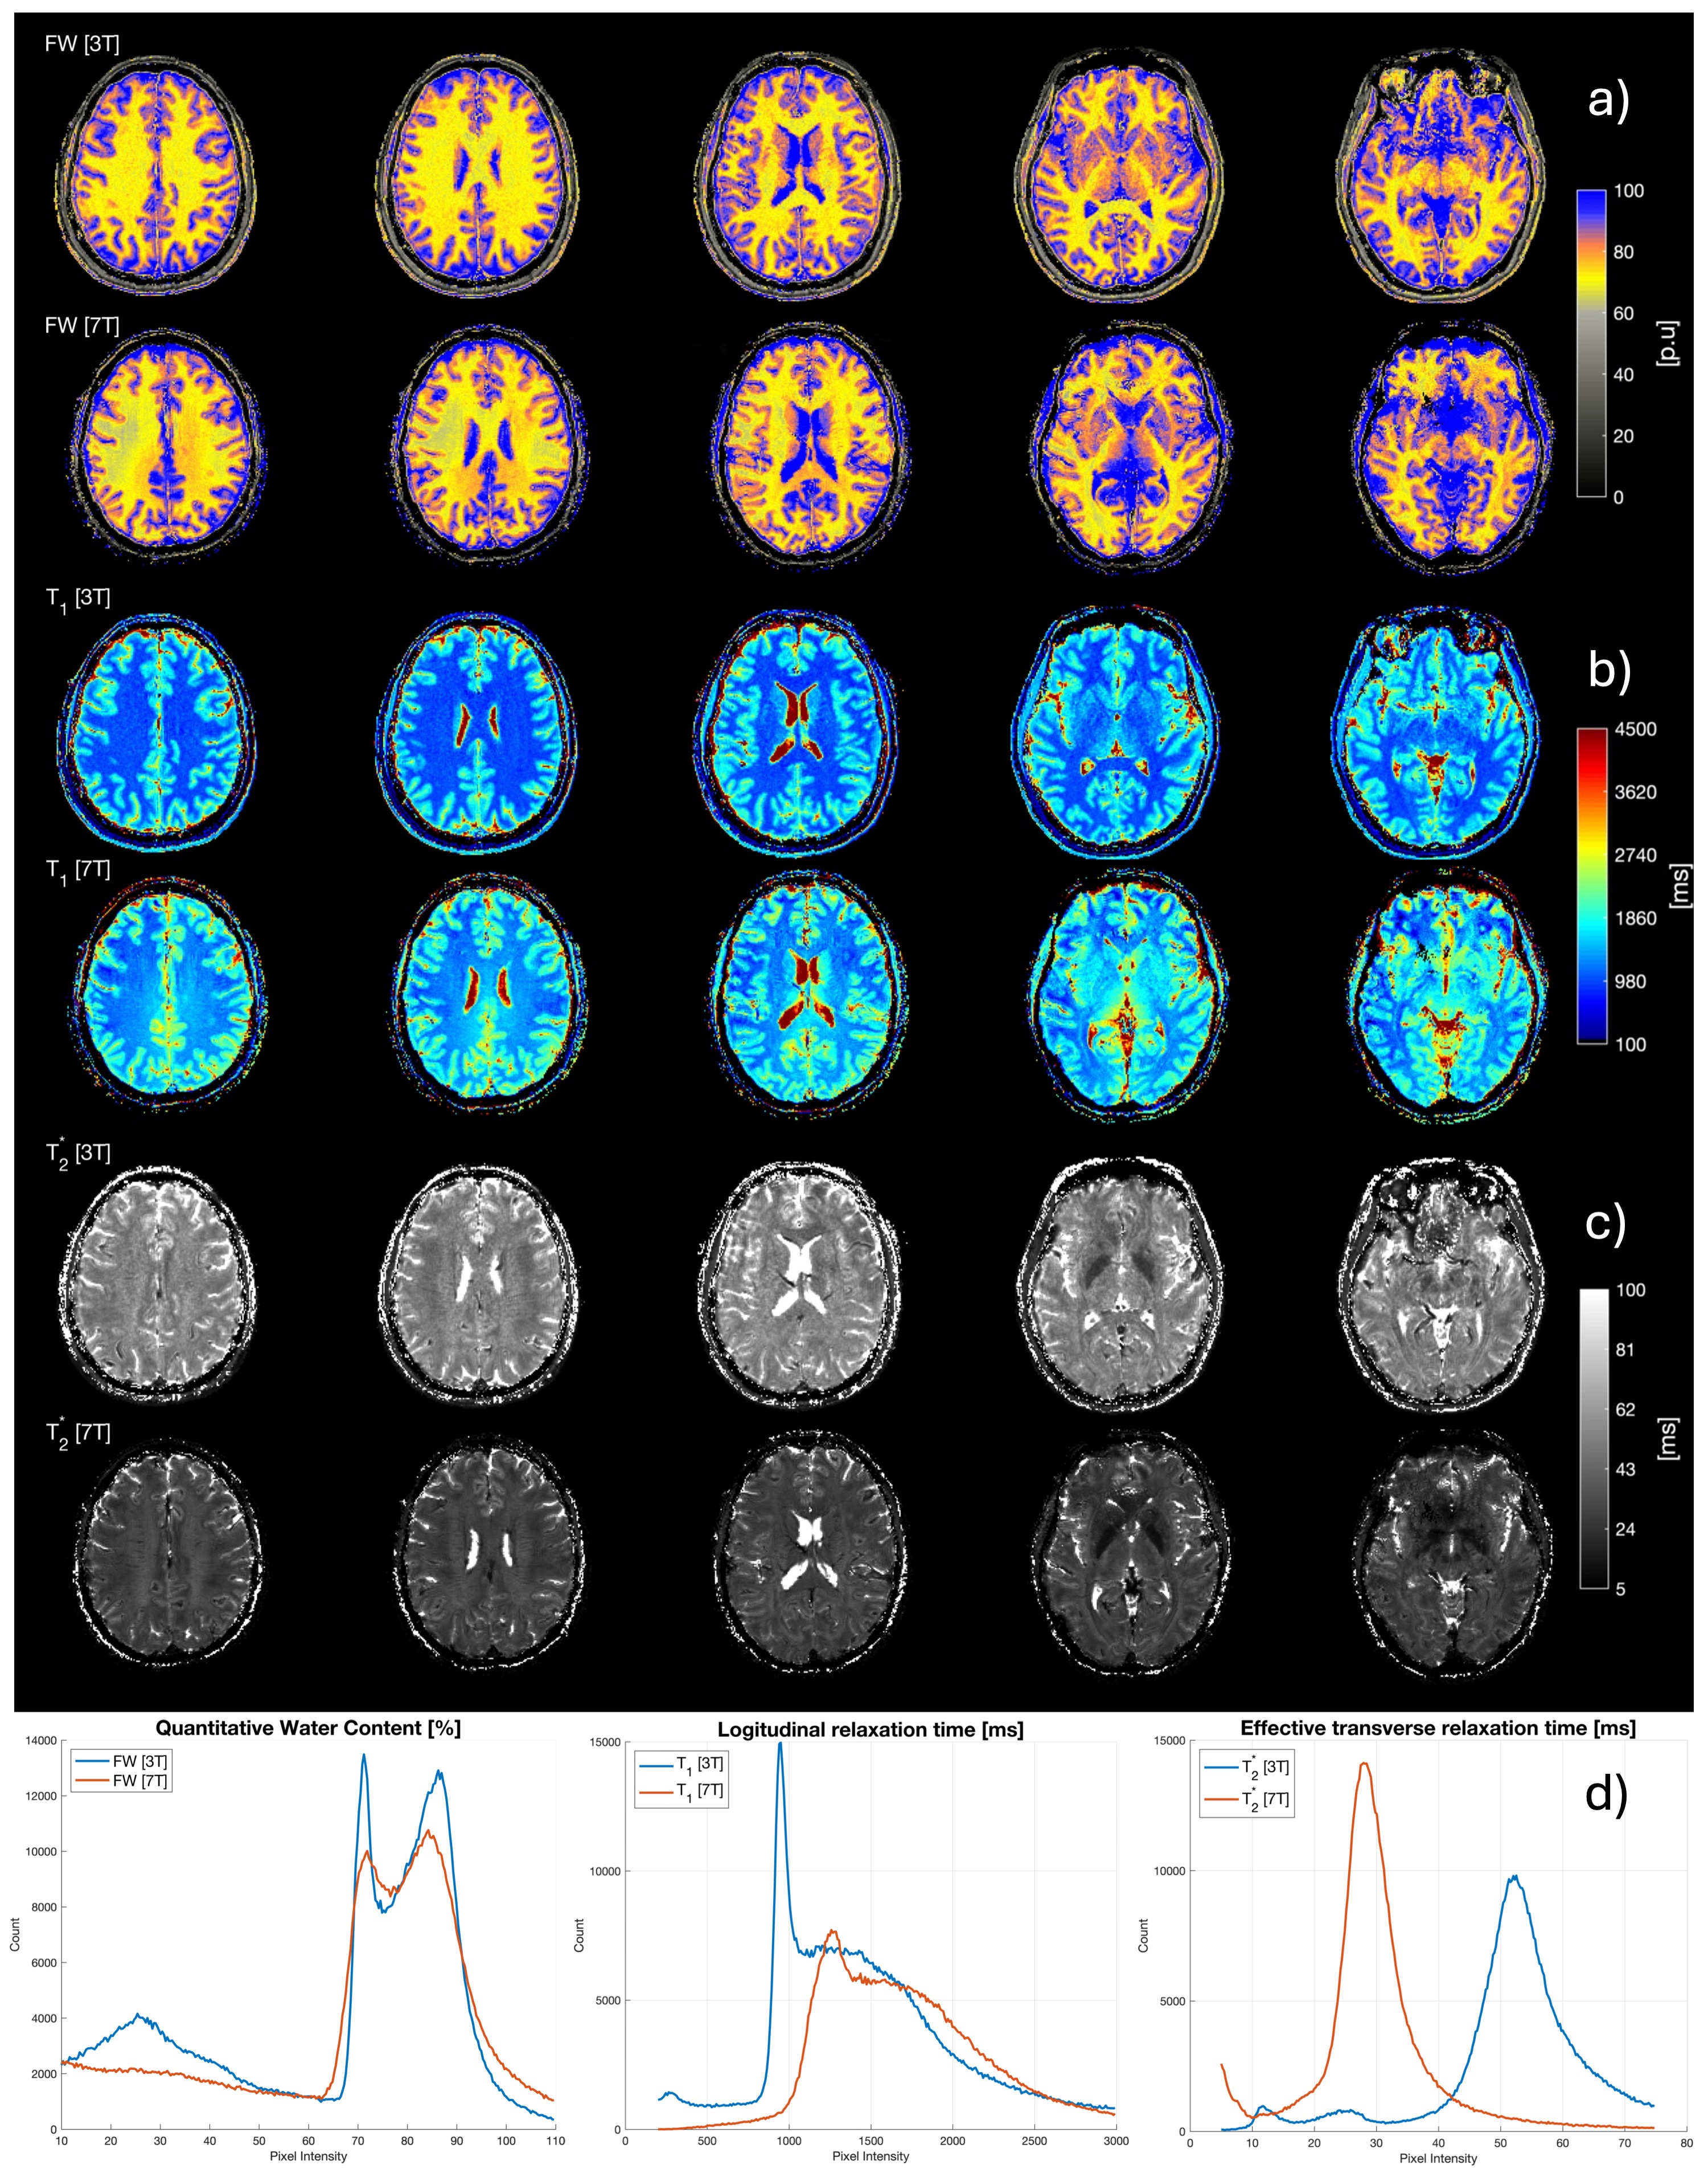
Figure 2. For a representative subject of the cohort, water content maps (a); estimated T1 maps (b), and estimated T2* maps of the brain (c) are shown for 3T and 7T field strength. Histograms of the quantitative parameters (FW, T1 and T2*) from images acquired at both field strengths are shown in the bottom row (d).
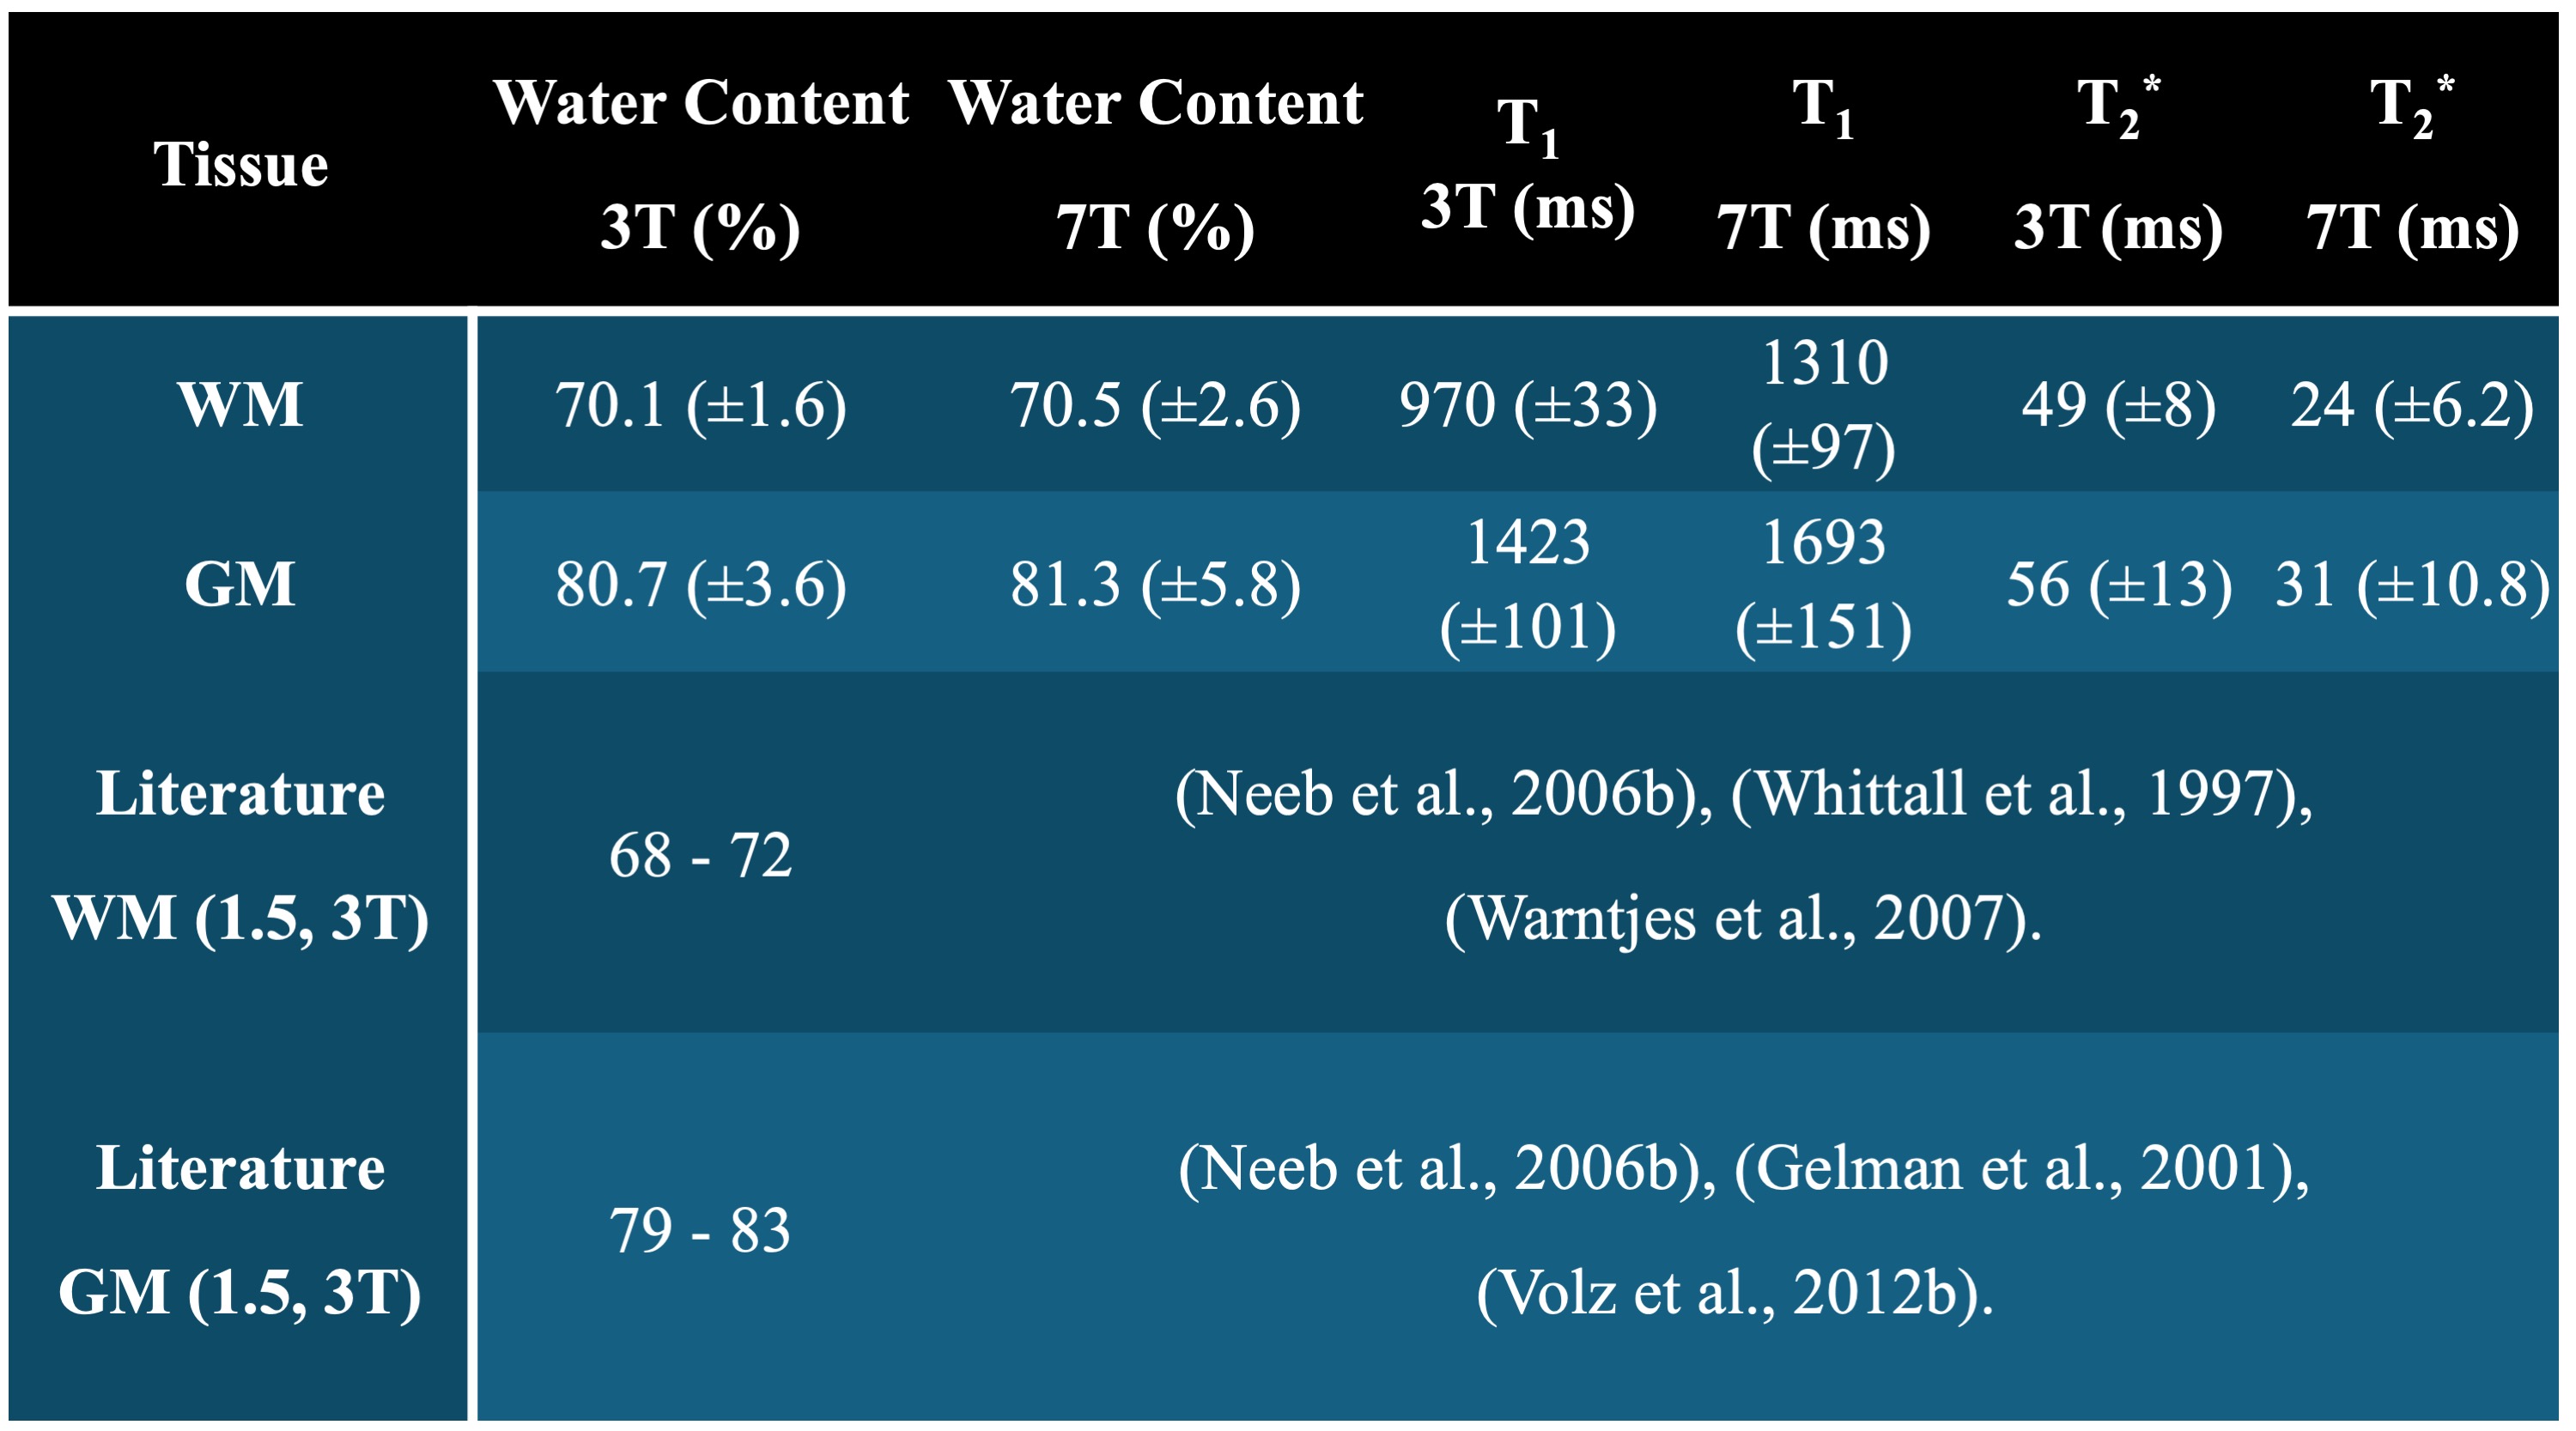
Figure 3. For the cohort, the average water content percentages, and relaxation times (T1 and T2*) measured for white matter (WM) and grey matter (GM) at both 3T and 7T MRI field strengths. Corresponding literature WM, GM water content values are reported in row 3 and row 4.
DOI: https://doi.org/10.58530/2024/3027