3026
Introducing an Automated Low-Contrast Detectability Test for the ACR MRI Phantom based on a Statistical Approach1University of Calgary, Calgary, AB, Canada, 2Alberta Health Services, Calgary, AB, Canada, 3College of Engineering and physical sciences, University of Guelph, Guelph, ON, Canada
Synopsis
Keywords: Phantoms, Software Tools, Quality assurance, ACR Phantom, Low contrast detectability
Motivation: The low-contrast object detectability test in the ACR phantom is conventionally performed manually, which results in low reproducibility of measurements due to intra- and inter-rater variability.
Goal(s): To automate the test in MRI systems and verify its reliability against the manual procedure.
Approach: The algorithm creates 1-dimensional image profiles and compares it with the known structure of the low-contrast objects using the general linear method test.
Results: Raters demonstrated substantial to almost perfect intra-rater agreement (0.786 and 0.841), and the algorithm showed perfect intra-rater agreement (1). Raters exhibited substantial inter-rater agreement (0.807), while raters and the algorithm averaged moderate inter-rater agreement (0.583).
Impact: We implemented an automated method for low-contrast object detectability of the ACR MRI phantom. The manual and automated methods showed strong intra- and inter-rater agreement, supporting its potential clinical use.
Introduction
To maintain stability of MRI systems, regular quality checks and maintenance procedures are necessary, along with the implementation of standardized imaging protocols and parameters to ensure reliability and reproducibility of the acquired data1. To this end, American College of Radiology (ACR) has developed a standardized phantom test protocol2. The ACR documentation suggested manual measurement of the parameters, which is time and labor consuming, and is prone to low accuracy, efficiency, and reproducibility3,4,5. Several attempts have been made to automate or semi-automate the ACR evaluation. However, some of the tests, including low-contrast object detectability (LCOD) is hard to automate. LCOD involves assessing the visibility of objects with different contrast levels. Slices 8 through 11 of the ACR phantom contains the contrast objects. The contrast level between the background and the objects increases from slice 8 to 11. Each of the slices contains 10 holes arranged in spokes that radiate from the center. The diameters of the spokes reduced counterclockwise. The objective of this research was to propose and evaluate an automated approach for low-contrast detectability testing in MRI, aiming to compare the results with manual procedures.Method
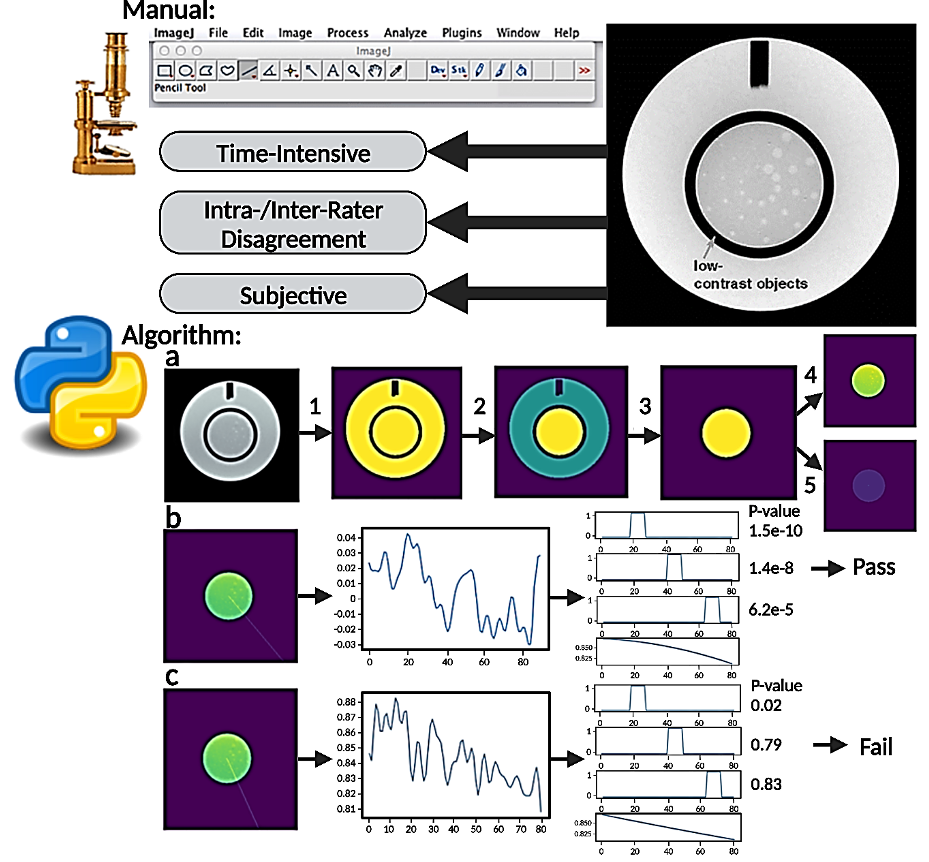
A total of 32 datasets (16 T1- and 16 T2-weighted images), each containing 11 slices of the ACR large phantom, were assessed twice by two human evaluators and the proposed algorithm, measuring pass-fail scores for the 10 spokes of slices 8 to 11 (total of 40 spokes). The manual method, as depicted in the top half of Figure 1, utilizes ImageJ software by raters and is time-intensive, subjective, and has the potential for increased intra- and inter-rater disagreement. The bottom half of Figure 1 displays the automated method. The algorithm steps are: (1) Image is binarized using histogram thresholding to remove background, (2) Connected components are identified and labeled, (3) A binary mask of the inner disk is generated by thresholding the labeled image, (4) The mask is used to remove outer disk, and (5) Center of gravity (COG) of the binary mask is calculated, which represents center of the disk. From the COG, a radial profile is generated at a designated angle, and the image intensity along this profile is sampled into a 1D array. The 1D profile is then compared against a predefined 1D template, which is created based on geometric information of the discs: An example of a passed profile is provided in (b), where all three discs have profiles significantly different from background, and an example of a failed profile is provided in (c).Results
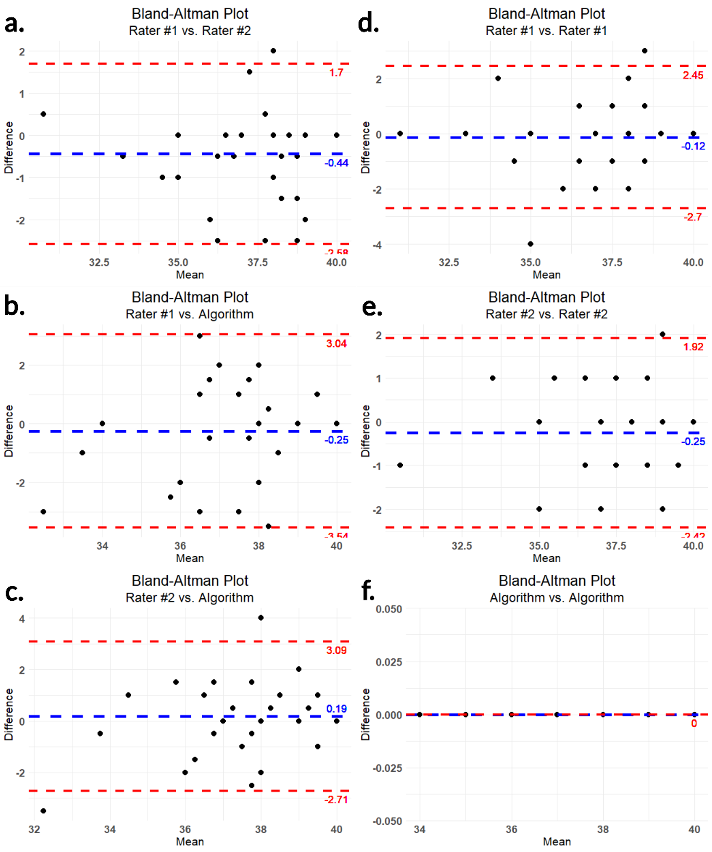
In R Studio, Cohen’s Kappa was calculated to assess intra-rater and inter-rater agreement, with squared weighting used for the calculations. Analysis of the proposed algorithm yielded perfect intra-rater agreement (1), while raters and the algorithm averaged moderate inter-rater agreement (0.583)6. On the other hand, manual raters exhibited substantial to almost perfect intra-rater agreement (0.786 and 0.841) and substantial inter-rater agreement (0.807)6. These statistically significant results (p < 0.05) can be seen in Table 1. Using the averages of the two datasets and one way agreement, the intraclass correlation coefficient (ICC) yielded a value of 0.703, with the F-Test indicating significant correlation (F (31,64) =8.11, p=1.22e-12), and the 95% confidence interval being 0.541-0.829. Bland Altman plots for intra- and inter-rater agreements are shown in Figure 2.Discussion
The proposed automated method completely removed intra-rater variability and has acceptable inter-rater agreement when compared with human raters. The ICC also demonstrated moderate reliability of the testing methods7. In the GLM of the proposed method, we used a subjective significant threshold (p=0.05 corrected for multiple comparison) to identify detectable spokes. However, it is possible to adjust the threshold to achieve higher inter-rater agreement with human raters.Conclusion
Traditionally, the assessment of low-contrast detectability is conducted manually, mirroring the way clinical images are evaluated by radiologists and other healthcare professionals. However, with the continuous progress of image processing techniques in clinical context, the medical images should be interpretable not only by humans but also by computer systems. This research was an attempt to develop an objective and automated approach for quantifying the detectability of low-contrast objects in MR images. The results suggest that the automated method can be used in a clinical setting demonstrating a high level of concordance with human assessments. The implementation of this method for regular quality assurance programs should be pursued.Acknowledgements
No acknowledgement found.References
1. Vogelbacher C, Bopp M, Schuster V, et al. LAB-QA2GO: A Free, Easy-to-Use Toolbox for the Quality Assessment of Magnetic Resonance Imaging Data. Front. Neurosci. 2019 July 3; 13:688.
2. Large and Medium Phantom Test Guidance for the American College of Radiology MRI Accreditation Program. 2022 Oct 19. 6780-PhantomTest.qxd (acraccreditation.org).
3. Epistatou A, Tsalafoutas I and Delibasis K. An Automated Method for Quality Control in MRI Systems: Methods and Considerations. Journal of imaging. 2020; 6(10):111.
4. Alaya I, Telmoudi M, Guesmi R, et al. Development of ACR quality control procedure for automatic assessment of spatial metrics in MRI. Biomedical Research. 2021; 32 (3):68-74.
5. Buatti, J. Quality Assurance Testing Evaluation and Comparison for Magnetic Resonance Simulator and Non-Simulator for Magnetic Resonance Imaging Modalities. Oregon Health & Science University. 2020.
6. McHugh M. Interrater reliability: the kappa statistic. Biochemia medica. 2012; 22(3):276-282.
7. Bobak C, Barr P and O’Malley A. Estimation of an inter-rater intra-class correlation coefficient that overcomes common assumption violations in
Figures