3024
Novel synthetic MPRAGElike contrast from Multi-Parameter Mapping at 7T1Department of Physics, NTNU, Trondheim, Norway, 2DZNE, Bonn, Germany, 3GIGA-CRC In Vivo Imaging, University of Liège, Liège, Belgium, 4Department of Physics and Astronomy, University of Bonn, Bonn, Germany
Synopsis
Keywords: Data Processing, Brain, High-Field MRI, Data Analysis, Analysis/Processing, Neuroscience, Multi-Contrast, Data processing, Neuro, Signal Representations
Motivation: MPRAGE is the standard high-resolution T1w sequence used for anatomical MRI. Very few sequences propose such a high Gray-White matter contrast with high-resolution.
Goal(s): Propose a novel technique that computes MPRAGElike images if spoiled GRE images with different T1w (and more) contrasts are available.
Approach: MPRAGE and Multi-Parameter Mapping (MPM) images were acquired on 16 subjects across three 7T sites. MPM images were used to produce three variations of MPRAGElike and one synMPRAGE images. SNR and CNR were evaluated against the MPRAGE.
Results: Our proposed MPRAGElike technique gave larger SNR than MPRAGE in most ROIs while also having superior CNR compared to synMPRAGE.
Impact: Neuroscientists with Multi-Parameter Mapping sequences in their protocols can compute MPRAGElike images which exhibit highly similar image quality as a typical MPRAGE and better than one previously reported technique producing synthetic MPRAGE.
Introduction
Imaging protocols for neurodegenerative disease characterization usually include several anatomical sequences with high contrast, sometimes extended by quantitative parameter mapping. Altogether, this results in lengthy protocols. Amongst quantitative methods, Multi-Parameter Mapping1 (MPM) or related Variable Flip Angle2 (VFA) methods use multi-contrast spoiled-GRE images for the calculation of quantitative maps (qMaps) in relatively short time3 and have become valuable tools for multi-center neuro-imaging studies.However, MPM/VFA images do not provide the required contrast for brain segmentation purposes, mandating the acquisition of additional high-resolution T1w sequences like MPRAGE4. Thus, the resulting scan-time can become prohibitively long.
Here, we propose a novel ‘synthetic MPRAGE’5 image named MPRAGElike directly derived from MPM images without parameter fitting, which can be used as an surrogate MPRAGE image. The proposed MPRAGElike technique was evaluated against an MPRAGE optimized for 7T and another previously proposed synthetic MPRAGE technique named synMPRAGE5.
Methods
16 healthy volunteers were scanned on two 7T Terra and one 7TPlus Magnetom systems (Siemens Healthineers, Erlangen, Germany) at three sites. All sites used a 8Tx-32Rx head coil (Nova Medical, Wilmington, Delaware) in pTx mode. The study was approved by the local review boards of each site and volunteers signed a written informed consent form before scanning.MPM, MPRAGE and B1+ map were acquired for each subject. The MPM protocol consisted of a multi-echo skipped-CAIPI 3D-EPI6 at (0.6mm)3 resolution with MTw, PDw and T1w contrasts (4 TEs each). Both MPM and MPRAGE used Universal pTx pulses7 (UP) created from a database of B0-B1 maps acquired at all sites previously. The B1+ map was acquired with the Actual Flip Angle Imaging8 (AFI) technique. Acquisition parameters are shown in Table 1.
Marchenko-Pastur PCA denoising9-12 was applied to the complex-valued MPM images. Then, the MPM magnitude images and B1+ map were processed by the hMRI toolbox13 (v0.3.0) embedded in SPM1214 to calculate B1+-corrected R1, PD, MTsat, and R2* maps and coregistering the MPRAGE to the MPM.
Three variations of MPRAGElike images were computed following the equations shown in Figure 2 using the 1st TE magnitude images. For background noise removal, a regularization factor λ was introduced15. Three values of λ were tested: 100, 300 and 500. The synMPRAGE images were generated from the R1 map using the same protocol parameters as the acquired MPRAGE. N4 bias-field correction16-17 was applied to all images to correct for signal inhomogeneities. The complete pipeline is shown in Figure 2.
For quantitative assessment of images, Signal-to-Noise (SNR) and Contrast-to-Noise Ratios (CNR) were calculated in several regions-of-interests (ROIs).
Results and Discussion
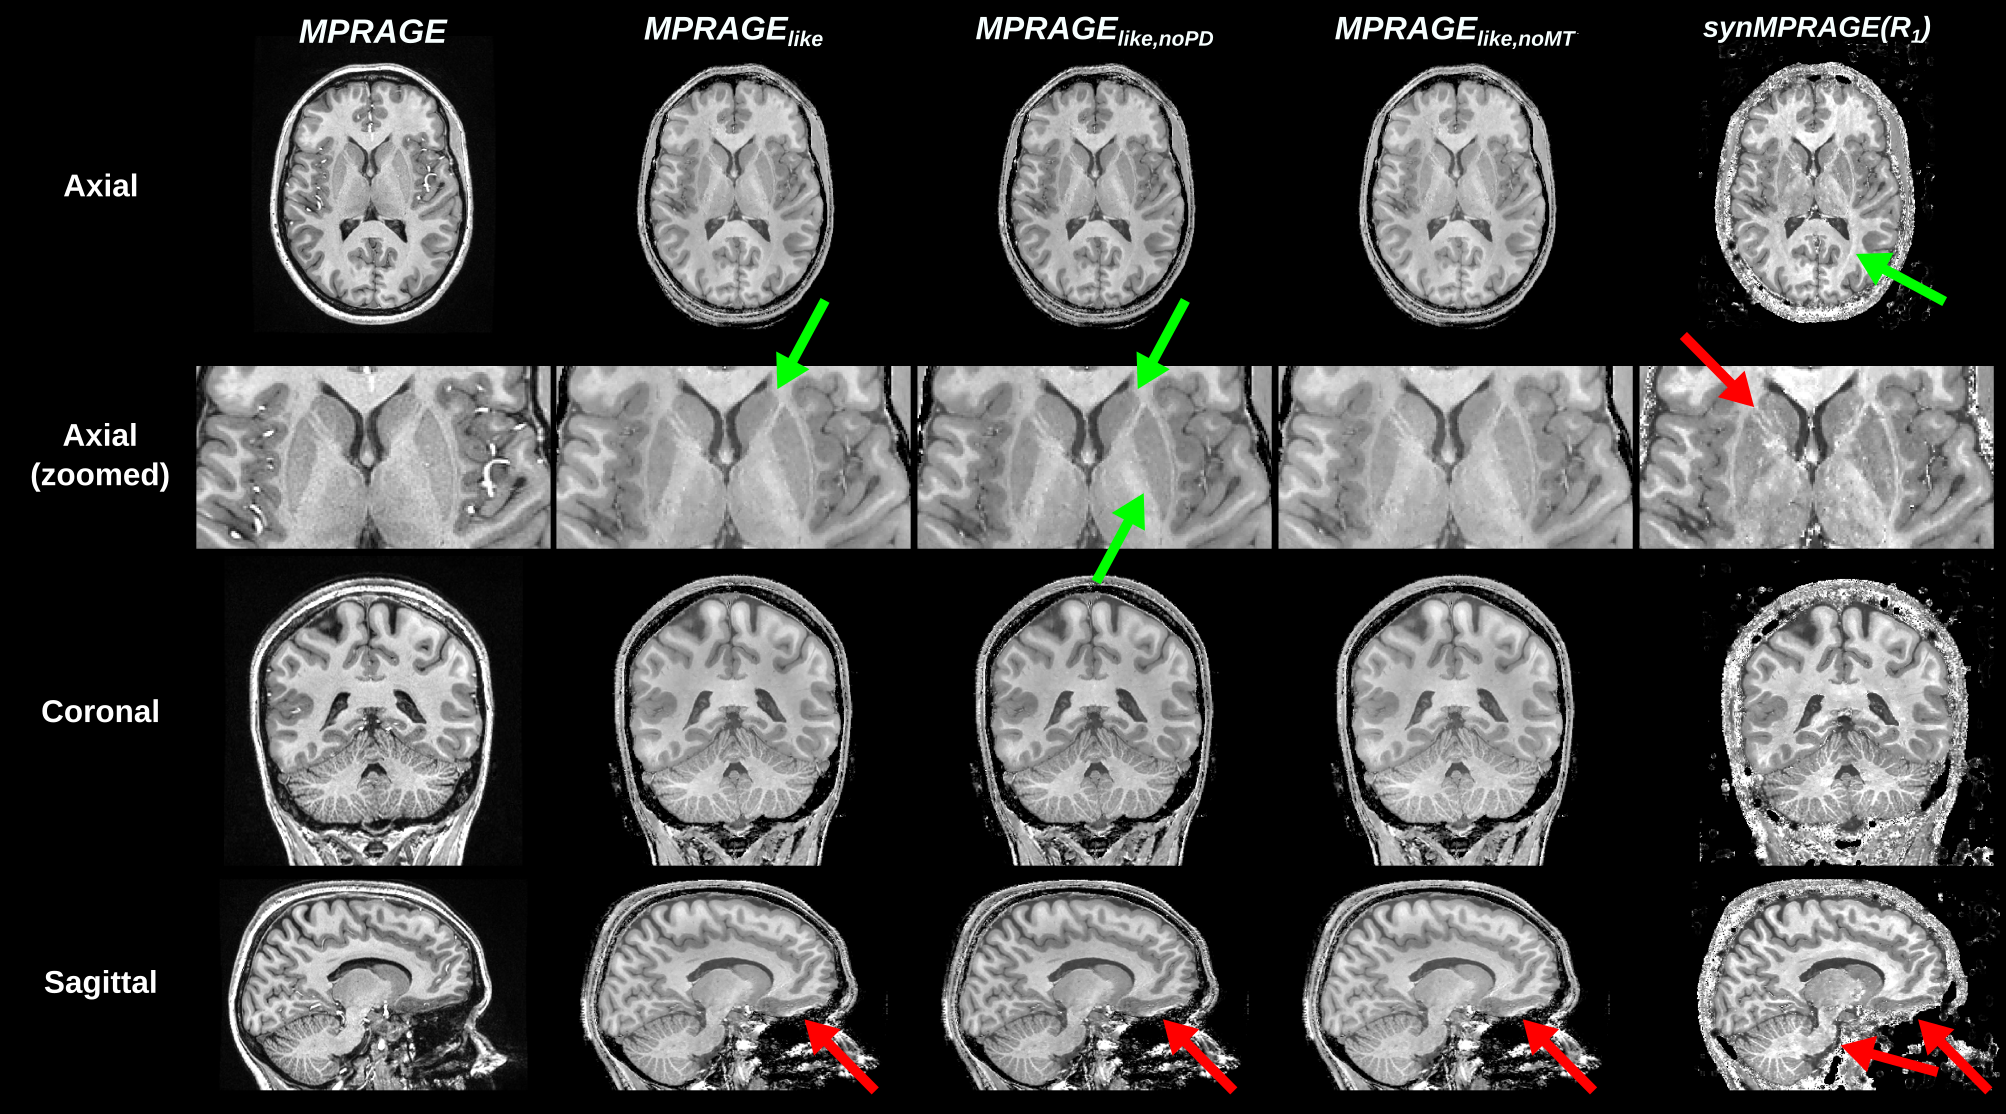
Increasing the value of λ increased contrast, at the cost of decreasing signal homogeneity across the brain as shown in Figure 3. Interestingly, with CP-mode instead of UPs, this regularization approach cannot retain tissue contrast, as recently shown18. The relative signal difference to the unregularized image (λ=0) showed that signal inhomogeneities quickly dominate in the cerebellum and temporal lobes, as observed in another study using the same regularization principle15. This can be partly compensated by applying N4-correction. Future investigations will determine more thoroughly the optimal λ value. Importantly, the MPRAGElike can potentially serve as a surrogate to MPRAGE for automated brain segmentation (Fig. 3) with exactly matching geometric distortions to the derived qMaps.The MPRAGE, three variations of MPRAGElikes with λ=100 and synMPRAGE are illustrated on Figure 4. The three MPRAGElikes appeared highly similar between each other. All exhibited signal brightening in the cortex above the sinuses. This brightening was not observed for MPRAGE, possibly due to slightly longer TEs in MPM compared to MPRAGE. Moreover, MPRAGElikes showed great delineation of subcortical structures like the caudate and putamen.
Excellent White-Gray matter (WM-GM) contrast was observed for synMPRAGE. However, synMPRAGE was more noisy than MPRAGElikes since it suffers from R1 estimation errors. Conversely, it showed anatomical WM details (e.g., optic radiation) neither seen in MPRAGElike nor MPRAGE.
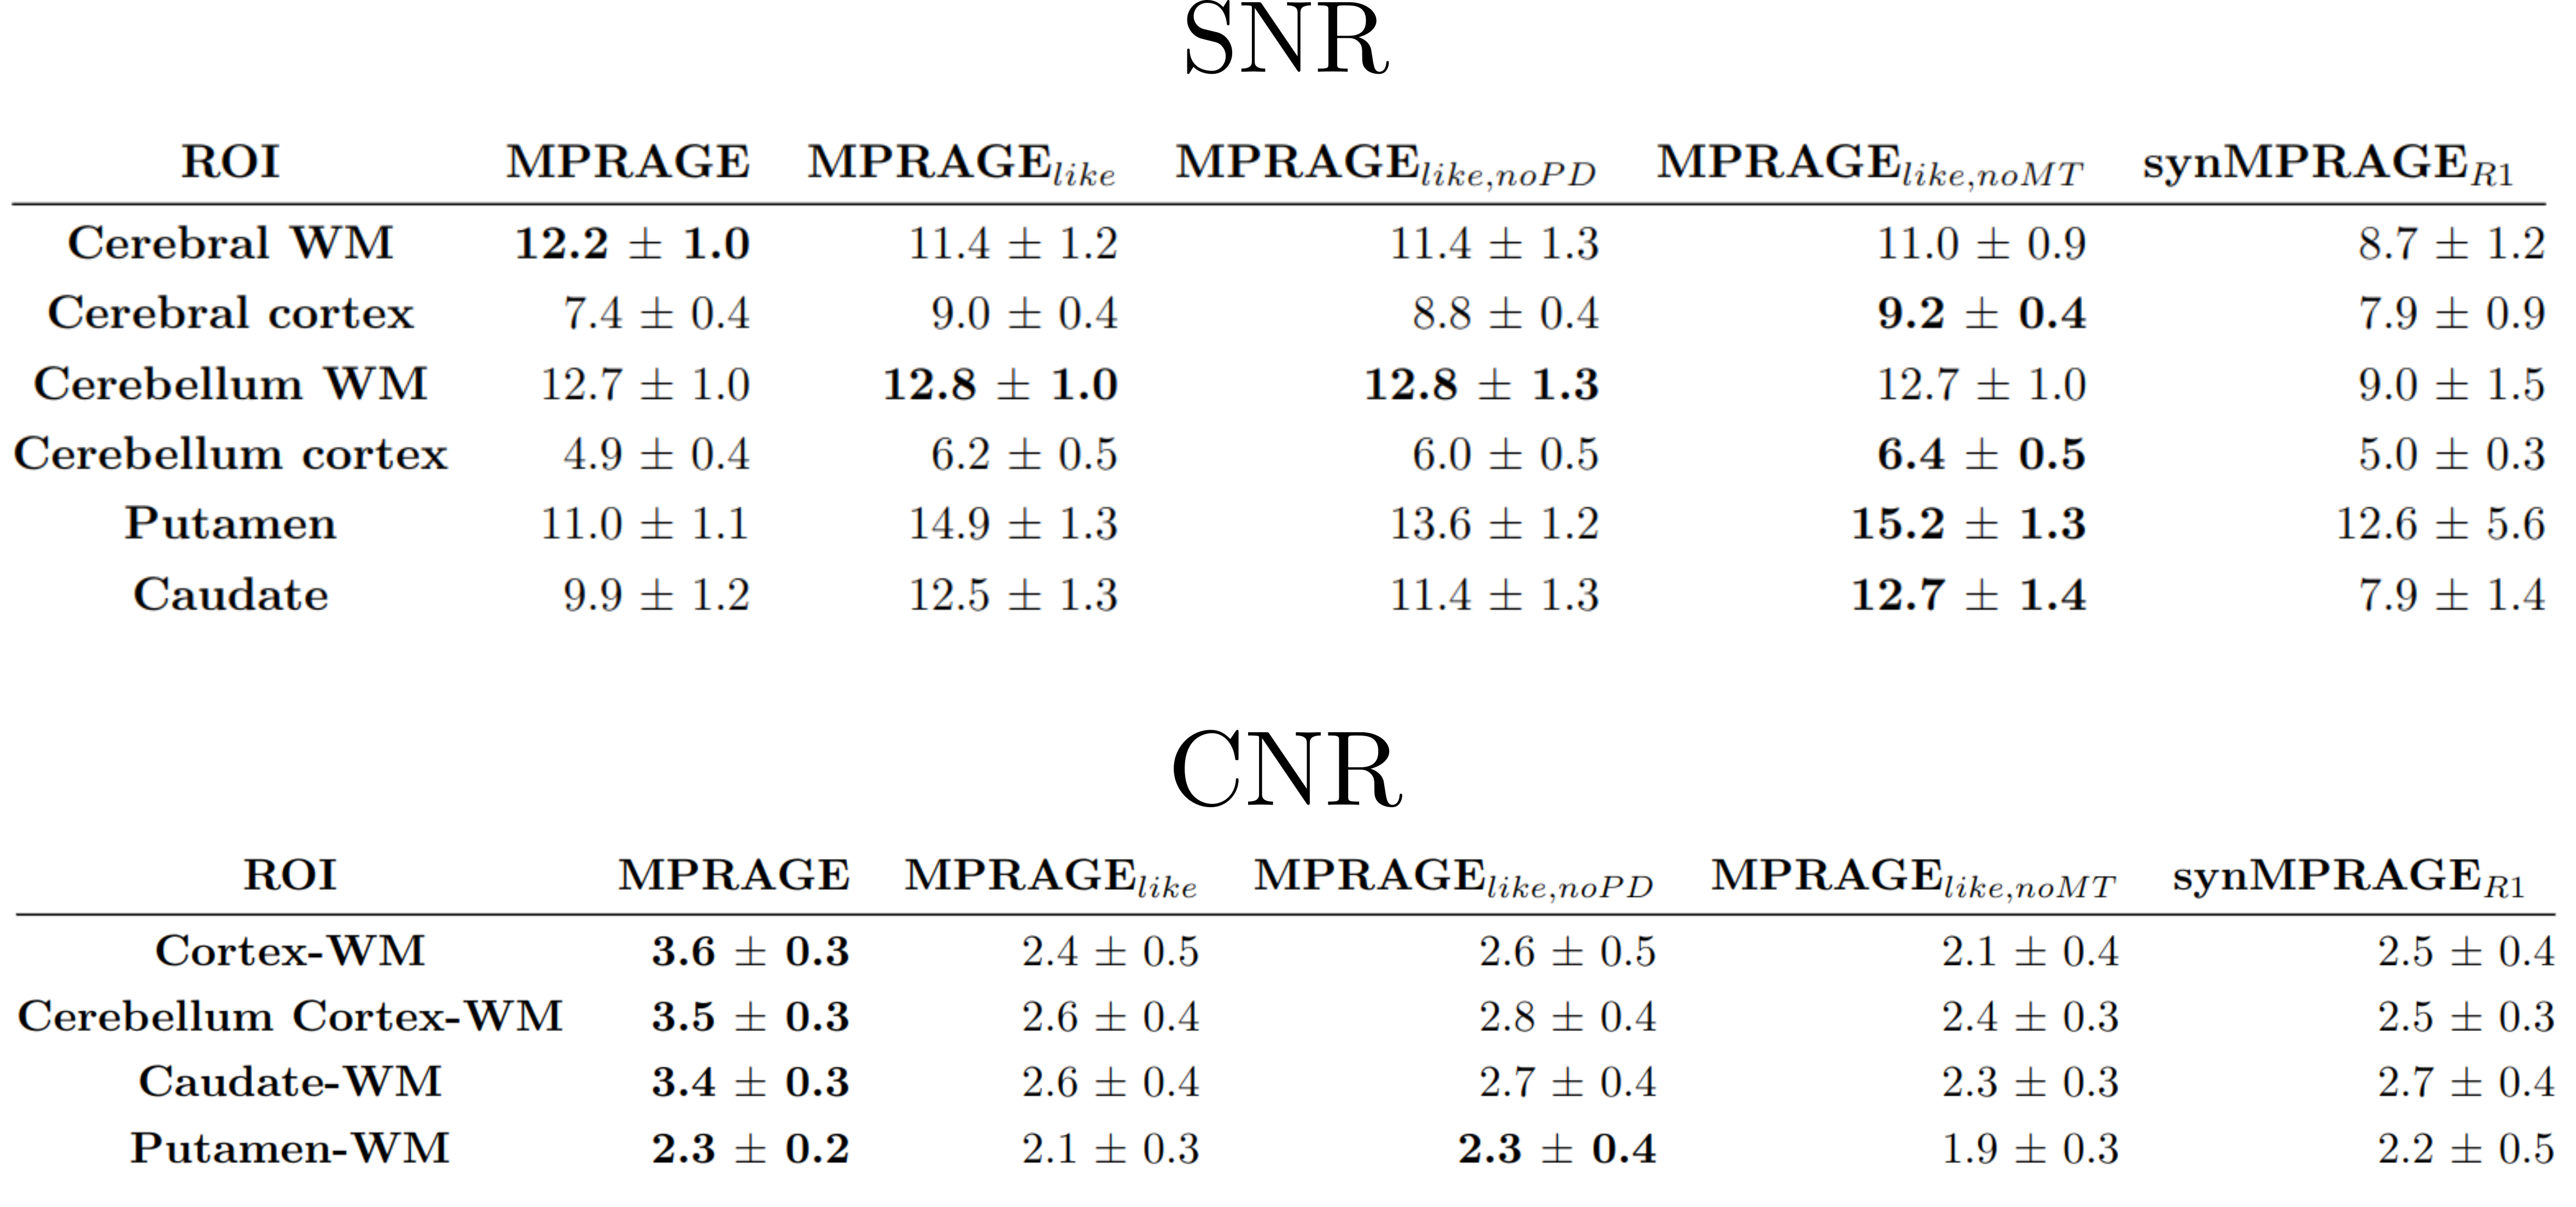
SNR and CNR values computed for ROIs are shown in Table 2. In cerebral WM, MPRAGE had the highest SNR, while one of the MPRAGElikes gave the largest SNR for the remaining ROIs. MPRAGElike,noMT had four of the highest SNR values.
MPRAGE had the highest CNR values with MPRAGElike,noPD being the second best. MPRAGElike,noMT produced the lowest CNR values across all ROIs.
One additional advantage of MPRAGElike over synMRPAGE is its straightforward computation from the MPM images directly without the need for qMaps.
Conclusion
MPRAGElike offers a more robust and simpler implementation than synMPRAGE when trying to synthetize T1w MPRAGE contrast. Thus, neuroscientists with MPM in their imaging protocols should consider computing MPRAGElike images instead of synMPRAGEs.Acknowledgements
No acknowledgement found.References
Weiskopf, N., & Helms, G. (2008). Multi-parameter mapping of the human brain at 1mm resolution in less than 20 minutes. Proceedings of 16th ISMRM, Toronto, Canada, 16, 2241.
Fram, E. K., Herfkens, R. J., Johnson, G. A., Glover, G. H., Karis, J. P., Shimakawa, A., ... & Pelc, N. J. (1987). Rapid calculation of T1 using variable flip angle gradient refocused imaging. Magnetic resonance imaging, 5(3), 201-208.
Wang, D., Ehses, P., Stöcker, T., & Stirnberg, R. (2022). Reproducibility of rapid multi‐parameter mapping at 3T and 7T with highly segmented and accelerated 3D‐EPI. Magnetic resonance in medicine, 88(5), 2217-2232.
Mugler III, J. P., & Brookeman, J. R. (1990). Three‐dimensional magnetization‐prepared rapid gradient‐echo imaging (3D MP RAGE). Magnetic resonance in medicine, 15(1), 152-157.
Nöth, U., Hattingen, E., Bähr, O., Tichy, J., & Deichmann, R. (2015). Improved visibility of brain tumors in synthetic MP‐RAGE anatomies with pure T1 weighting. NMR in Biomedicine, 28(7), 818-830.
Stirnberg, R., & Stöcker, T. (2021). Segmented K-space blipped-controlled aliasing in parallel imaging for high spatiotemporal resolution EPI. Magnetic resonance in medicine, 85(3), 1540–1551.
Gras, V., Vignaud, A., Amadon, A., Le Bihan, D., & Boulant, N. (2017). Universal pulses: a new concept for calibration‐free parallel transmission. Magnetic resonance in medicine, 77(2), 635-643.
Yarnykh, V. L. (2007). Actual flip‐angle imaging in the pulsed steady state: a method for rapid three‐dimensional mapping of the transmitted radiofrequency field. Magnetic Resonance in Medicine: An Official Journal of the International Society for Magnetic Resonance in Medicine, 57(1), 192-200.
Veraart, J., Novikov, D. S., Christiaens, D., Ades-Aron, B., Sijbers, J., & Fieremans, E. (2016). Denoising of diffusion MRI using random matrix theory. Neuroimage, 142, 394-406.
Veraart, J., Fieremans, E., & Novikov, D. S. (2016). Diffusion MRI noise mapping using random matrix theory. Magnetic resonance in medicine, 76(5), 1582-1593.
Cordero-Grande, L., Christiaens, D., Hutter, J., Price, A. N., & Hajnal, J. V. (2019). Complex diffusion-weighted image estimation via matrix recovery under general noise models. Neuroimage, 200, 391-404.
Tournier, J. D., Smith, R., Raffelt, D., Tabbara, R., Dhollander, T., Pietsch, M., ... & Connelly, A. (2019). MRtrix3: A fast, flexible and open software framework for medical image.
Tabelow, K., Balteau, E., Ashburner, J., Callaghan, M. F., Draganski, B., Helms, G., ... & Mohammadi, S. (2019). hMRI–A toolbox for quantitative MRI in neuroscience and clinical research. Neuroimage, 194, 191-210.
Ashburner, J., Barnes, G., Chen, C. C., Daunizeau, J., Flandin, G., Friston, K., ... & Penny, W. (2014). SPM12 manual. Wellcome Trust Centre for Neuroimaging, London, UK, 2464(4).
O'Brien, K. R., Kober, T., Hagmann, P., Maeder, P., Marques, J., Lazeyras, F., ... & Roche, A. (2014). Robust T1-weighted structural brain imaging and morphometry at 7T using MP2RAGE. PloS one, 9(6), e99676.
N4: Tustison, N. J., Avants, B. B., Cook, P. A., Zheng, Y., Egan, A., Yushkevich, P. A., & Gee, J. C. (2010). N4ITK: improved N3 bias correction. IEEE transactions on medical imaging, 29(6), 1310–1320. https://doi.org/10.1109/TMI.2010.2046908
ANTs: Avants, Brian B., Nick Tustison, and Gang Song. "Advanced normalization tools (ANTS)." Insight j 2.365 (2009): 1-35.
Stirnberg R., Völzke Y., Löwen D., Pracht E., … & Stöcker T. (2023). High-resolution whole-brain multi-parameter mapping at 7 Tesla with interleaved fly-back 3D-EPI and universal pTX pulses. Proceedings of the International Society of Magnetic Resonance in Medicine, 2023, Toronto. 0272.
Figures
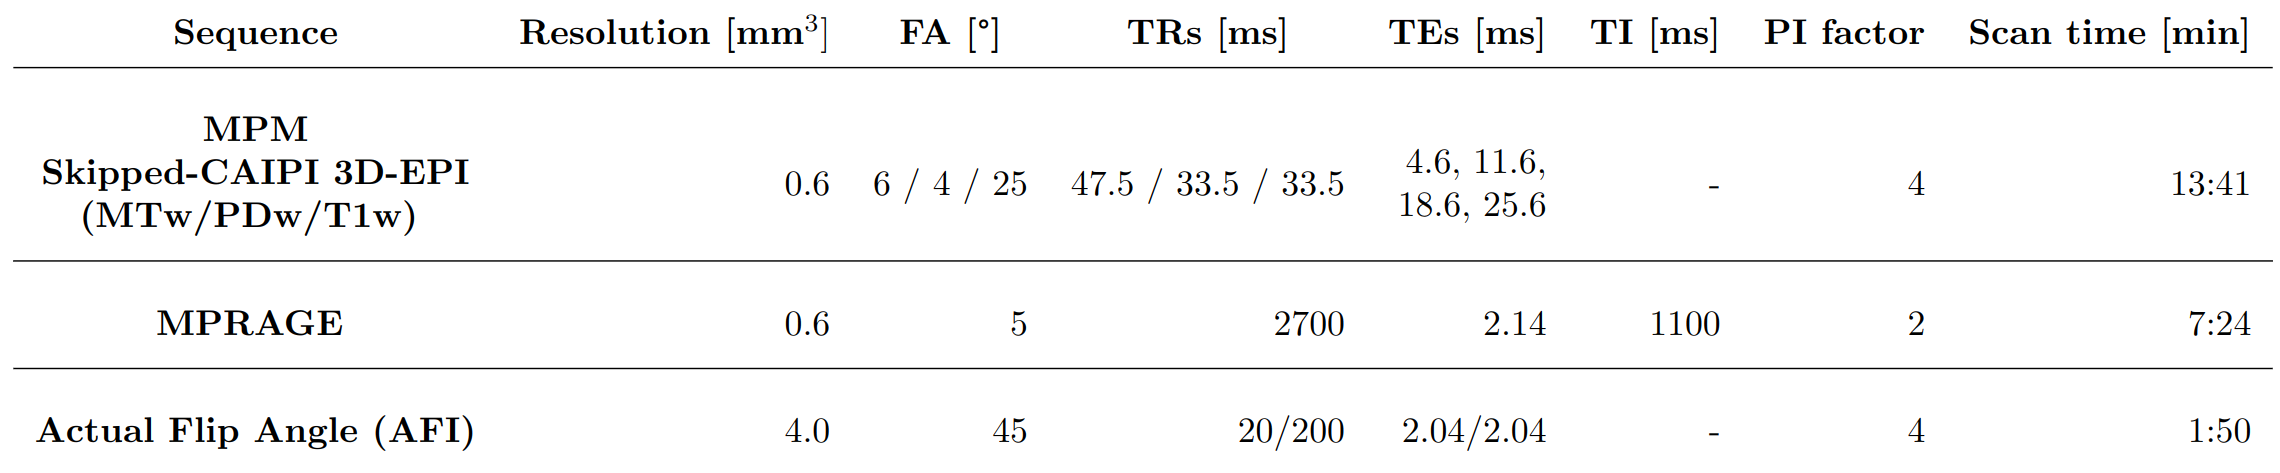
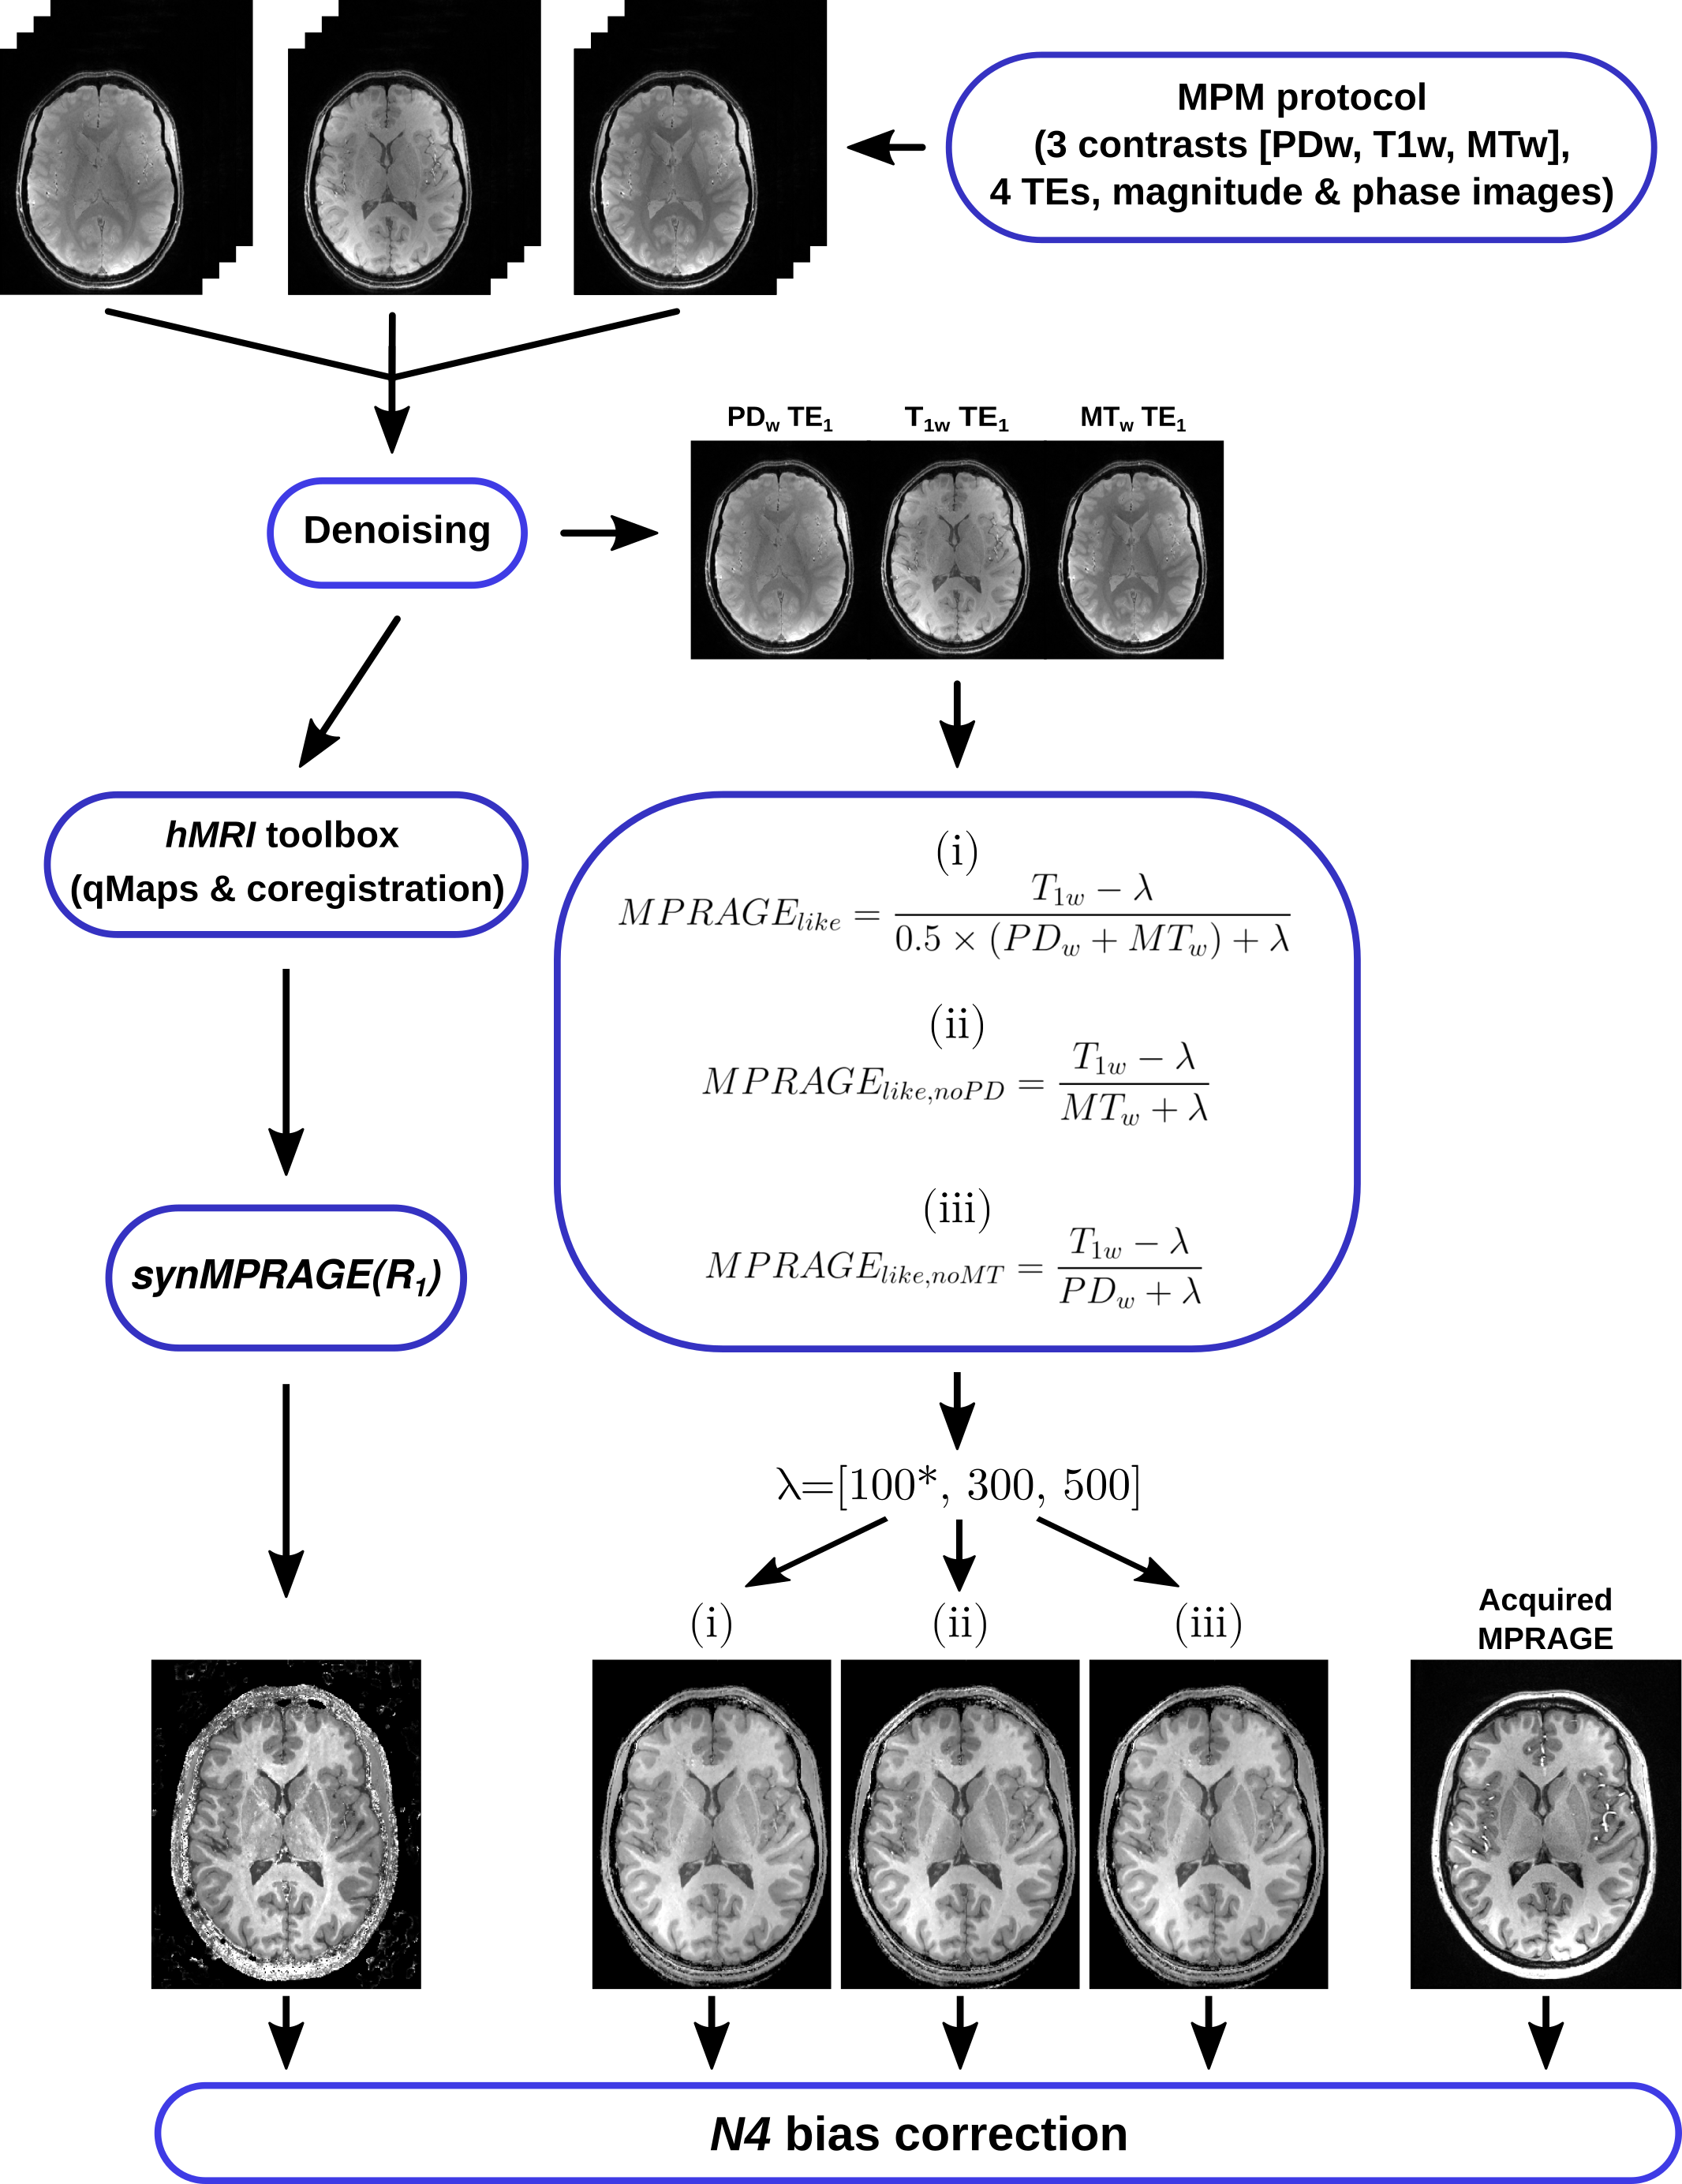
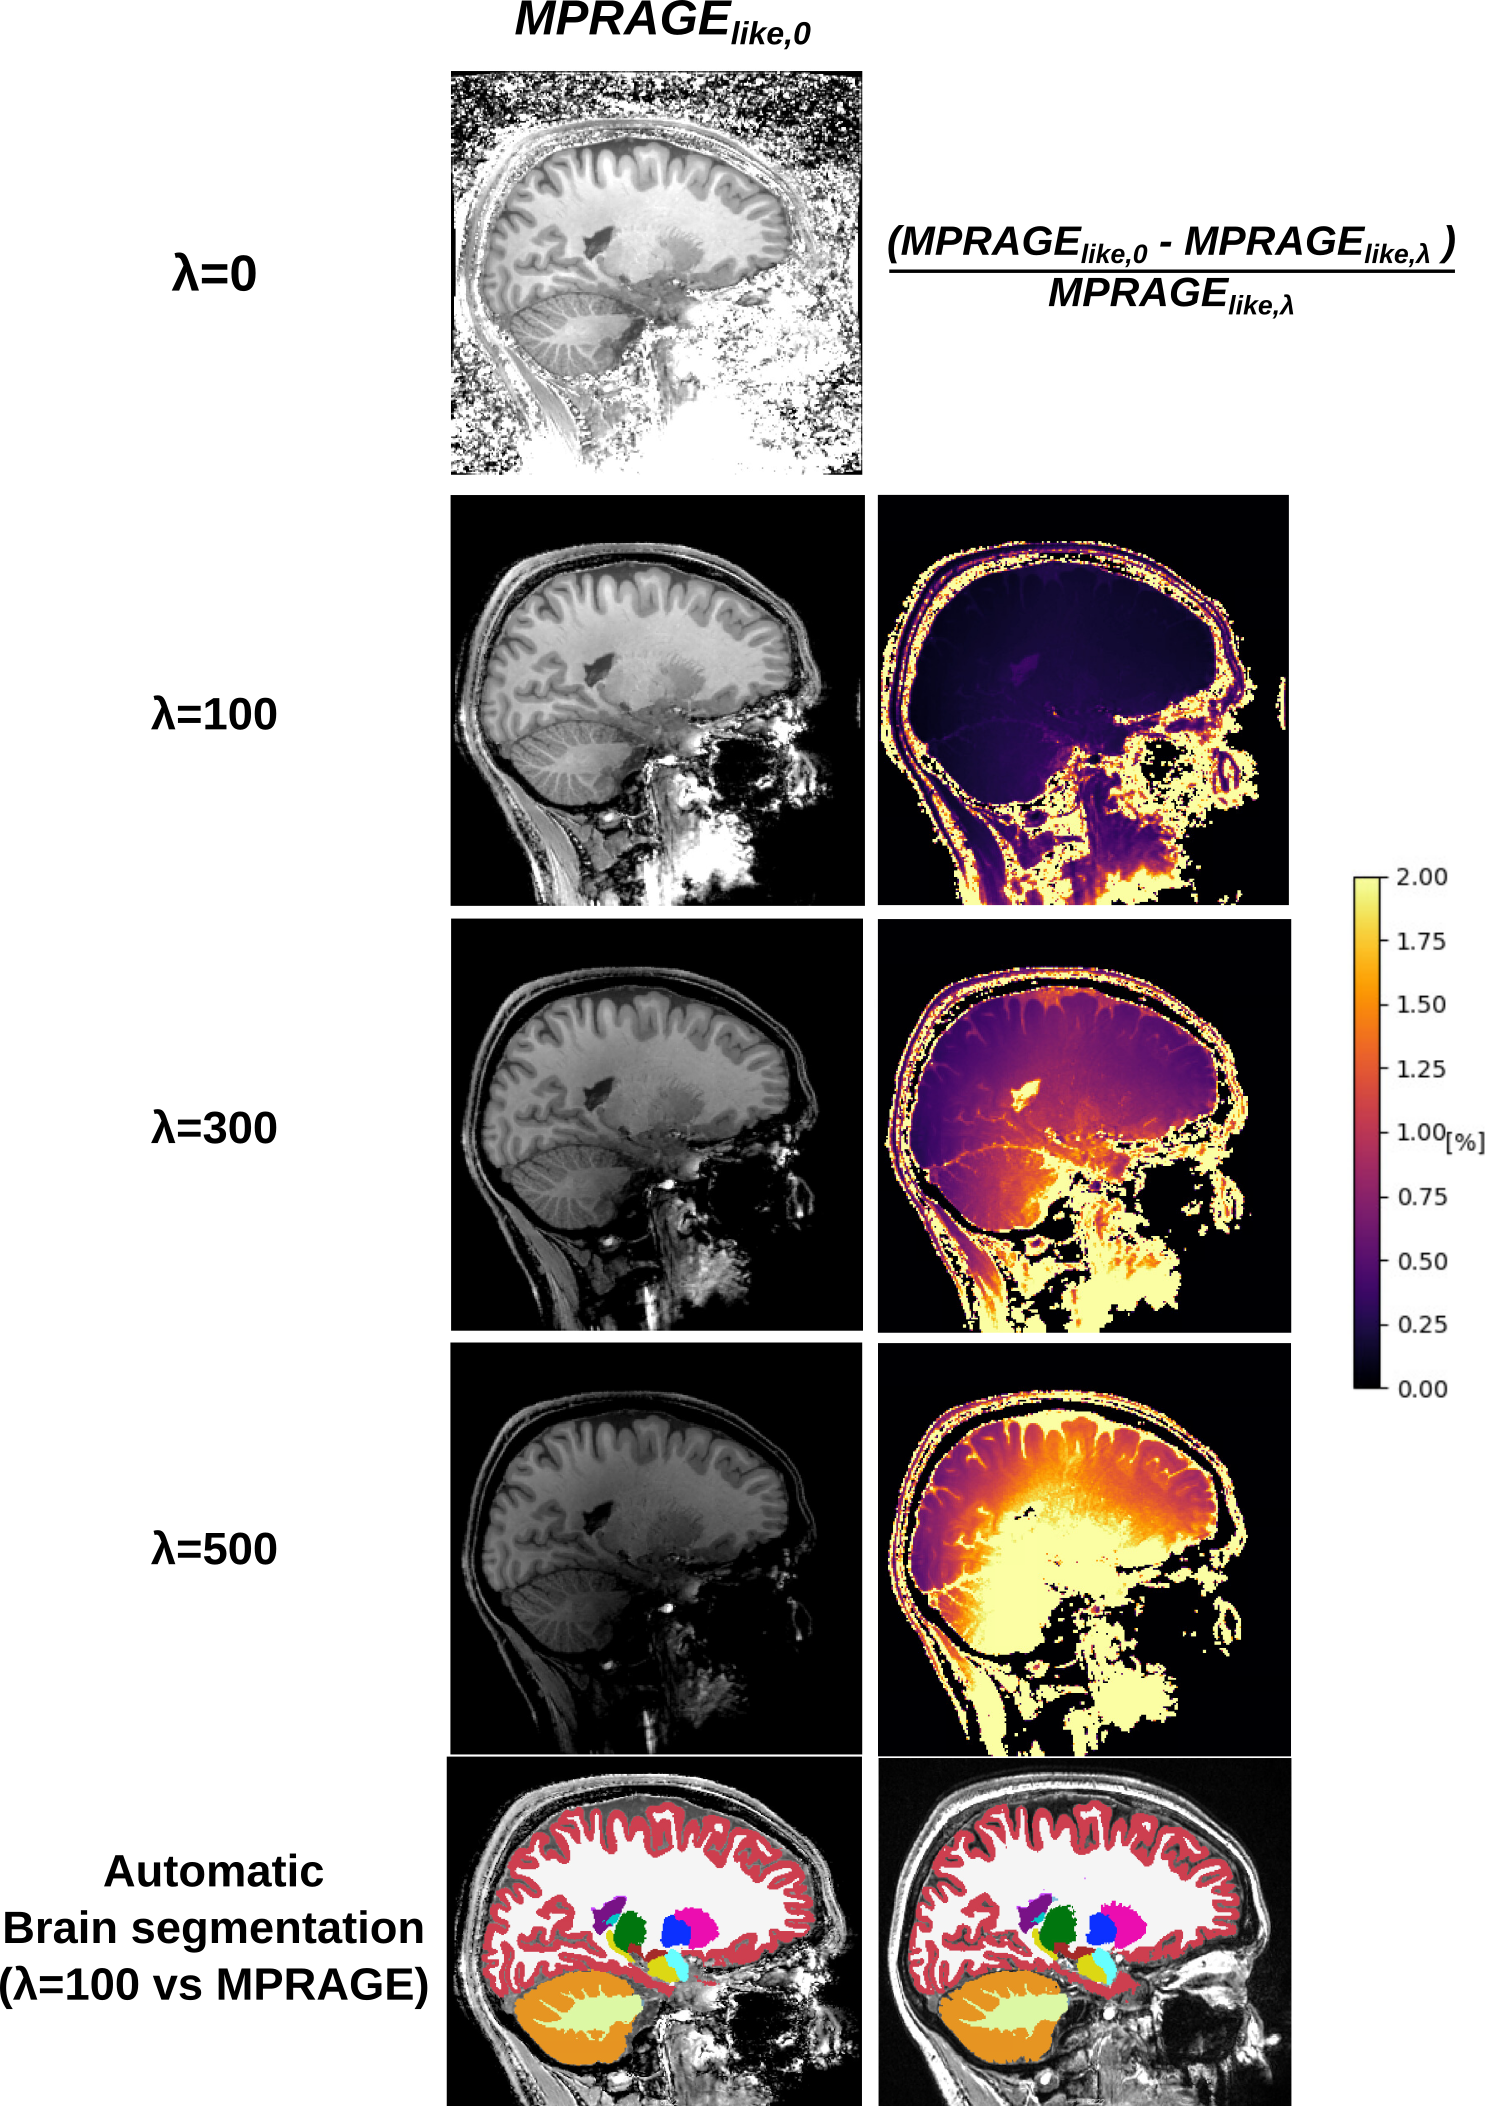
Figure 3: Impact on signal intensity of MPRAGElike images by increasing the regularization factor λ. The MPRAGElike images are shown on the left column whereas the relative difference to λ=0 from the respective λ>0 case are shown on the right for each λ. Only the relative differences for MPRAGElike are shown since the differences with the MPRAGElike-noPD and MPRAGElike-noMT were negligible. The bottom row demonstrates an example of automated brain segmentation with λ=100 compared to the MPRAGE reference.