3022
Automatic Quantitative 3D Aneurysm Wall Enhancement Mapping Based on Magnetic Resonance Imaging: a pilot study1Center for Biomedical Imaging Research, Department of Biomedical Engineering, Tsinghua University, Beijing, China
Synopsis
Keywords: Software Tools, Software Tools, Aneurysm Wall Enhancement
Motivation: Aneurysm wall enhancement visualized on high-resolution magnetic resonance imaging is considered as an indicator of inflammation.
Goal(s): Recently, there has been increased attention on 3D AWE mapping, which is seen as an objective tool for examining rupture risk of aneurysms.However, the roughly estimated vessel wall location and thickness result in some measurement errors.
Approach: In this study, we propose a fast measurement method that can automatically access wall thickness and generate the 3D spatial distribution of wall enhancement ratio.
Results: The automatic method simplifies and accelerates the workflow of aneurysm wall identification and analysis.
Impact: We propose a fast measurement method that can automatically access wall thickness and generate the 3D spatial distribution of wall enhancement ratio. The automatic method simplifies and accelerates the workflow of aneurysm wall identification and analysis.
INTRODUCTION
The prevalence of intracranial aneurysms (IA) is estimated to be 3%-5% worldwide[1]. The rupture of IAs can be a catastrophic event and leading to intracranial subarachnoid hemorrhage, which has a mortality rate of up to 50%[2]. Increasing histopathological evidence suggested that the inflammation processes on vessel wall may mediate the growth and rupture of IA[3]. Aneurysm wall enhancement (AWE) visualized on high-resolution magnetic resonance imaging (HR-MRI) is considered as an indicator of inflammation[4]. Recently, there has been increased attention on 3D AWE mapping[5, 6, 7], which is seen as an objective tool for examining rupture risk of aneurysms. However, the roughly estimated vessel wall location and thickness result in some measurement errors. Meanwhile, more accurate measurement of the vessel wall requires too much manual operation. In this study, we propose a fast measurement method that can automatically access wall thickness and generate the 3D spatial distribution of wall enhancement ratio.METHODS
MRI acquisitionMRI sequences including 3D black-blood T1-weighted volumetric isotropic turbo spin echo acquisition (T1) and TOF were performed on a 3.0T Philips Achieva scanner. The parameters for T1 and CE-T1 were as follows: TR/TE=800/21ms, FOV=200x180x40mm3, voxel size = 0.6x0.6x0.6mm3. The parameters for TOF were TR/TE = 25/3.5ms, FOV = 160×160×60mm3, voxel size = 0.8×0.8×0.8mm3. CE-T1 was performed about 6 min after an injection of GdDTPA.
3D AWE assessment
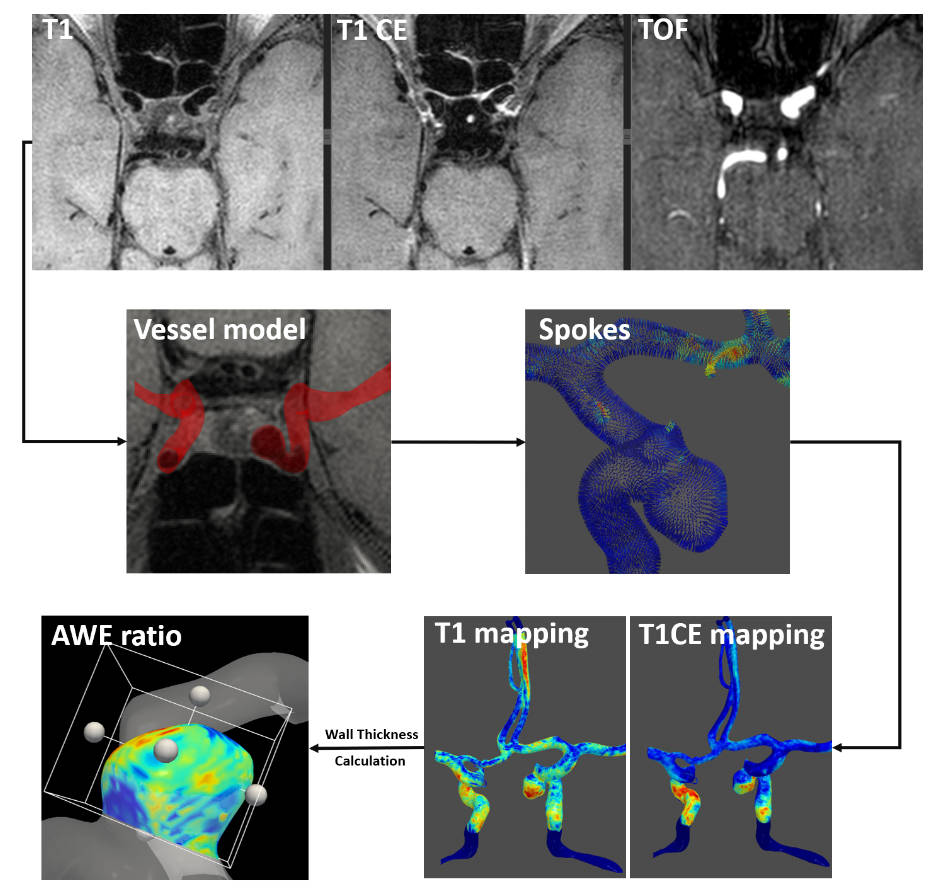
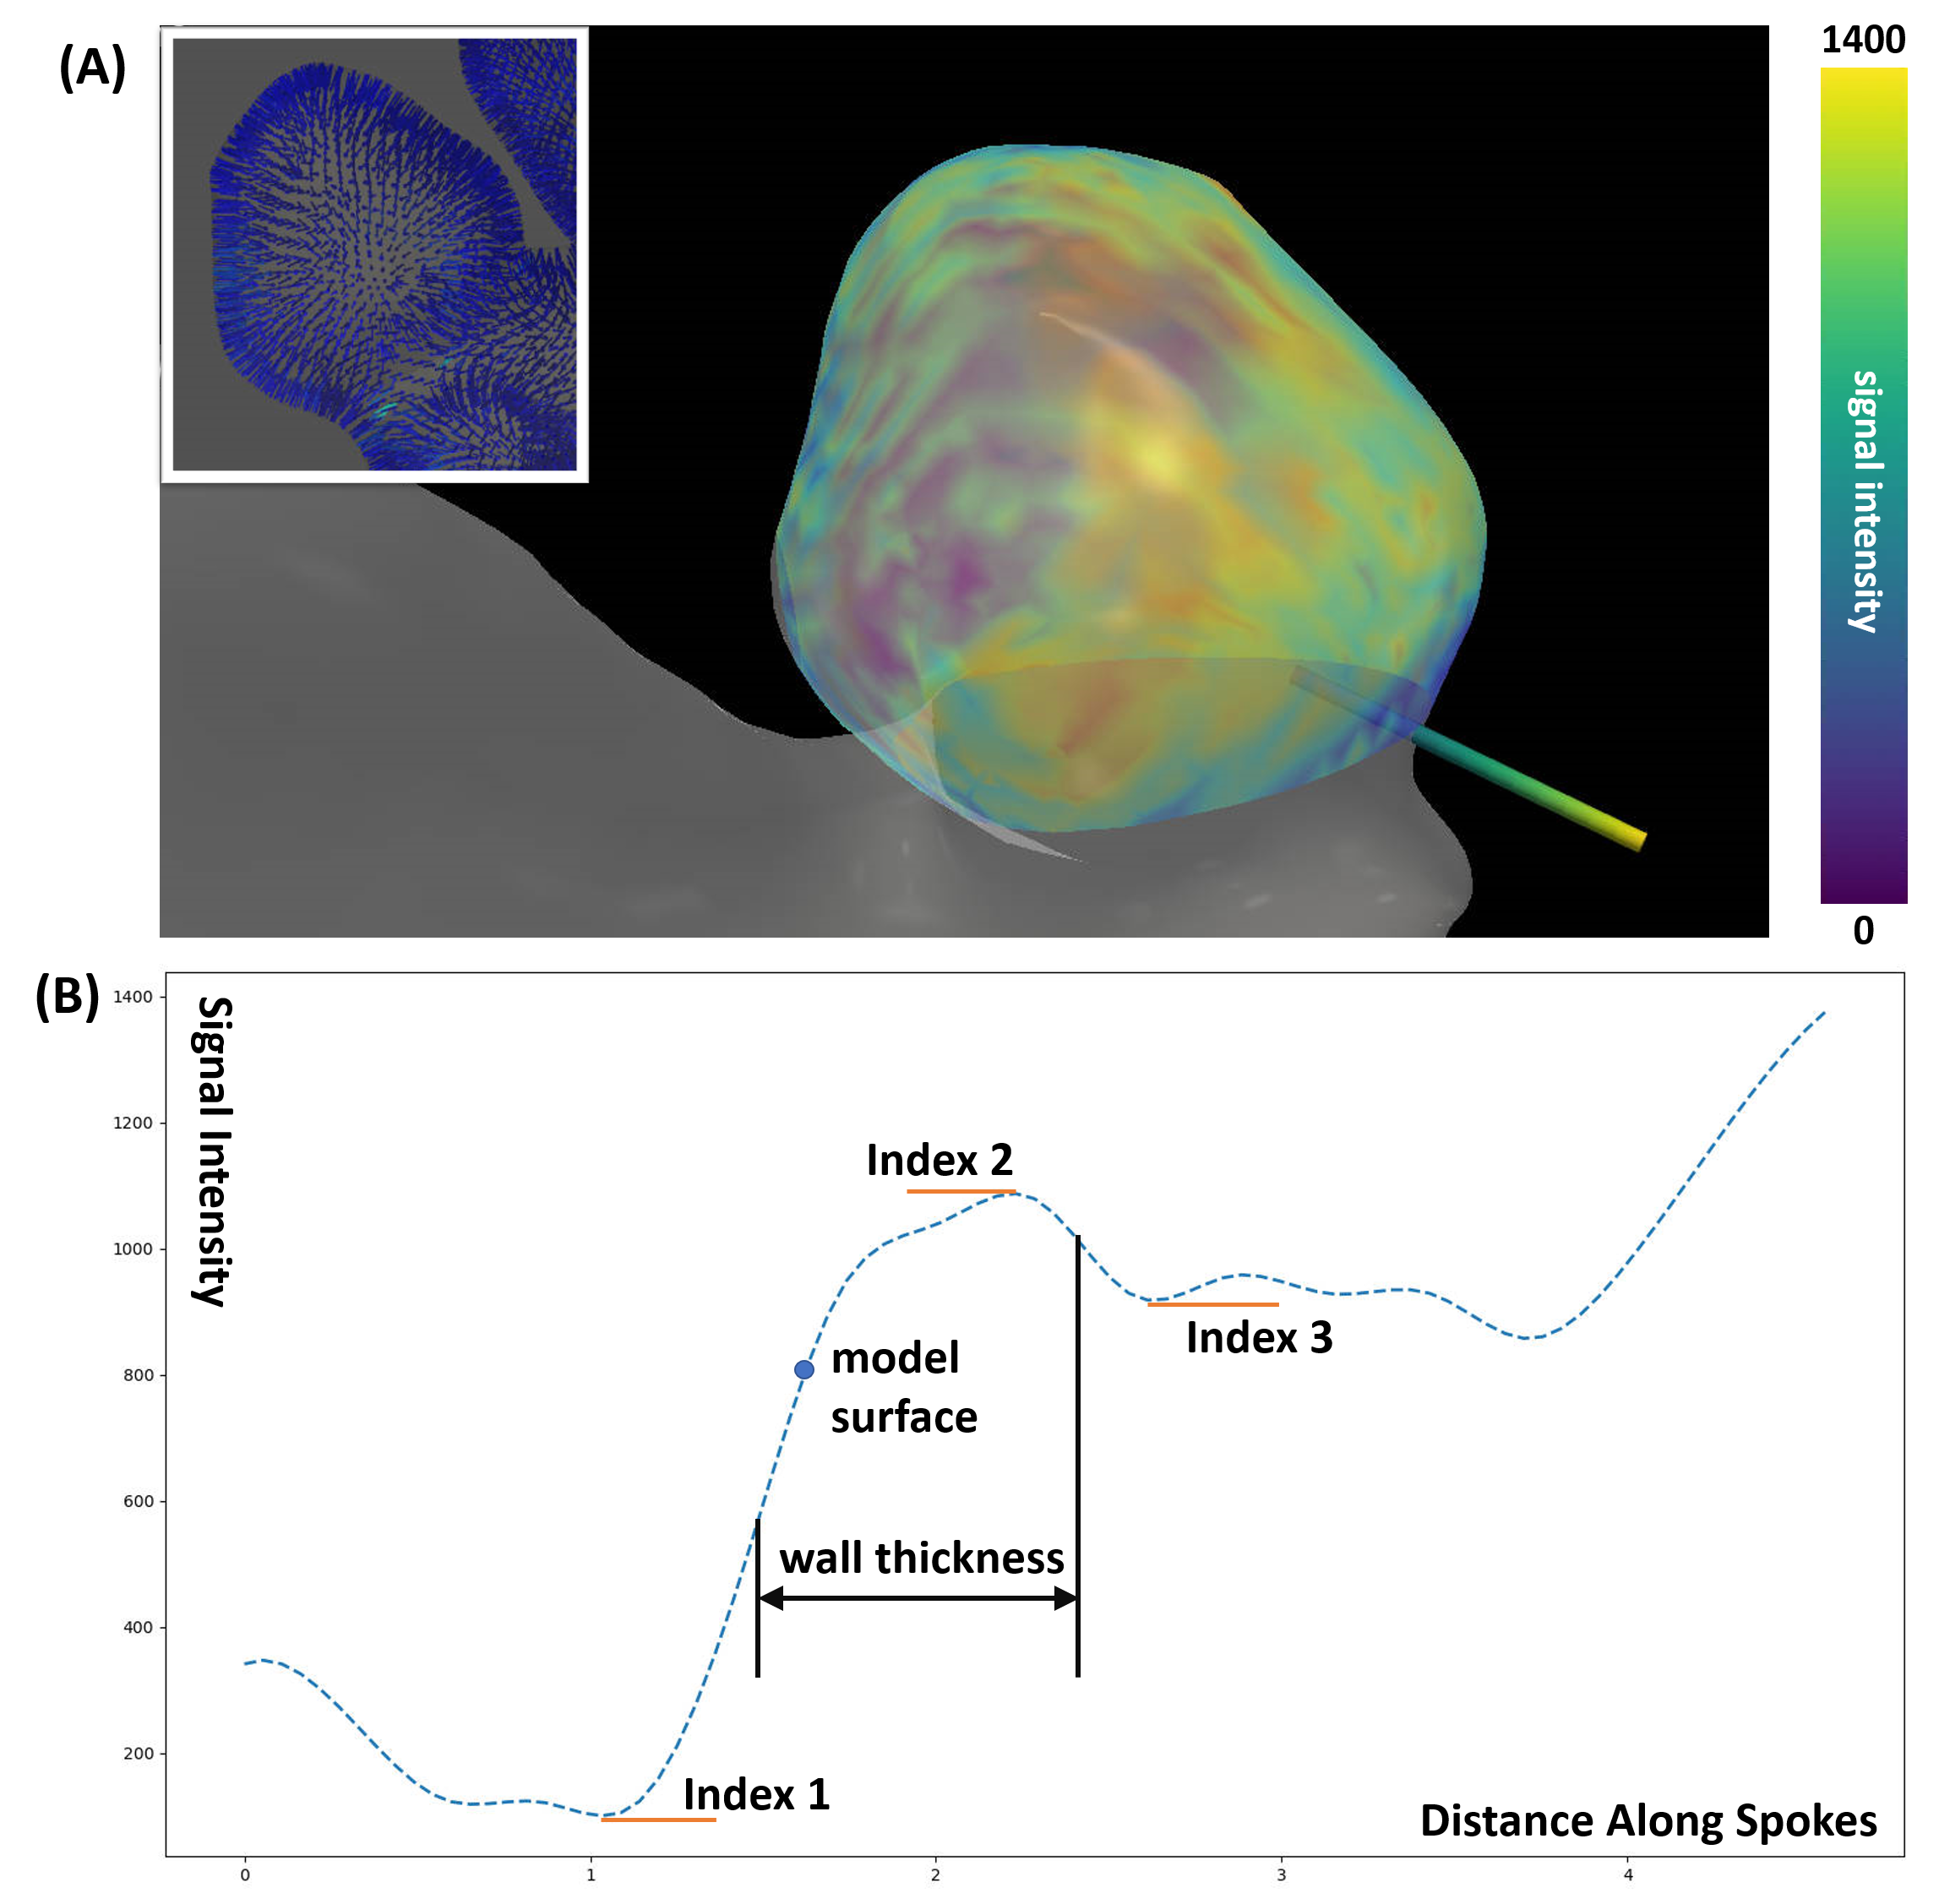
The workflow for 3D AWE assessment is shown in Fig.1. T1 and CE-T1 are registered to TOF images to obtain the corresponding signal intensity distribution. After choosing ROI, 3D model of aneurysm was generated by threshold segmentation of TOF images. The original threshold is calculated by triangle method and can be manually adjusted. For each vertex in the aneurysm surface model, we create the spokes along normal direction and sample the T1 and CE-T1 signal. As shown in Fig.2(A), a spoke is projected from inner to the outer boundary of the aneurysm and colored with T1 signal intensity at the corresponding location. The calculation algorithm for aneurysm wall thickness based on T1 images is shown in Fig.2(B). For each signal intensity profile after linear interpolation, there exist three key indexes[8]. In general, the vertex on the aneurysm surface model are located between index1 and index2. After access the derivative of signal intensity profile, Index1 is defined as: from vertex to the inner, the closest point to the vertex cross zero. Index2: from vertex to the outer, the closest point to the vertex cross zero. Index3: from Index2 to the outer, the point cross zero. The distance between two half peaks points is defined as aneurysm wall of this spoke. Specific spoke has same Index2 and Index3 when the outer wall of the aneurysm could not be differentiated from the adjacent brain tissue. T1 AWE mapping is calculated by the average signal intensity of the aneurysm wall. CE-T1 AWE mapping is calculated within the same indexes. The final wall enhancement ratio is obtained by following formula:
$$AWE-ratio=\frac{Intensity_{T1}-Intensity_{CE-T1}}{Intensity_{T1}}$$
Statistical analysis
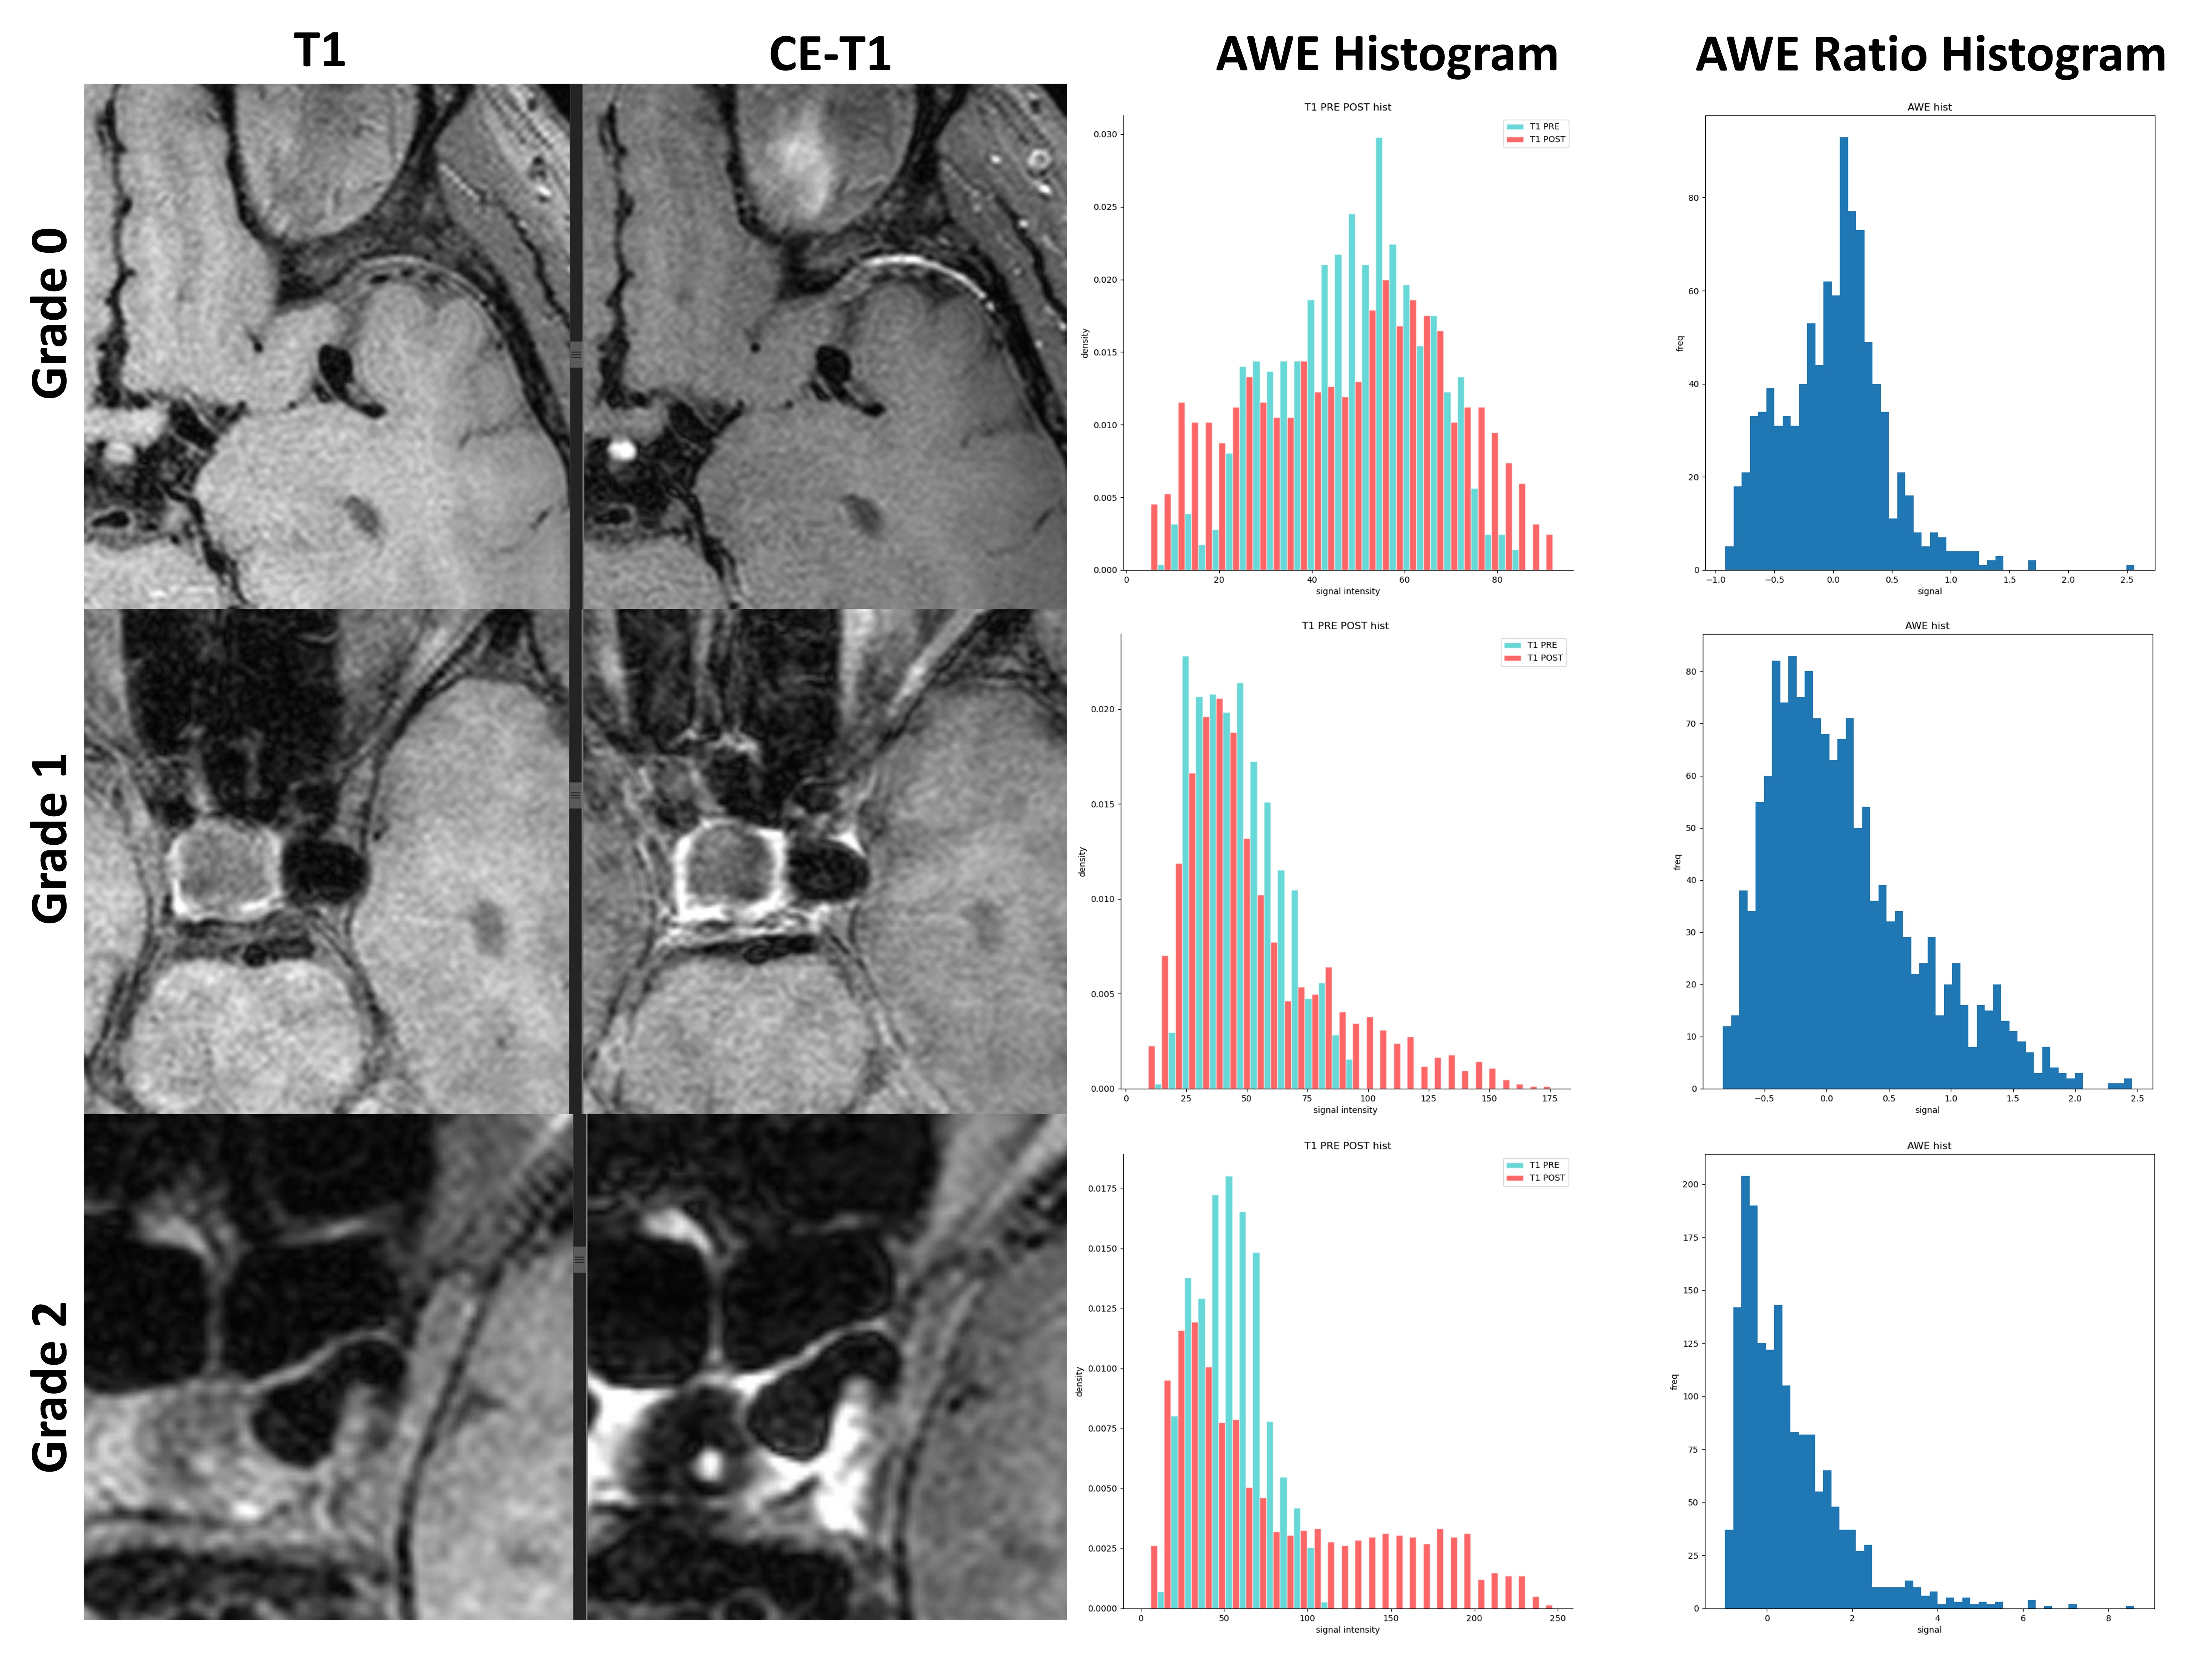
AWE was categorized into three grades as follow: grade 0 (no enhancement), grade 1 (enhancement less than that of the pituitary infundibulum and higher than normal vessel wall), and grade 2 (enhancement equal to or greater than that of the pituitary infundibulum)[9]. We calculated the value distribution of AWE ratio in the three groups. Skewness, kurtosis, average and variance are used to describe its characteristics.
RESULTS
12 patients harbored with 13 aneurysms were recruited in this study. Fig.3 shows the histograms of AWE and corresponding AWE ratio in three grades. The characteristics of histogram are different for aneurysms with different degree of enhancement. As the range and extent of enhancement increase, we can intuitively see a higher density of high signal regions on the AWE histograms of T1 and CE-T1. Table I calculated the statistic results of AWE ratio for each group. Grade 2 aneurysms have the highest average AWE ratio. The average skewness value increases with the increasing of enhancement degree.DISCUSSION and CONCLUSION
In this study, we investigated the 3D spatial distribution of AWE by combination of T1 and TOF images. The automatic method simplifies and accelerates the workflow of aneurysm wall identification and analysis. 3D-Heatmaps and histograms were generated to better visualize enhancement topography for different enhancement degrees. Different from previous studies that wall intensity is determined by the maximum value on the spoke, our algorithm automatically and accurately measured the wall signal through the key indexes on signal intensity profile. The future work included a larger group of aneurysm patients will be performed to validate the validity and reliability of this tool.Acknowledgements
No acknowledgement found.References
[1] Vlak MH, et al. Prevalence of unruptured intracranial aneurysms, with emphasis on sex, age, comorbidity, country, and time period: a systematic review and metaanalysis. Lancet Neurol. 2011.
[2] Nieuwkamp DJ, et al. Changes in case fatality of aneurysmal subarachnoid haemorrhage over time, according to age, sex, and region: a meta-analysis. Lancet Neurol. 2009.
[3] Turjman AS, et al. Role of fluid dynamics and inflammation in intracranial aneurysm formation. Circulation. 2014.
[4] Peng F, et al. Quantification of aneurysm wall enhancement in intracranial fusiform aneurysms and related predictors based on high-resolution magnetic resonance imaging: a validation study. Therapeutic Advances in Neurological Disorders. 2022.
[5] Khan MO, et al. Association between aneurysm hemodynamics and wall enhancement on 3D vessel wall MRI. Journal of Neurosurgery. 2021.
[6] Fu MZ, et al. Aneurysmal wall enhancement and hemodynamics: pixel-level correlation between spatial distribution. Quantitative Imaging in Medicine and Surgery. 2022.
[7] Raghuram A, et al. Semiautomated 3D mapping of aneurysmal wall enhancement with 7T-MRI. Scientific Reports. 2021.
[8] Feng JQ, et al. Comparison of 7 T and 3 T vessel wall MRI for the evaluation of intracranial aneurysm wall. European Radiology. 2022.
[9] Zhu CC, et al. Wall enhancement of intracranial unruptured aneurysm is associated with increased rupture risk and traditional risk factors.European Radiology. 2018.
Figures