3020
“Crafting” the olfactory atlas with brain regions and axonal bundles: application to COVID-19 subjects with anosmia1Department of Brain & Behavioral Sciences, University of Pavia, Pavia, Italy, 2Digital Neuroscience Centre, IRCCS Mondino Foundation, Pavia, Italy, 3NMR Research Unit, Queen Square MS Centre, Department of Neuroinflammation, UCL Queen Square Institute of Neurology, Faculty of Brain Sciences, University College London, London, United Kingdom, 4Radiomics Group, Vall d’Hebron Institute of Oncology, Vall d’Hebron Barcelona Hospital Campus, Barcelona, Spain, 5Department of Medical Physics and Biomedical Engineering, Centre for Medical Image Computing (CMIC), University College London, London, United Kingdom, 6E-Health Center, Universitat Oberta de Catalunya, Barcelona, Spain, 7Centre for Obesity Research, Department of Medicine, University College London, London, Italy, 8UCLH Biomedical Research Centre, National Institute of Health Research, London, United Kingdom
Synopsis
Keywords: Segmentation, COVID-19, olfactory atlas, tractography
Motivation: Several pathologies, including COVID-19, affect the sense of smell, causing anosmia.
Goal(s): The goal is to create an atlas that includes grey matter regions and white matter tracts involved in the olfactory circuit.
Approach: Grey matter regions involved in the olfactory circuit were selected and an atlas of tracts connecting pairs of regions was extracted using tractography. The atlas was used on subjects with anosmia caused by COVID-19 to investigate changes in grey matter density (voxel-based analysis) and quantitative microstructural maps (mean diffusivity and fractional anisotropy).
Results: Structural alterations were found in subjects with anosmia, mainly in the cerebellum.
Impact: The created olfactory circuit atlas, which includes grey matter regions and axonal bundles, can be crucial for studying pathologies involving alterations in the olfactory circuit. The atlas was useful to detect structural alterations in subjects with anosmia caused by COVID-19.
Introduction
The disruption of the olfactory circuit is a neurological complication of various pathologies, such as COVID-19. SARS-CoV-2 infection entails the loss (at various degrees) of the sense of smell, i.e. anosmia1. The olfactory circuit involves several brain regions2,3,4: olfactory information is projected from the Olfactory Bulb (OB) to the primary olfactory cortex, including the Anterior Olfactory Nucleus (AON), the Olfactory Tubercle (OT), the Piriform Cortex (PC), the Entorhinal Cortex (EC) and the Amygdala (Amy)5,6,7. From the primary olfactory cortex, the information projects to secondary olfactory regions, including the thalamus (Thal), the hippocampus (Hippo), the hypothalamus (Hythal), the insula (Ins) and the orbitofrontal cortex (OFC)8,9. In addition to these, other regions related to olfaction are the brainstem (BS) and the cerebellum (CRBL)10,11.In this work, a specific atlas of the olfactory circuit was created to facilitate the investigation of all areas involved in olfaction. The atlas consists of regions of interest (ROIs) and white matter tracts. Subsequently, the atlas was applied to subjects with anosmia caused by COVID-19.
Methods
Subjects: 17 healthy controls (HC, 8 females, 37.1±8.9 years), 14 COVID-no-anosmia (COVID, 11 females, 38.4±9.1 years), 10 COVID-recovered-young (COVIDY, 6 females, 27.7±1.9 years), 9 COVID-recovered (COVIDR, 8 females, 49.4±8.3 years) and 8 COVID-persistent (COVIDP, 7 females, 52.2±12.2 years).MRI acquisition: 3T Philips Ingenia CX scanner. 3D T1-weighted scan (TR/TE/TI=6.9/3.1/810ms, 1x1x1mm3, flip-angle=8°); diffusion-weighted imaging (DWI) protocol: spin-echo-EPI (TR/TE=6287/96ms; b=0/1000/2000/2800 s/mm2, volume numbers=3/20/20/36; 2x2x2 mm3).
Grey matter ROIs atlas creation: The OB was manually segmented by three experienced investigators, given that no atlas currently exists; the OB ROI was defined including voxels segmented by at least two investigators. Other regions of the olfactory circuit were extracted from existing atlases: AON, OT and PC from the primary_olfactory_cortex_parcellation6, EC and Ins from Juelich atlas, Amy and Thal from FIRST12, Hythal from hypothalamus_seg13, OFC from Brodmann atlas, and the BS from Harvard-Oxford Subcortical atlas. Cerebellum ROIs involved in the olfactory circuit were selected from the SUIT altas14,15: Crus I, Crus II, Lobule VI, Lobule VIII and dentate nucleus (DN)10. All regions were resampled into the same standard MNI-152 space. All regions were divided into left (L) and right (R), resulting in 35 ROIs.
Tract atlas creation: High-resolution whole-brain tractography of 10 Human Connectome Project16 subjects was computed17; tracts connecting pairs of ROIs of the olfactory atlas were extracted. To create the tract atlas, only the tracts existing for all subjects were considered, with anatomically-invalid combinations between ROIs eliminated: R-brain to R-cerebellum, L-brain to L-cerebellum, R-cerebellum to L-cerebellum. Each tract was registered to the MNI-152 space and the average tract of the 10 subjects was calculated. To create an atlas of tracts, each voxel had to be associated with only one tract: therefore, if a voxel belonged to multiple tracts, the tract with the highest number of streamlines was chosen.
COVID-19 application
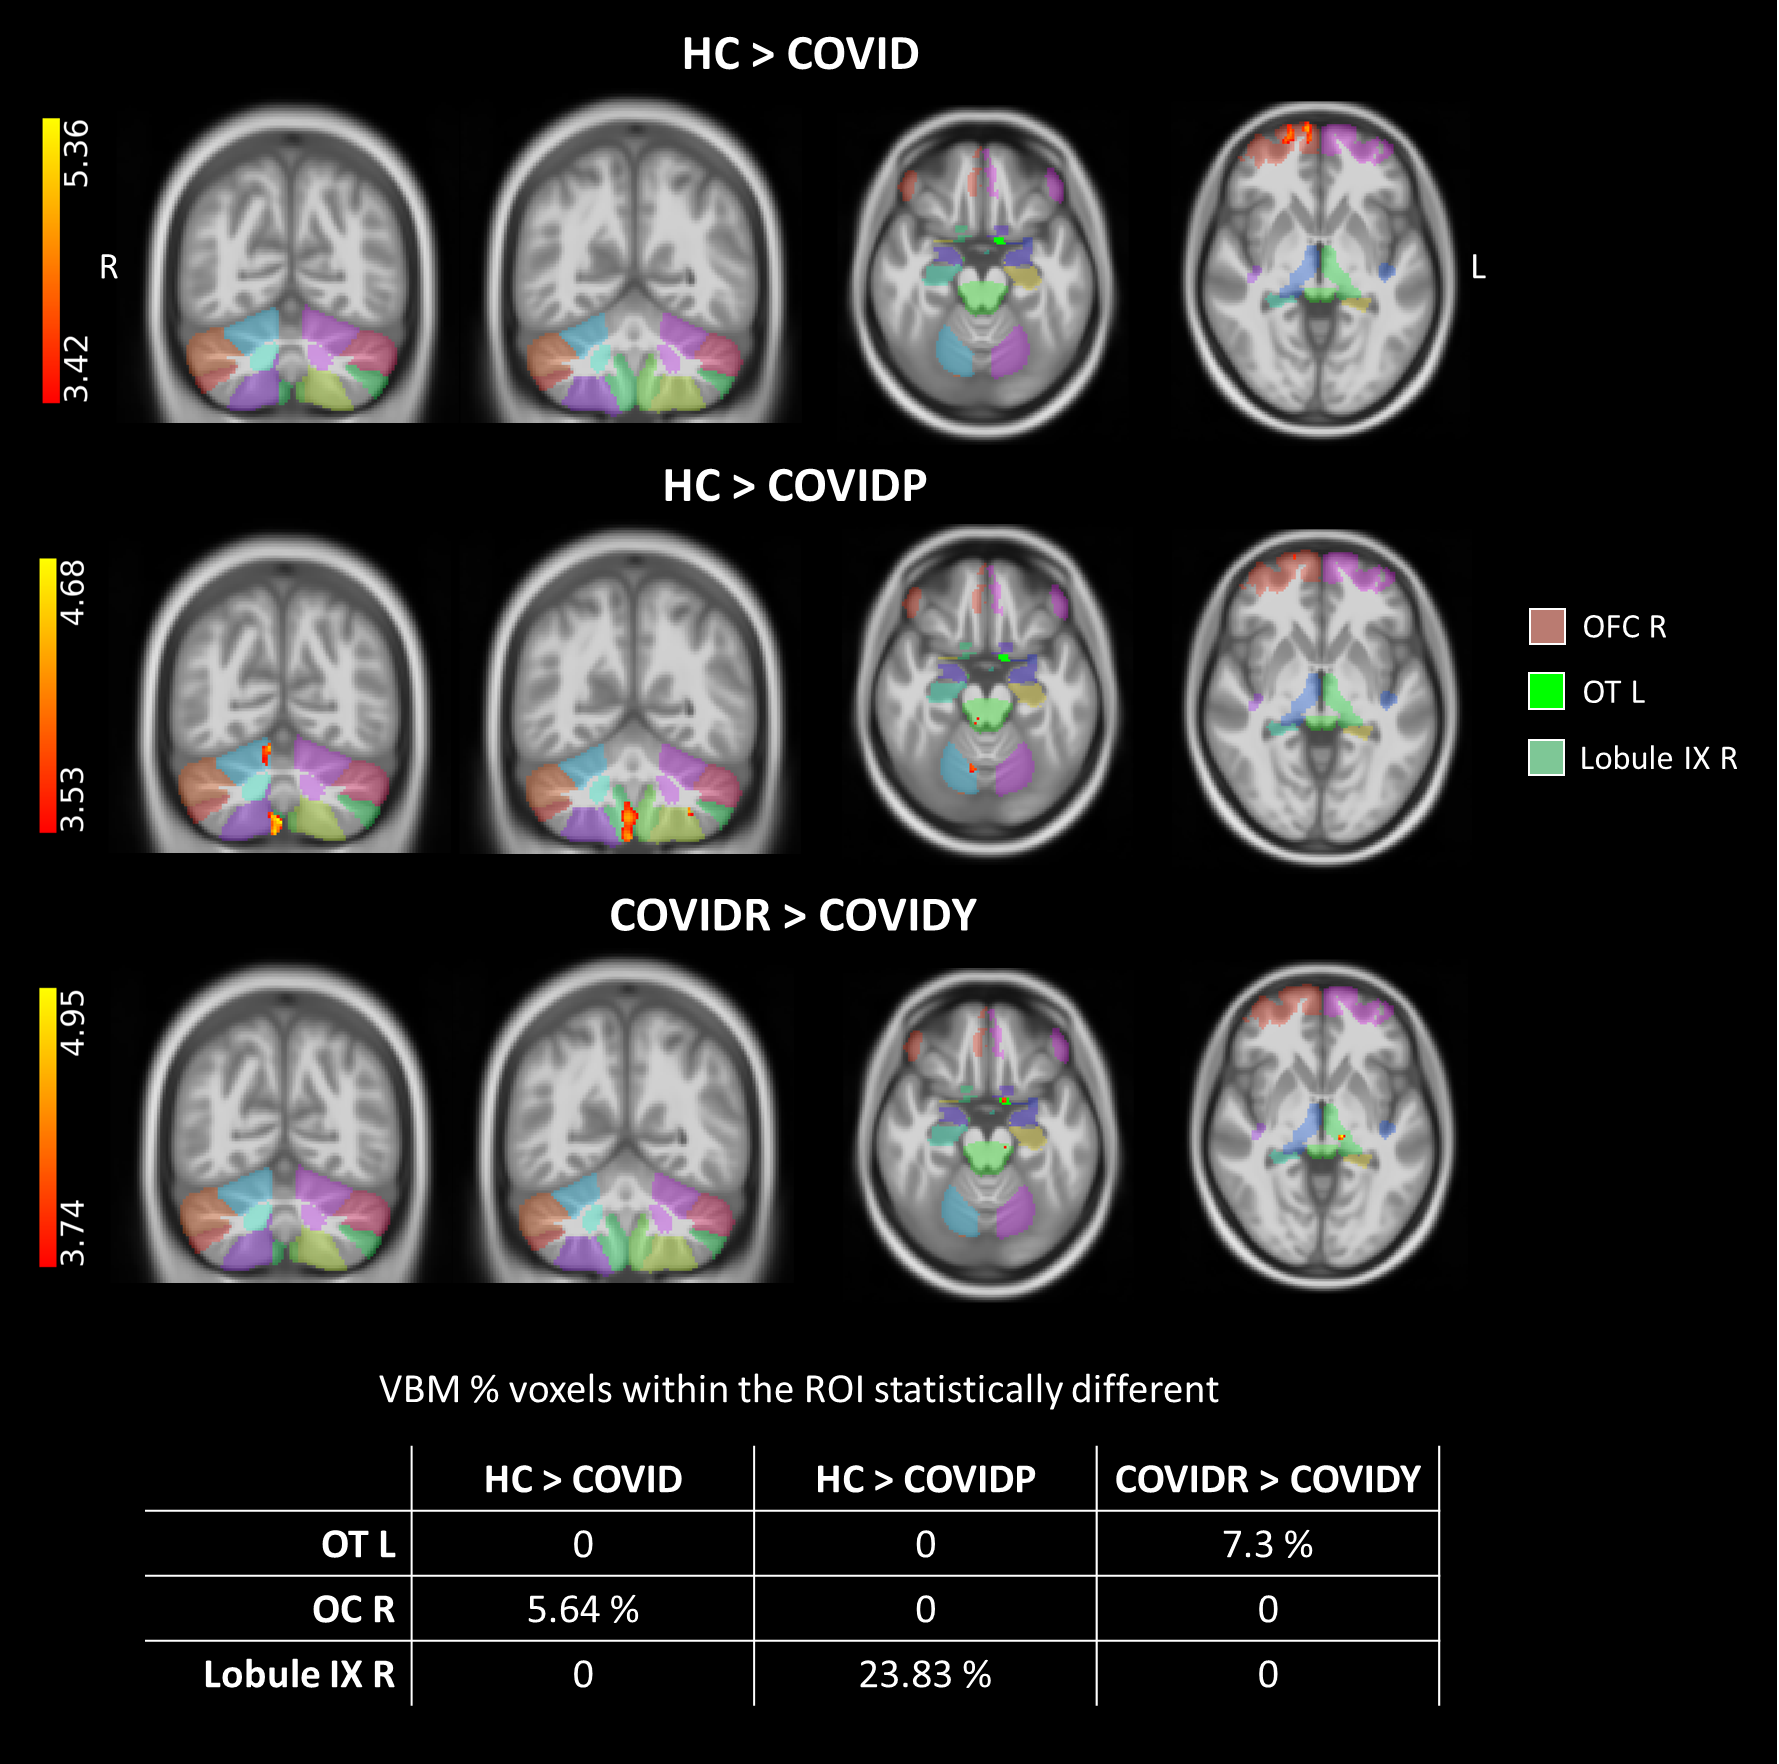
Voxel Based Morphometry (VBM): To investigate structural changes in the grey matter of the atlas, between groups VBM analysis was performed using SPM following these steps: grey and white matter segmentation in native space, DARTEL normalization, modulation, smoothing18,19,20,21. General linear models (GLM) were performed to investigate differences between pairs of groups (p<0.001 uncorrected), using intracranial volume and age as covariates.
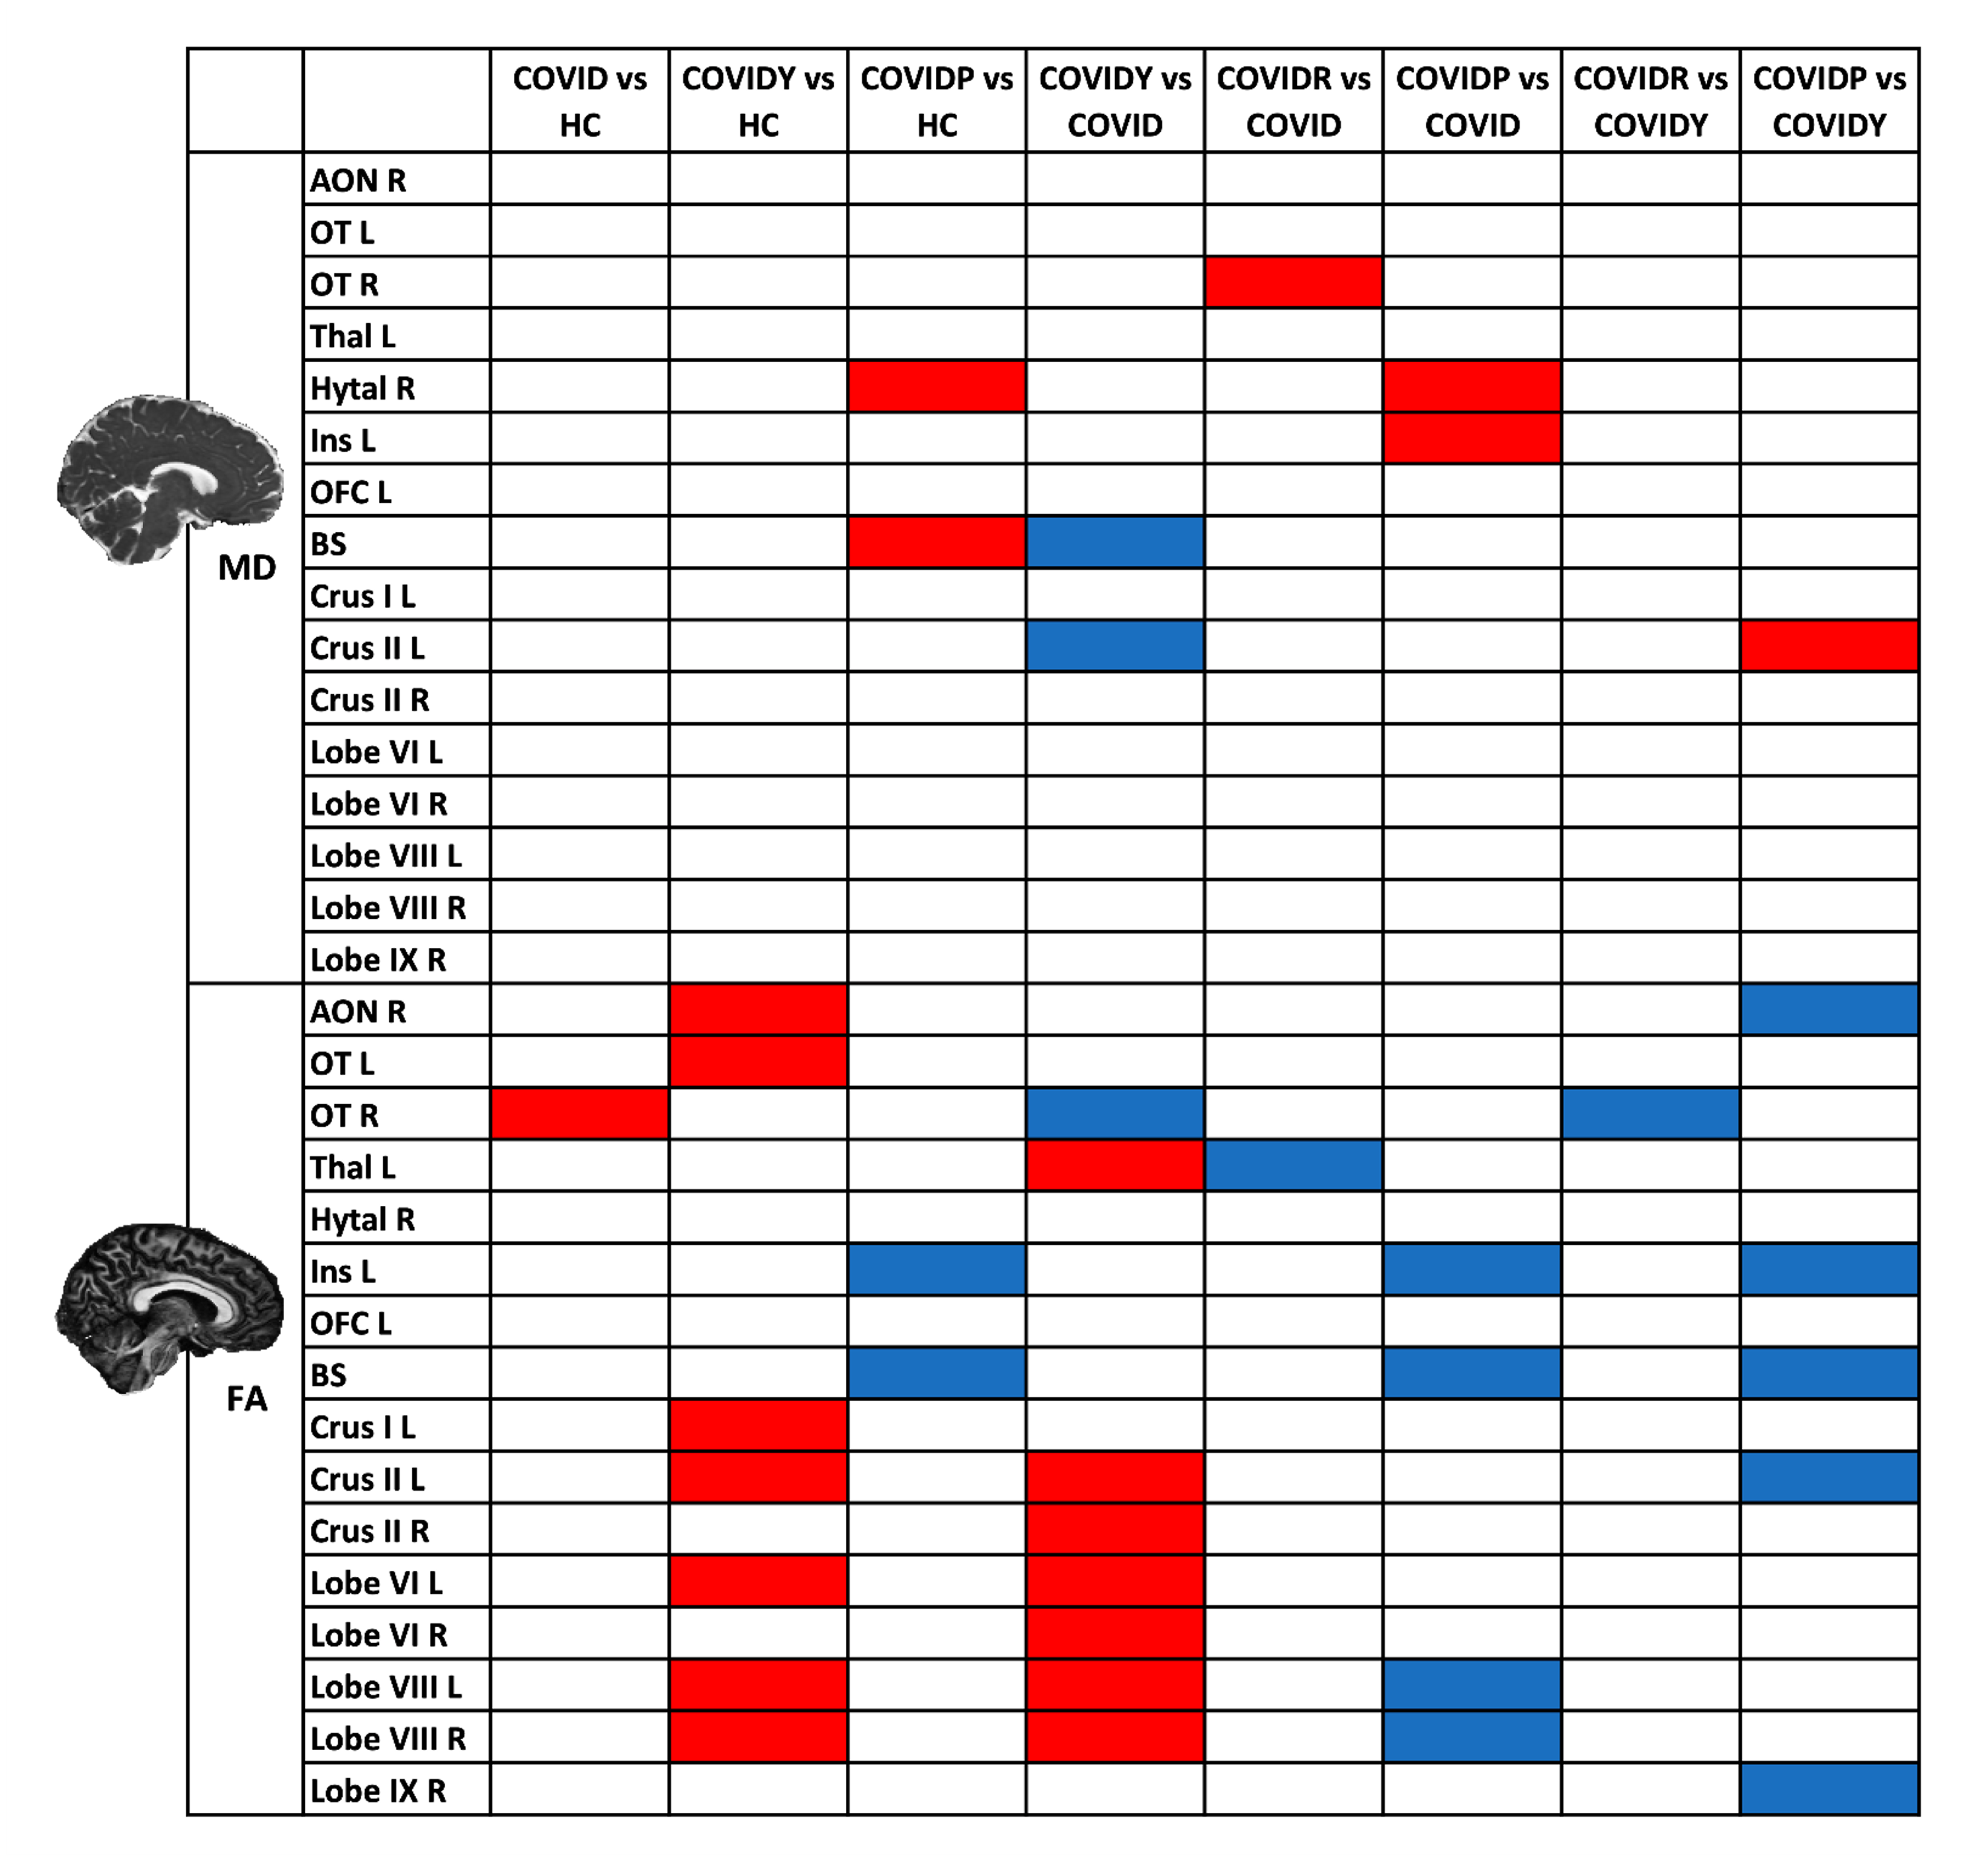
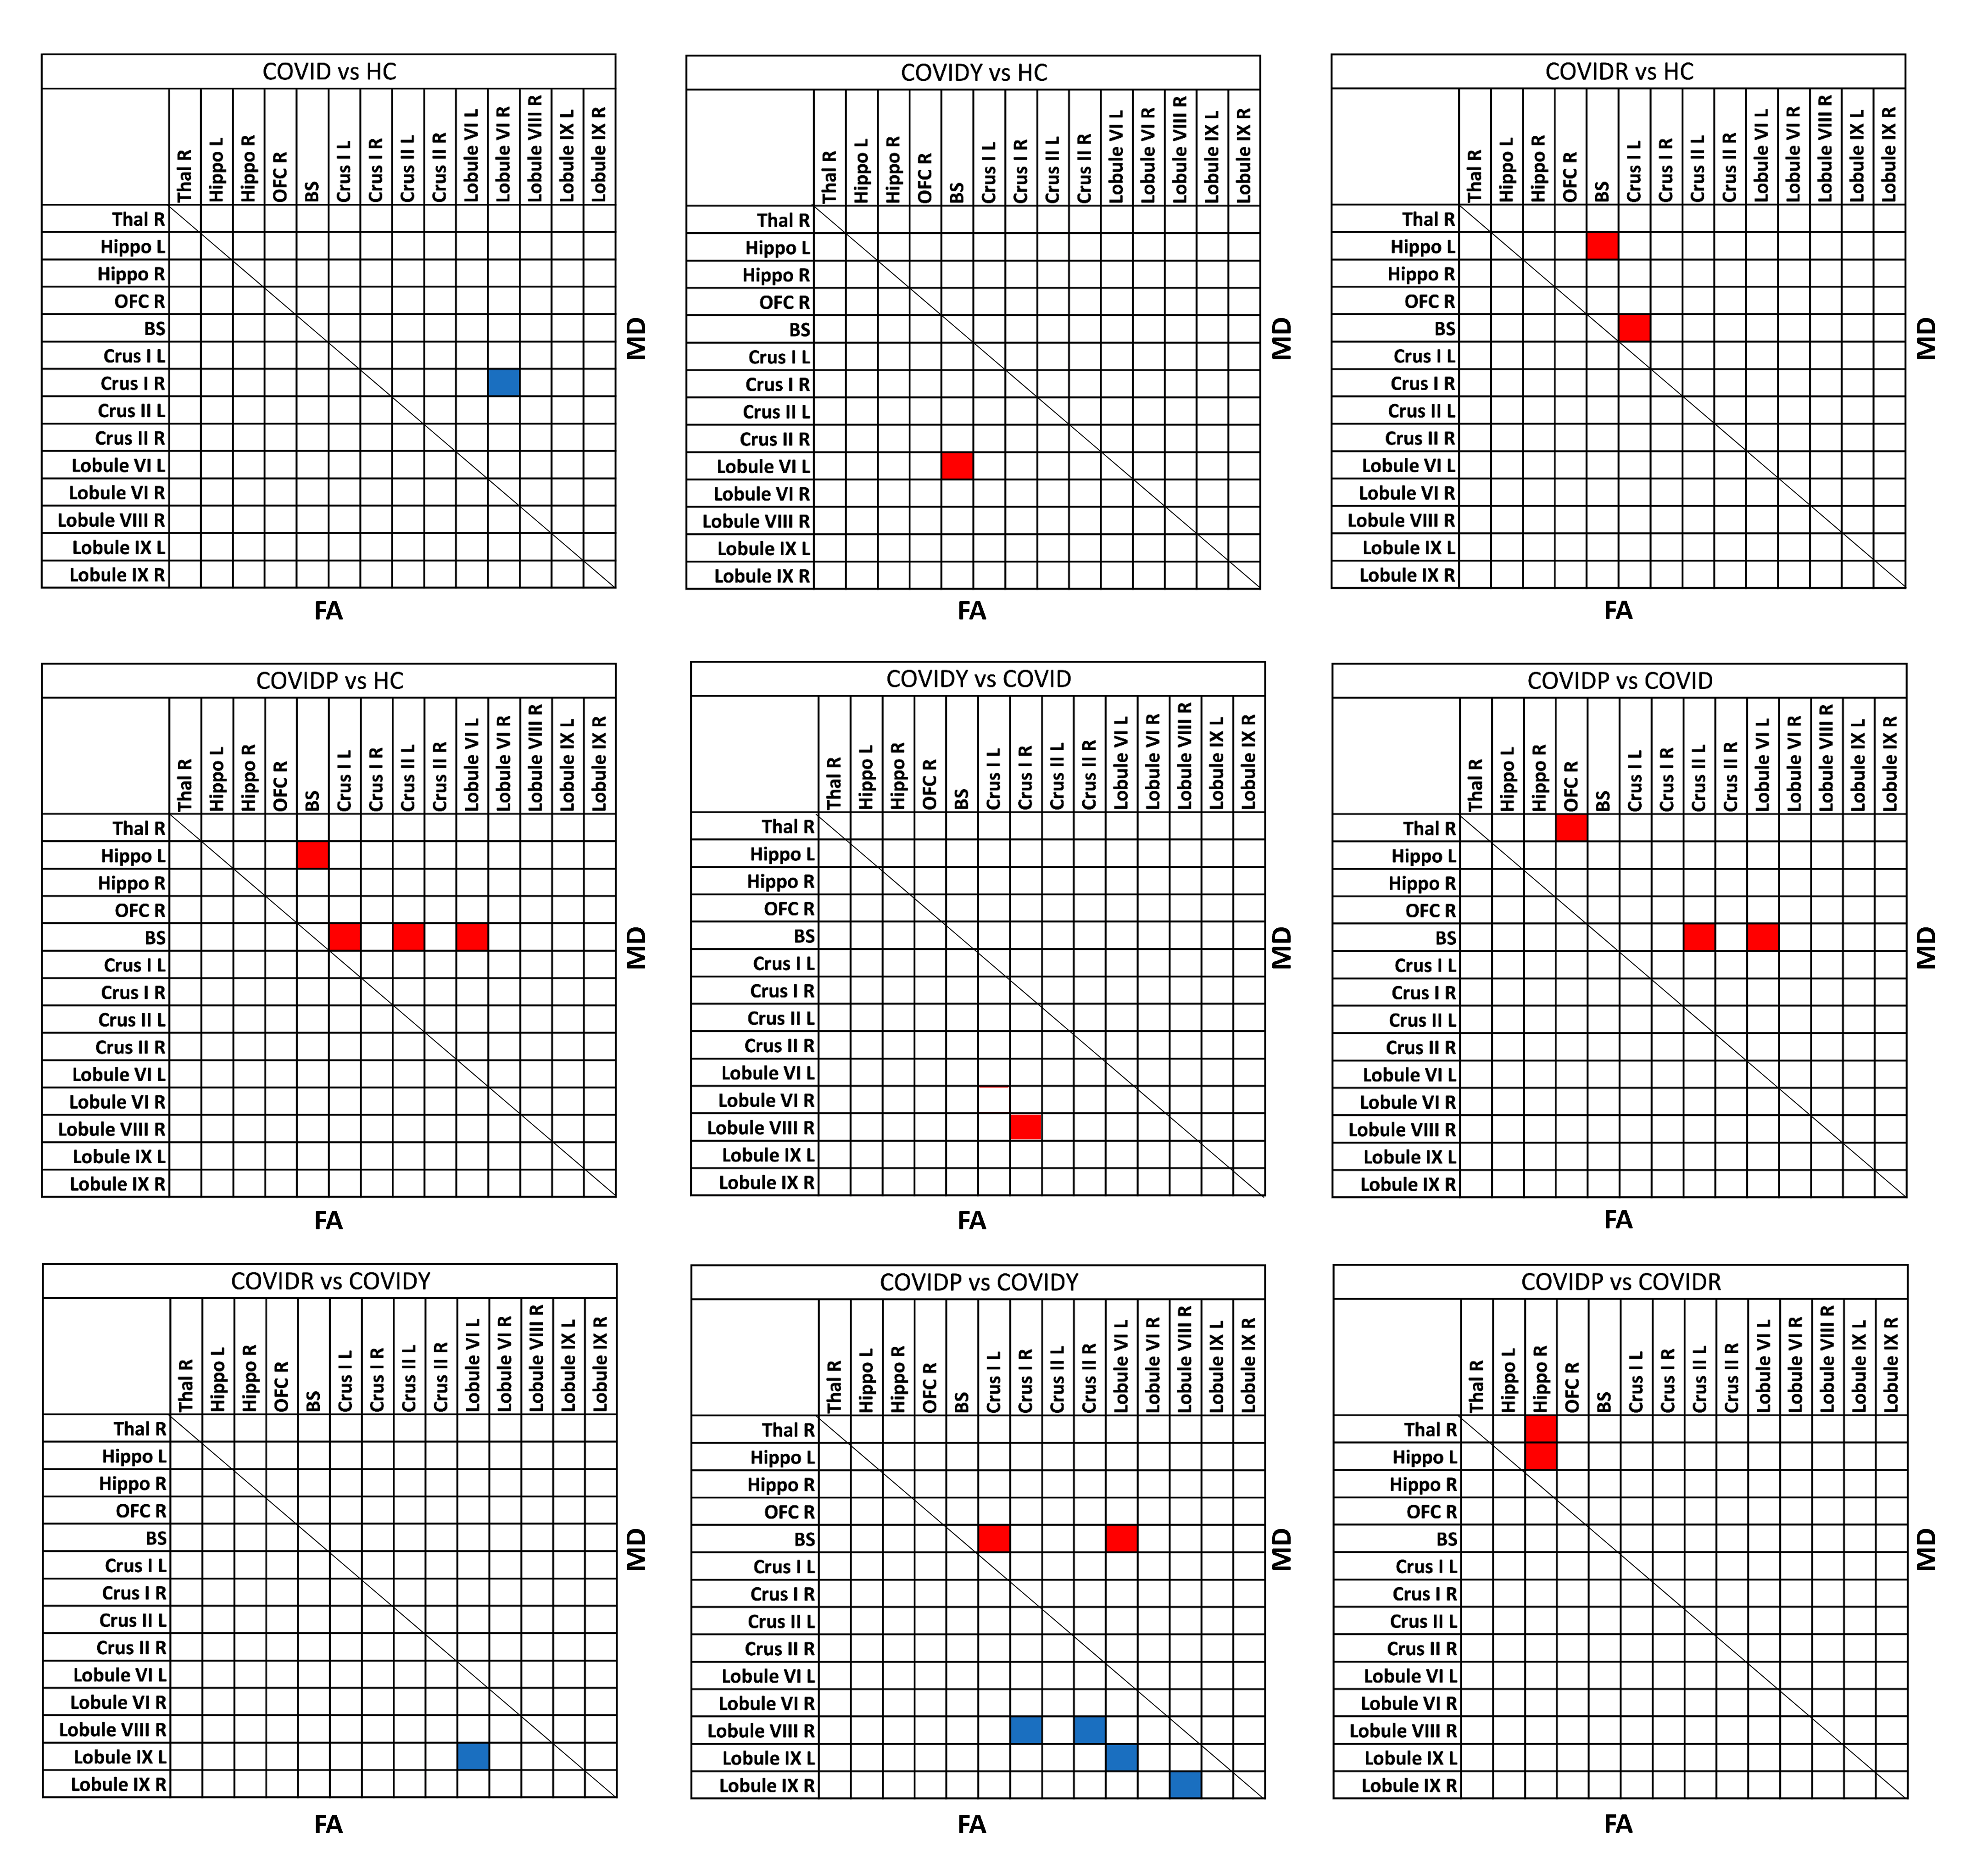
Microstructural characterization: DW images were pre-processed and the diffusion tensor was fitted to calculate Mean Diffusivity (MD) and Fractional Anisotropy (FA)22. Mean MD and FA values of all regions and tracts were compared between pairs of groups using GLMs with age as covariate (p<0.05, Bonferroni corrected).
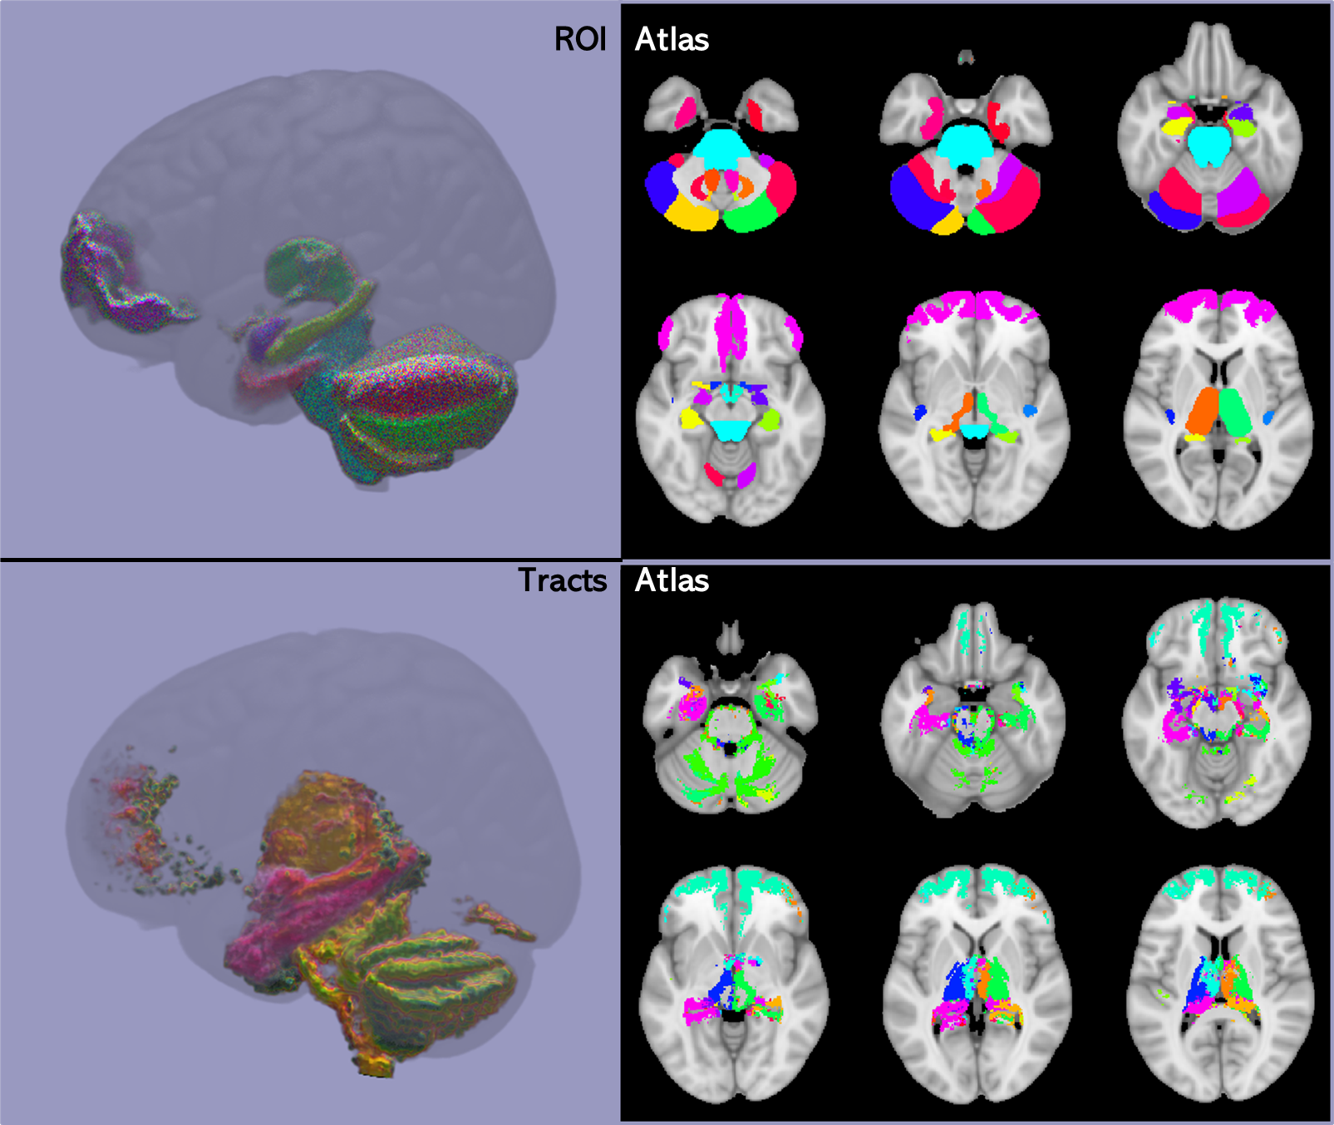
Figure1 shows the workflow from the creation of the atlas to its application.
Results
Figure2 shows grey matter ROIs and 90 white matter tracts of the newly-created olfactory atlas. Figure3 shows VBM results. Microstructural differences are shown in Figure4 for the atlas ROIs and in Figure5 for the tracts.Discussion
An atlas of the olfactory network was created, including 35 grey matter ROIs and 90 white matter tracts connecting the ROIs. This atlas can be used to characterise specific pathological changes that involve the olfactory circuit23,24,25. Our results show that in COVID-19 subjects the cerebellum is the most involved structure. Indeed, subjects affected by persistent COVID-19 are characterized by grey matter density reduction of the right Lobule IX and by microstructural alterations of cerebellar ROIs and tracts. Microstructural differences, i.e., decreased FA and increased MD (Figures4-5), could be explained by inflammatory mechanisms caused by COVID-19. Interestingly, COVIDY subjects showed an opposite pattern of microstructural alterations, possibly due to a compensatory response to inflammatory mechanisms. Future work will aim to improve the tracts of the atlas refining the selection of plausible tracts.Acknowledgements
CGWK receives funding from Horizon2020 (Research and Innovation Action Grants Human Brain Project 945539 (SGA3)), BRC (#BRC704/CAP/CGW), MRC (#MR/S026088/1), Ataxia UK. FP receives funding from H2020 Research and Innovation Action Grants Human Brain Project (#785907, 945539 SGA2, SGA3). RS receives funding from the BRC (BRC1130/HEI/RS/11041). FG receives the support of a fellowship from "la Caixa" Foundation (ID 100010434). The fellowship code is “LCF/BQ/PR22/11920010”. EG receives funding from TDC Technology Dedicated to Care. EL is a PhD student enrolled in the National PhD in Artificial Intelligence, XXXVIII cycle, course on Health and life sciences, organized by Università Campus Bio-Medico di Roma. FP received a Guarantors of Brain fellowship 2017–2020. FP is supported by the National Institute for Health Research (NIHR), the Biomedical Research Centre initiative at University. H2020 Research and Innovation Action Grants Human Brain Project 785907 and 945539 (SGA2 and SGA3) to ED'A. Moreover, the project was supported by the MNL Project “Local.References
1. Shamsundara, M. & Jayalakshmi, L. Anosmia—An Effect of COVID-19 Infection-Review. Indian J. Otolaryngol. Head Neck Surg. 75, 815–821 (2023).
2. Patestas, M. A. & Gartner, L. P. A Textbook of Neuroanatomy. (Wiley - Blackwell, 2016).
3. Champney, T. H. Essential Clinical Neuroanatomy (Essentials). (2015).
4. Wingrove, J. et al. Aberrant olfactory network functional connectivity in people with olfactory dysfunction following COVID-19 infection: an exploratory, observational study. eClinicalMedicine 58, 101883 (2023).
5. Insausti, R., Marcos, P., Arroyo-Jiménez, M. M., Blaizot, X. & Martínez-Marcos, A. Comparative aspects of the olfactory portion of the entorhinal cortex and its projection to the hippocampus in rodents, nonhuman primates, and the human brain. Brain Res. Bull. 57, 557–560 (2002).
6. Zhou, G., Lane, G., Cooper, S. L., Kahnt, T. & Zelano, C. Characterizing functional pathways of the human olfactory system. Elife 8, 1–27 (2019).
7. De Luca, P. et al. Entorhinal Cortex and Persistent Olfactory Loss in COVID-19 Patients: A Neuroanatomical Hypothesis. Comment on Fiorentino et al. Correlations between Persistent Olfactory and Semantic Memory Disorders after SARS-CoV-2 Infection. Brain Sci. 2022, 12, 714. Brain Sci. 12, 13–16 (2022).
8. Lie, G., Wilson, A., Campion, T. & Adams, A. What’s that smell? A pictorial review of the olfactory pathways and imaging assessment of the myriad pathologies that can affect them. Insights Imaging 12, (2021).
9. García-Cabezas, M. Á. & Barbas, H. A direct anterior cingulate pathway to the primate primary olfactory cortex may control attention to olfaction. Brain Struct Funct. (2014). doi:10.1007/s00429-013-0598-3
10. Zhang, Z. hao et al. Cerebellar involvement in olfaction: An fMRI Study. J. Neuroimaging 31, 517–523 (2021).
11. Shipley, M. T. & Ennis, M. Functional organization of olfactory system. J. Neurobiol. 30, 123–176 (1996).
12. Patenaude, B., Smith, S. M., Kennedy, D. N. & Jenkinson, M. A Bayesian model of shape and appearance for subcortical brain segmentation. Neuroimage 56, 907–922 (2011).
13. Billot, B. et al. Automated segmentation of the hypothalamus and associated subunits in brain MRI. Neuroimage 223, 117287 (2020).
14. Diedrichsen, J. A spatially unbiased atlas template of the human cerebellum. Neuroimage 33, 127–138 (2006).
15. Diedrichsen, J. et al. Imaging the deep cerebellar nuclei: A probabilistic atlas and normalization procedure. Neuroimage 54, 1786–1794 (2011).
16. Essen, D. C. Van, Ugurbil, K., Auerbach, E. & Barch, D. The Human Connectome Project: A data acquisition perspective. Neuroimage 62, 2222–2231 (2012).
17. Smith, R. E., Tournier, J. D., Calamante, F. & Connelly, A. Anatomically-constrained tractography: Improved diffusion MRI streamlines tractography through effective use of anatomical information. Neuroimage 62, 1924–1938 (2012).
18. Ashburner, J. & Friston, K. J. Voxel-based morphometry - The methods. Neuroimage 11, 805–821 (2000).
19. Ashburner, J. & Friston, K. J. Why Voxel-based morphometry should be used. Neuroimage 14, 1238–1243 (2001).
20. Ashburner, J. A fast diffeomorphic image registration algorithm. Neuroimage 38, 95–113 (2007).
21. Good, C. D. et al. A voxel-based morphometric study of ageing in 465 normal adult human brains. Neuroimage 14, 21–36 (2001).
22. Alexander, A. L., Lee, J. E., Lazar, M. & Field, A. S. Diffusion Tensor Imaging of the Brain. Neurotherapeutics 4, 316–329 (2007).
23. Atalar, A. Ç. et al. Olfactory dysfunction in multiple sclerosis. Mult. Scler. Relat. Disord. 21, 92–96 (2018).
24. Tian, Q., Bilgel, M., Moghekar, A. R., Ferrucci, L. & Resnick, S. M. Olfaction, Cognitive Impairment, and PET Biomarkers in Community-Dwelling Older Adults. J. Alzheimers. Dis. 86, 1275–1285 (2022).
25. Tarakad, A. & Jankovic, J. Anosmia and Ageusia in Parkinson’s Disease. Int. Rev. Neurobiol. 133, 541–556 (2017).
Figures
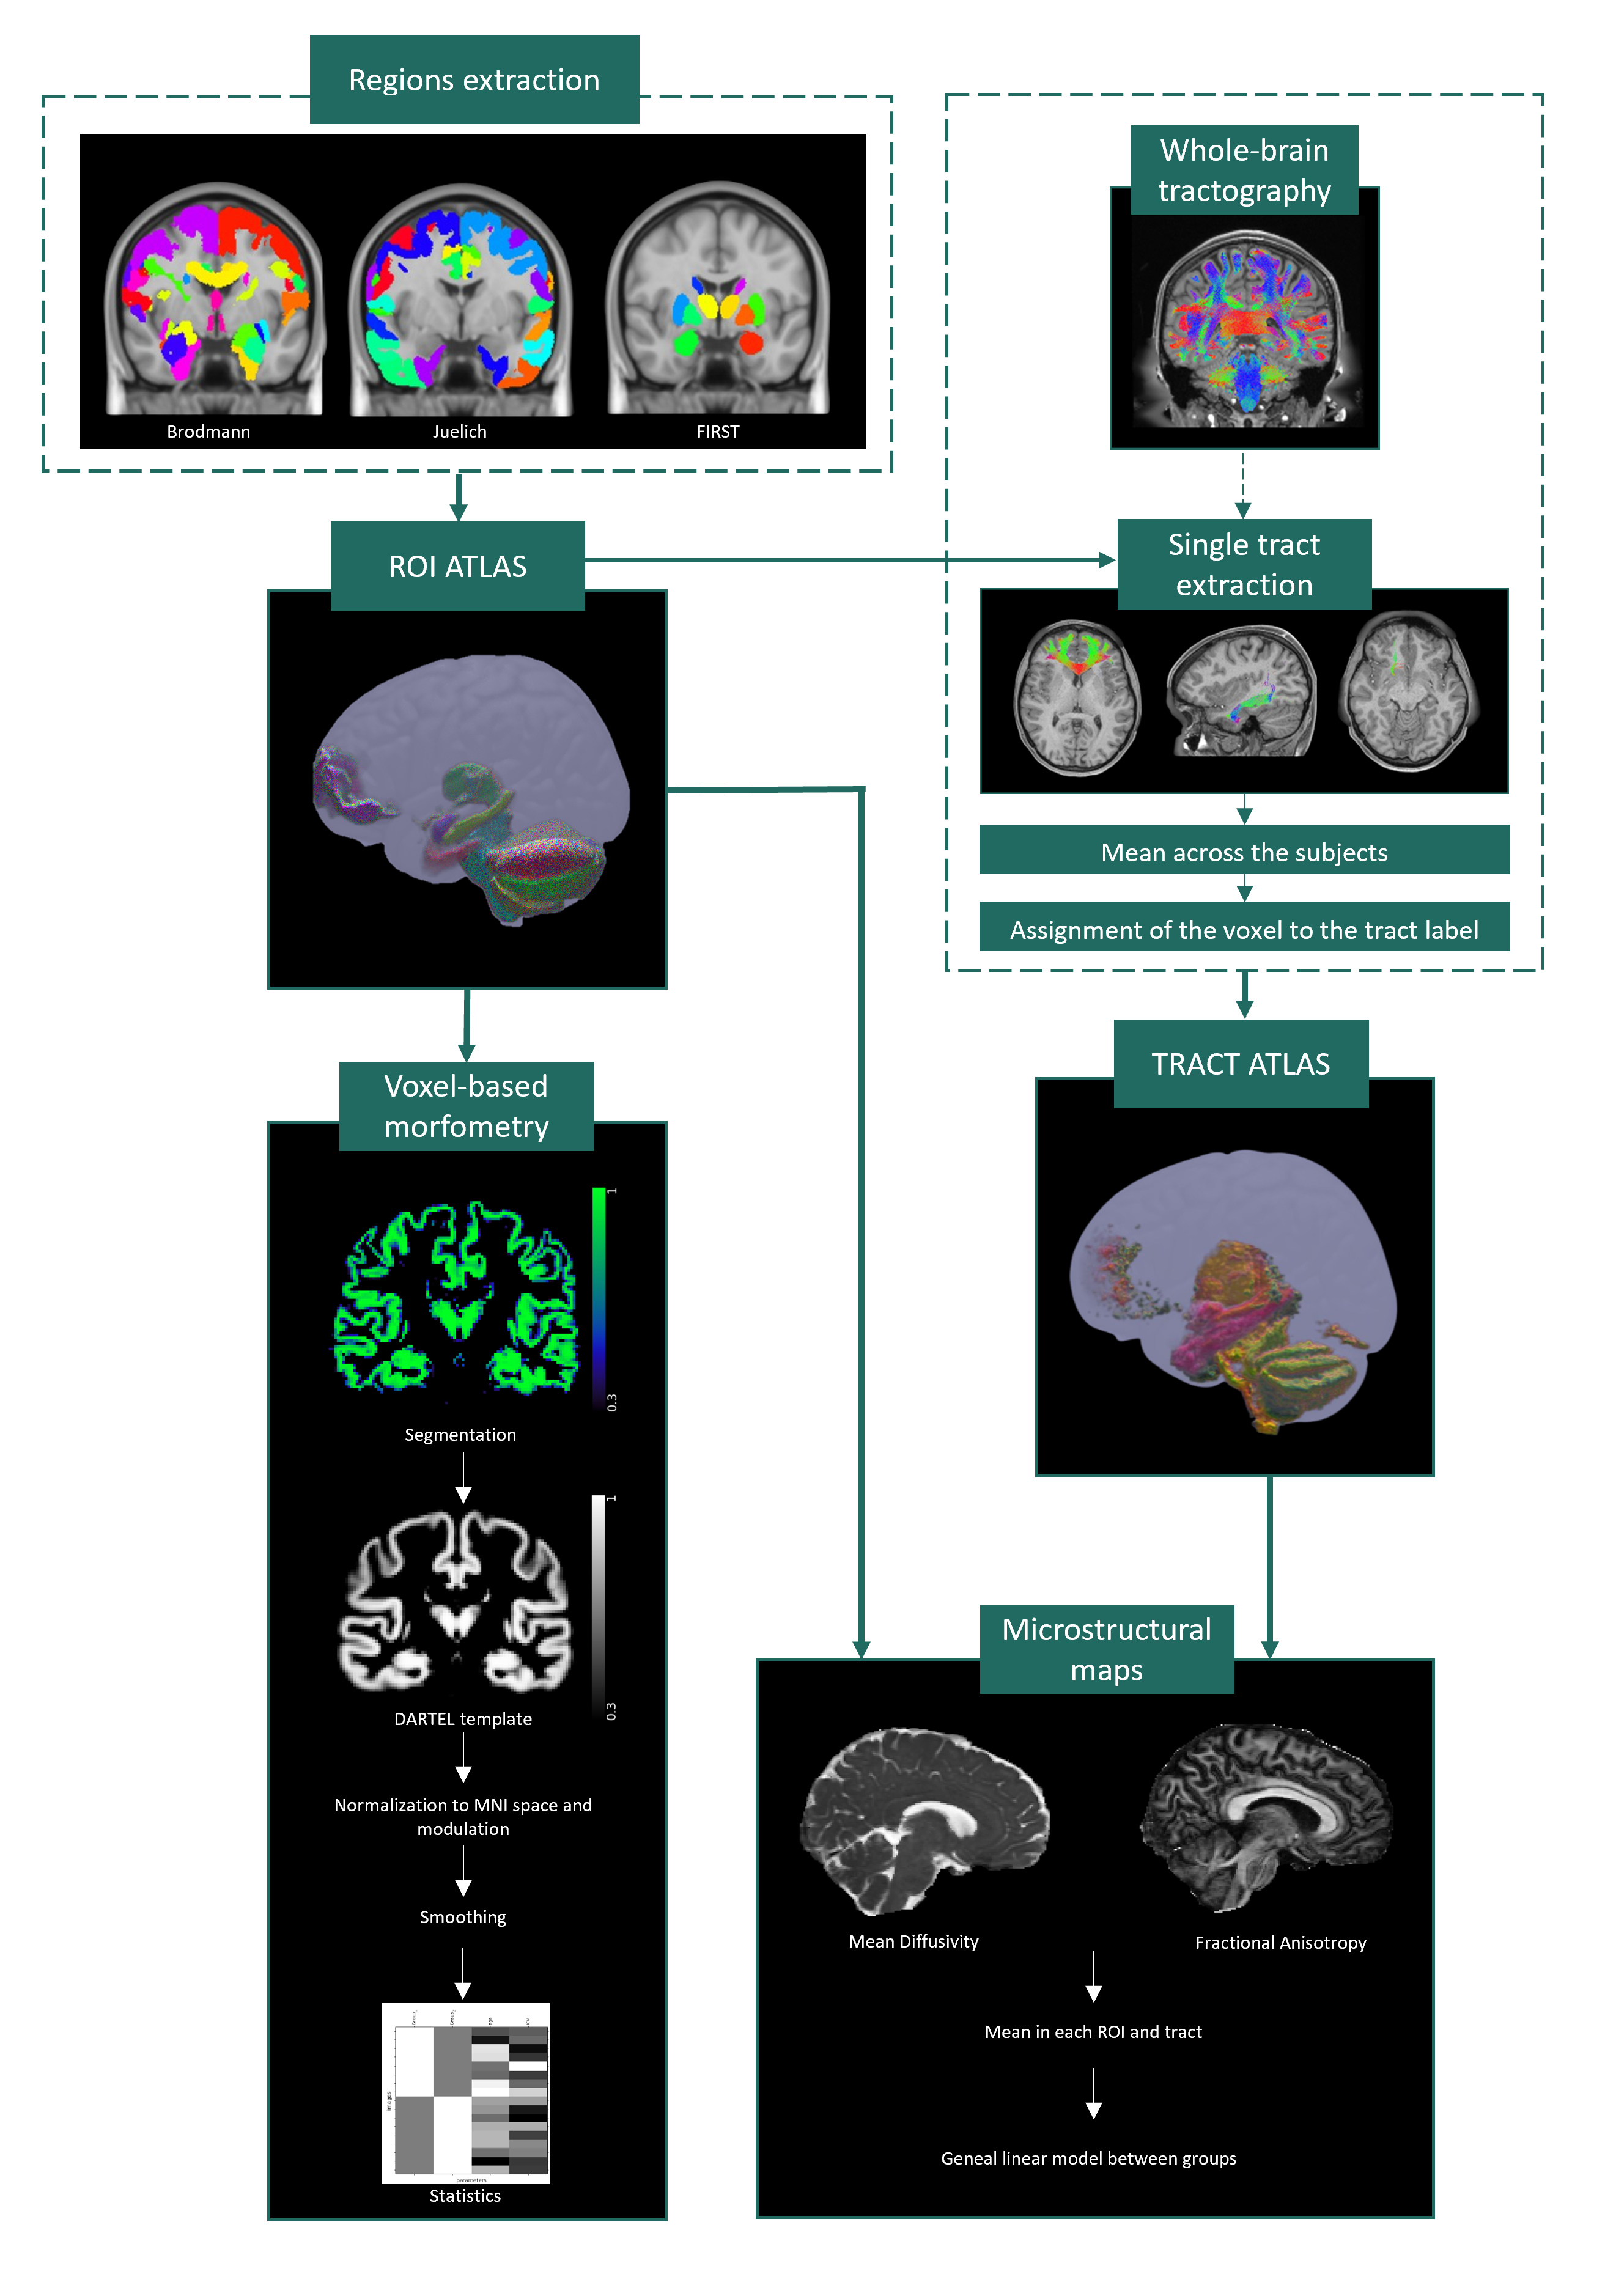
Figure1: Region of interest (ROI) atlas: obtained combining individual parcellations of grey matter regions. Tract atlas: to create the tracts atlas, 10 subjects of the Human Connectome Project were used. From whole-brain tractography, all tract combinations between pairs of regions were extracted. The average of 10 subjects was calculated for each tract. Each tract was associated with an atlas label. Voxel Based Morphometry analysis was performed on the ROI atlas. Microstructure maps of ROIs and tracts were used to investigate changes associated with anosmia.