3018
Classification of Quality Assessment of MR Spectroscopy Data: Comparing Quantitative and Qualitative Assessments1Center for Clinical Spectroscopy, Radiology Department, Brigham and Women's Hospital, Boston, MA, United States
Synopsis
Keywords: Data Processing, Data Analysis, Quality Analysis
Motivation: Qualitative assessment of magnetic resonance spectroscopy (MRS) data is the standard for data quality assessment (DQA), however it's inefficient with high interobservational variability.
Goal(s): The goal was to compare qualitative DQA with quantitative DQA (signal to noise ratio (SNR), linewidth (FWHM), and Cramer-Rao lower bounds (CRLB)), determining if quantitative measures alone are sufficient.
Approach: 7,155 spectra were classified on a 5-measure scale with ratings 1 (acceptable) to 5 (rejected).
Results: SNR was negatively correlated and FWHM and CRLB were positively correlated with qualitative DQA. Multiple cases showed spectra quantitatively acceptable but qualitatively rejected, demonstrating additional measures are needed for comprehensive DQA.
Impact: Providing quantitative analysis for qualitative MR spectroscopy ratings when comparing SNR, FWHM, and CRLB variables will direct the process of quality analysis to demonstrate that additional quantitative DQA measures are needed to provide comprehensive DQA.
Introduction:
While qualitative assessment of magnetic resonance spectroscopy (MRS) data is the gold standard for data quality assessment (DQA), it is time-consuming and can have high interobservational variability. Signal to noise ratio (SNR), linewidth (full width half maximum, FWHM), and Cramer-Rao lower bounds (CRLB) of metabolites have been used as quantitative metrics for MRS DQA where recent consensus has been reached on cutoff values for each measure. The goal of this study was to compare these quantitative measures with qualitative DQAs to determine if they are sufficient for accurate classification of data, as specific criteria for quality evaluation have not been established.Methods
A total of 7,168 spectra were obtained from 112 healthy young adult subjects using short-echo chemical shift imaging (CSI) at 3 Tesla at a single site. CSI was acquired using semi-LASER (TR/TE=1700/40ms, 16x16 matrix, 10x10x15 mm3 voxel resolution) in the axial plane above the corpus callosum (Figure 1). Each subject had 64 datapoints that were processed using LCmodel with a custom basis set. 13 spectra were not processable and were excluded. SNR, FWHM, and CRLB for glutamate (Glu), myoinositol (Ins), and glutamine (Gln) were extracted from the LCModel output for each spectrum. The LCmodel PDF was then reviewed by spectroscopsists and assigned a rating of 1-5. A rating of 1 described spectra where all metabolites (NAA, creatine (Cr), choline (Cho), myoinositol, glutamate/glutamine (Glx) were of excellent quality to be included in statistical analysis. A rating of 2 described spectra where the majority of the metabolites were well fit but were noisy. A rating of 3 described spectra where the singlets (NAA, Cr, Cho) were of good quality but multiplets of Glx and Ins were not acceptable. A rating of 4 described those spectra where multiplets are not acceptable and spectra were noisy. 5 were spectra to be fully rejected from analysis. After the spectra were classified, a linear correlation was calculated between the rating and the quantitative DQA measures and means and categorical results were calculated and displayed as box and whisker plots.Results
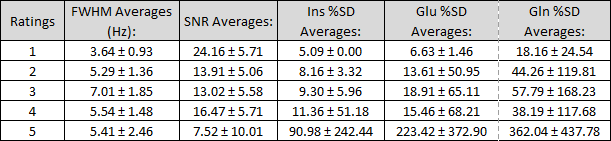
The majority of the data were of excellent quality with 6,263 spectra with a rating of 1 and only 86 spectra that were fully rejected (Figure 2). As expected, SNR was highest in the spectra with a rating of 1 and decreased as the rating increased (Figure 3A) with a correlation of r=0.50. FHWM exhibited the opposite trend with the lowest linewidths in spectra with a rating of 1 and increasing with ratings (Figure 3B) and a correlation of 0.46. Likewise metabolite CRLBs showed the same trend as would be expected (Figure 4) with a correlation of 0.21, 0.29, 0.34 for Ins, Glu, and Gln, respectively. To further explore the results, the data was analyzed using consensus criteria for each of the DQA measures (Table 2). For SNR, the percentage of spectra per rating were tabulated with an SNR <10 per Maudsley et al1. For FWHM a linewidth < 10 Hz (0.073 ppm) per Juchem et al2 were used. For metabolites, a threshold of 50% per Oz et al3 were used for Ins and Glu. Gln CRLB were anticipated to be high and therefore not tabulated.Due to the low concentration of Gln, we did not anticipate a strong correlation however it was surprising that the other DQA measures were relatively weak. The box and whisker plots show that there is significant overlap between the different ratings. Regarding SNR, while the large majority of high-quality spectra had low SNR, there were still some that were considered acceptable by qualitative DQA but would have been rejected. Likewise, there were also several rejected spectra that would have survived the SNR threshold demonstrating that SNR alone is not sufficient for QA screening. For FHWM and CLRB, the findings are also similar in that while the majority of spectra passed criteria, there were many that would have been screened out. Individual analysis of these spectra show that additional factors such as spectra artifacts, poor water suppression and poor phasing would also result in spectral rejections that otherwise would have passed quantitative DQA.Conclusions
Our results show that while SNR, FWHM, and CRLB in general provide good QA measures, additional quantitative measures are necessary in order to match the gold standard of qualitative DQA through visual analysis of experienced spectroscopists. While machine learning methods could be used, the ideal approach would be to develop additional quantitative metrics such as identifying peak splitting, irregular baselines, and other spectral artifacts.Acknowledgements
We would like to acknowledge cBRAIN for the use of their data.References
1. Maudsley AA, Andronesi OC, Barker PB, Bizzi A, Bogner W, Henning A, Nelson SJ, Posse S, Shungu DC, Soher BJ. Advanced magnetic resonance spectroscopic neuroimaging: Experts' consensus recommendations. NMR Biomed. 2021 May;34(5):e4309.
2. Juchem C, Cudalbu C, de Graaf RA, Gruetter R, Henning A, Hetherington HP, Boer VO. B0 shimming for in vivo magnetic resonance spectroscopy: Experts' consensus recommendations. NMR Biomed. 2021 May;34(5):e4350
3. Oz G, Alger JR, Barker PB, Bartha R, et al; MRS Consensus Group. Clinical proton MR spectroscopy in central nervous system disorders. Radiology. 2014 Mar;270(3):658-79.
Figures
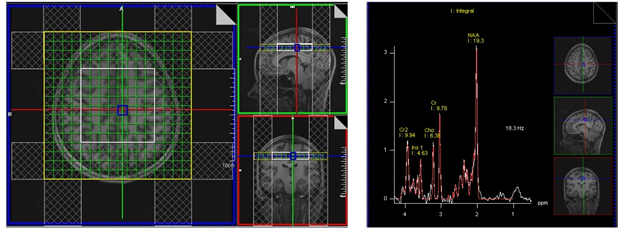
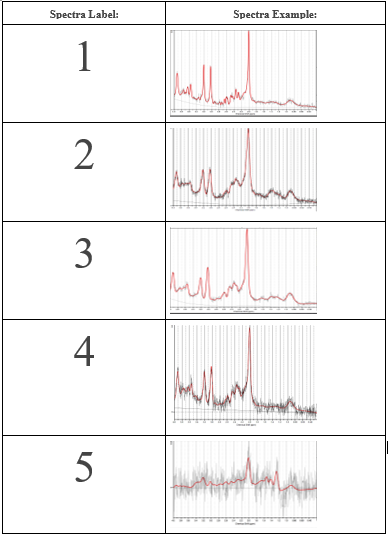
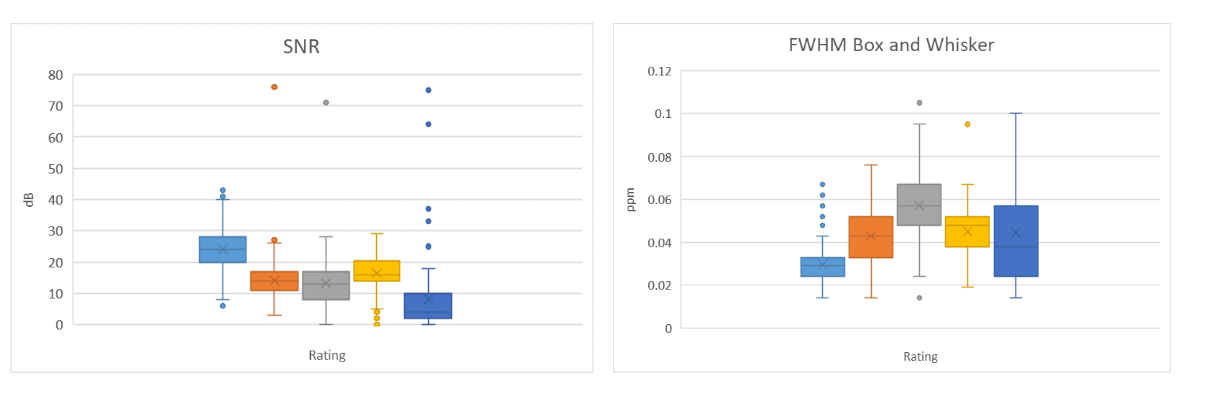
Figure 3A: The rates of SNR in correlation to the 1-5 rating system.
Figure3B: The rates of FWHM in correlation to the 1-5 rating system.