3017
A comparison of semi-automatic quality control methods for 3D-T1 weighted scans1Radiology, Amsterdam UMC, Amsterdam, Netherlands, 2IXICO Plc, London, United Kingdom, 3QMENTA, Barcelona, Spain, 4Imperial College London, London, United Kingdom, 5University College London, London, United Kingdom
Synopsis
Keywords: Data Processing, Artifacts
Motivation: The implementation of QC in T1w MRI scans remains unstandardized and still involves human specialists, without consensus on a systematic approach to identify the presence of artifacts
Goal(s): Our goal was to compare the relative performance of three algorithms with visual QC, and compare their capabilities in detecting simulated blurring, ghosting, and noise artifacts on a new unseen dataset.
Approach: Synthetic artifacts were introduced into MRI scans that passed visual quality control, and thresholds were determined for CAT12 and LONIQC, and a classifier for MRIQC was trained.
Results: MRIQC outperformed CAT12 and LONIQC in detecting both real artifacts as well as simulated artifacts.
Impact: Substantial differences in the performance of different automatic quality control algorithms were shown when compared to visual QC and on simulated data. This suggests that better evaluation of the relation between artifact type, input features and classification methods is needed.
Introduction
Despite efforts towards automation, the implementation of quality control (QC) in magnetic resonance (MR) T1-weighted structural images remains unstandardized and typically still involves human specialists who visually inspect all images. Visual QC is time-consuming, error-prone, and has a high inter-rater variability. While several groups have developed (semi-)automatic quality control algorithms to assess image quality, there is no consensus on a systematic approach to identify the presence of artifacts [1]. Here, we compare the relative performance of three distinct algorithms with visual QC and compare their capabilities in detecting simulated artifacts on a new unseen dataset.Methods
DataWe used a subset (n=200) of the publicly available Child Mind Institute defaced T1-weighted images (n=3323), that had visual QC scores available [2] (Figure 1). The protocol included a 1mm3 isotropic T1-weighted 3D Magnetization Prepared - RApid Gradient Echo (MPRAGE) sequence (for more details see [2]).
On the 100 passed scans, we simulated blurring, ghosting, and noise artifacts using the Queen Square Analytics artifact generator [3]. For each artifact (n=3), this was repeated for five different severity levels (Figure 2), on all images (n=100) independently, resulting in 1500 images.
Automatic quality control
We compared three automatic QC algorithms: CAT12’s Image Quality Rating (IQR) feature [4], LONIQC, which includes 7 features [5], and MRIQC, which includes 64 features [6]. For CAT12 and LONIQC, the thresholds were determined according to [4] and [5], respectively, with the best performance in terms of balanced accuracy. For MRIQC, a classifier was trained according to [6], with a random forest classifier with nested cross-validation (10-fold outer and 5-fold inner split), and robust normalization (with both centering and scaling).
Statistical analysis
To compare the performance of the QC algorithms, multiple metrics were considered: accuracy, sensitivity, specificity, balanced accuracy, negative (NPV), and positive predictive value (PPV). The Matthew’s correlation coefficient (MCC) [7] was computed as equivalent to the chi-square statistic for a 2x2 confusion matrix. The area under the receiver operating characteristic (AUC) was also calculated.
Algorithms were statistically compared using: 1) Fleiss’ Kappa Analysis [8] to compare the three confusion matrices 2) DeLong's test [9] to compare the AUCs 3) McNemar's test [10] to compare misclassifications (regardless of their accuracy).
Results
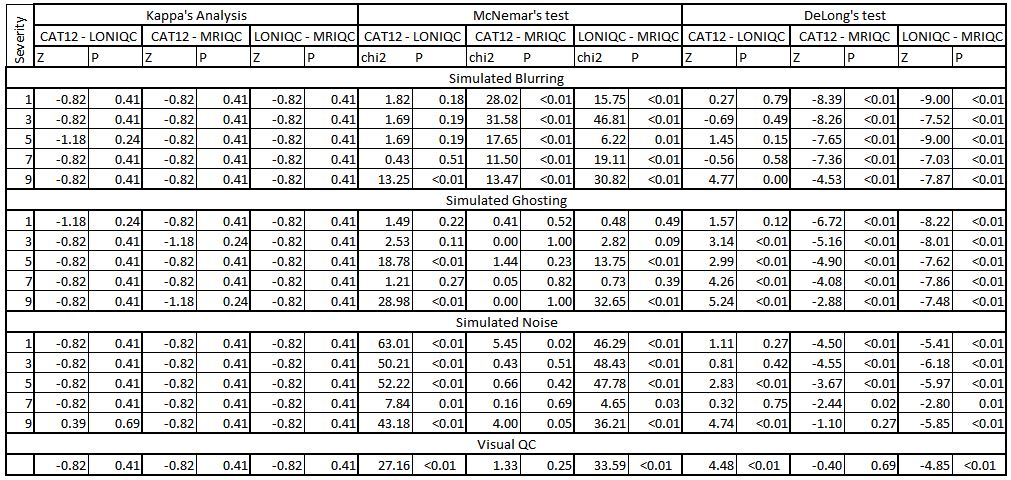
MRIQC also outperformed CAT12 and LONIQC in achieving the highest BA for the three different simulated artifacts, irrespective of their severity (Figure 3). The performance of LONIQC and MRIQC was independent of artifact severity, while the performance of CAT12 improved when stronger artifacts were simulated (Figure 3).Blurring: The confusion matrices of the three algorithms were statistically different for none of the severities (P>0.05) (Figure 4). DeLong’s test indicated that the AUCs of CAT12 and LONIQC were significantly different at the highest severity (Z=4.74, P<0.01, Figure 4), and that the AUCs of MRIQC significantly differed of both CAT12 and LONIQC for all severities (P<0.01, Figure 4).
Ghosting: The confusion matrices did not differ significantly (P>0.24) (Figure 4). AUC was significantly different between the algorithms for all severity levels (P<0.01) except the lowest one for CAT12 and LONIQC (P=0.12). (Figure 4. The misclassification rate for LONIQC was higher than for MRIQC for severity level 5 (χ2=11.05, P<0.01) and for severity level 7 (χ2=36.16, P<0.01).
Noise: The confusion matrices were not statistically different for all severity levels (P>0.41, Figure 4). The AUCs of LONIQC and MRIQC were statistically different for all severity levels (P <- 0.01), and for CAT12 and MRIQC only not for the highest severity level (P=0.27) The misclassification rate was higher for LONIQC than for MRIQC and CAT12 for all severity levels (McNemar’s test: P<0.01).
Discussion
MRIQC outperformed both CAT12 and LONIQC, both for real and simulated artifacts. This might be because MRIQC uses more features than CAT12 and LONIQC to classify the scans. Additionally, in the final classification using MRIQC features, a classifier was trained, as opposed to the other two algorithms, which rely on thresholding for their final classification. Hence, it is recommended that future research explores the use of thresholding algorithms and classifiers, both employing the same feature set, to investigate the factors contributing to this observed difference in performance.Acknowledgements
No acknowledgement found.References
[1] Hendriks, Janine, et al. "A systematic review of (semi-) automatic quality control of T1-weighted MRI scans." medRxiv (2023): 2023-09.
[2] Alexander, Lindsay M., et al. "An open resource for transdiagnostic research in pediatric mental health and learning disorders." Scientific data 4.1 (2017): 1-26.
[3] Ravi, Daniele, et al. "An efficient semi-supervised quality control system trained using physics-based MRI-artefact generators and adversarial training." arXiv preprint arXiv:2206.03359 (2022).
[4] Dahnke, Robert, Rachel Aine Yotter, and Christian Gaser. "Cortical thickness and central surface estimation." Neuroimage 65 (2013): 336-348.
[5] Kim, Hosung, et al. "The LONI QC system: a semi-automated, web-based and freely-available environment for the comprehensive quality control of neuroimaging data." Frontiers in Neuroinformatics 13 (2019): 60.
[6] Esteban, Oscar, et al. "MRIQC: Advancing the automatic prediction of image quality in MRI from unseen sites." PloS one 12.9 (2017): e0184661.
[7] Yule, G. Udny. "On the methods of measuring association between two attributes." Journal of the Royal Statistical Society 75.6 (1912): 579-652.
[8] Cortes, Corinna, and Vladimir Vapnik. "Support-vector networks." Machine learning 20 (1995): 273-297.
[9] DeLong, Elizabeth R., David M. DeLong, and Daniel L. Clarke-Pearson. "Comparing the areas under two or more correlated receiver operating characteristic curves: a nonparametric approach." Biometrics (1988): 837-845.
[10] Dietterich, Thomas G. "Approximate statistical tests for comparing supervised classification learning algorithms." Neural computation 10.7 (1998): 1895-1923.
Figures

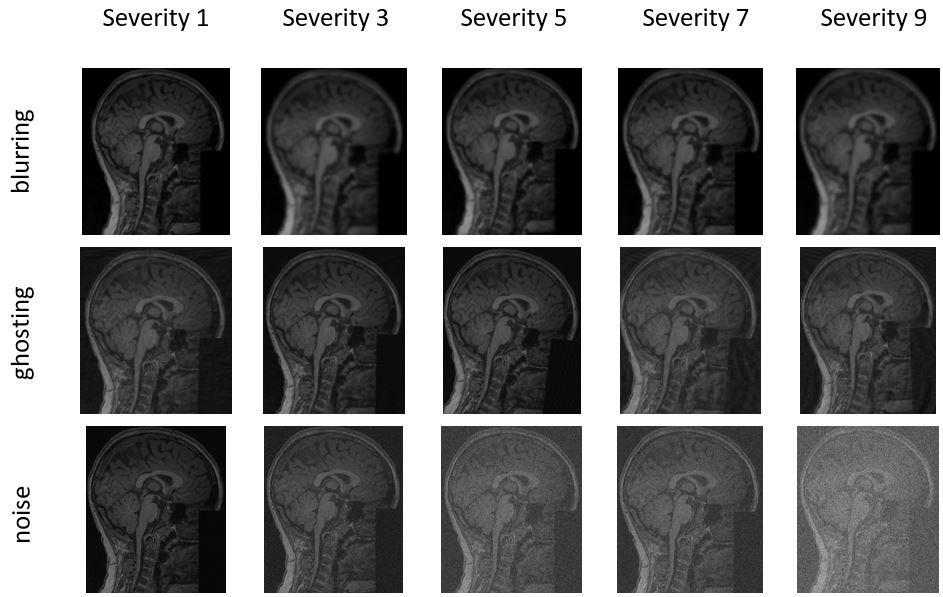
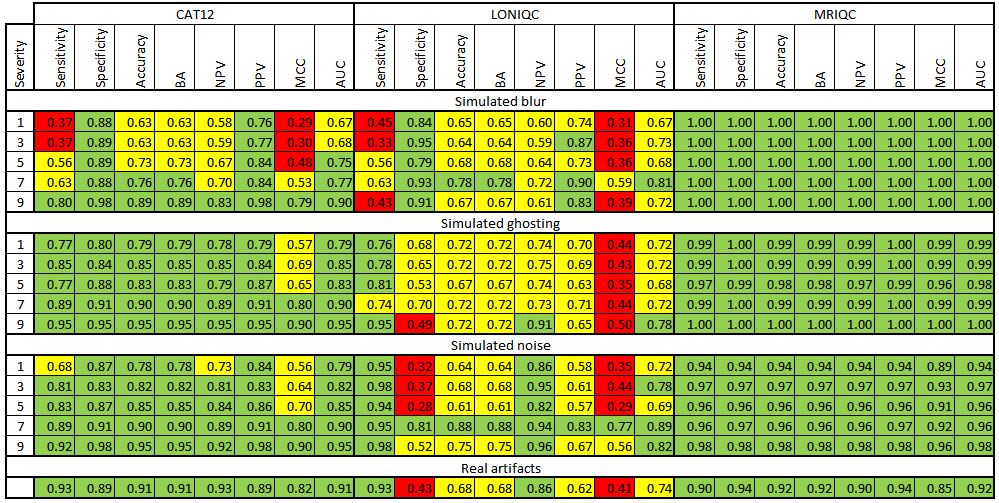
Figure 3: For each artifact and each algorithm, the sensitivity, specificity, accuracy, balanced accuracy (BA), negative predictive value (NPV), positive predictive value (PPV), Matthew’s correlation coefficient (MCC), and area under ROC curve (AUC) are displaced at the best performance. These measures are separately reported for the three simulated artifacts and the real artifacts.
Red: <0.5, Yellow: 0.5-0.75, Green: >0.75