3015
Optimizing QSM-T1w Neuroimaging Templates: Exploring the Impact of the Number of Subjects on Template Quality1Buffalo Neuroimaging Analysis Center, Department of Neurology at the Jacobs School of Medicine and Biomedical Sciences, University at Buffalo, The State University of New York, Buffalo, NY, United States, 2Center for Biomedical Imaging, Clinical and Translational Science Institute, University at Buffalo, The State University of New York, Buffalo, NY, United States, 3Jacobs Multiple Sclerosis Center, Department of Neurology, Jacobs School of Medicine and Biomedical Sciences, University at Buffalo, The State University of New York, Buffalo, NY, United States
Synopsis
Keywords: Segmentation, Susceptibility, QSM template, QSM-T1w, Segmentation, Quantitative, QSM, Normalization
Motivation: Previously, automated delineation of deep gray matter (DGM) regions predominantly relied on T1-weighted (T1w) brain images with limited iron-rich DGM contrast. Multi-contrast atlases incorporating quantitative susceptibility mapping (QSM) have been introduced to overcome this issue and are increasingly being used in multi-atlas segmentation methods.
Goal(s): To determine a generalizable minimum number of subjects to be used for generating high quality QSM-T1w templates.
Approach: We quantitatively investigated the effect of increasing (factor=2) the number of subjects (N=10-160) used for template construction on resulting template quality.
Results: In highly heterogeneous cohorts, more than 40 subjects result in a diminishing return for QSM-T1w template generation.
Impact: Using a small number of subjects for template generation ensures economic use of resources and facilitates the creation of more sub-group templates from the same cohort, to be used in advanced multi-atlas techniques.
Introduction
The quantification of susceptibility values obtained with quantitative susceptibility mapping (QSM) in deep brain structures requires either manual segmentation of the regions, which is time-consuming and subjective1,15, or automated segmentation using machine-learning techniques. A widely used automated technique is (multi-)atlas-based based segmentation.2-6 In the past, brain atlases used by automated techniques were mainly based on T1-weighted (T1w) contrast7,8,13, suffering from low contrast in iron-rich deep gray matter (DGM) nuclei and, consequently, limited segmentation performance in these regions.9-11Several studies10,12 found that atlas-based techniques yield improved segmentation accuracy when multi-contrast data were used, e.g., quantitative susceptibility mapping (QSM) in combination with T1w images.6,14
While multi-contrast atlases are increasingly being used in clinical research16-20, it is yet unknown what is the minimum number of subjects that should be used to generate such templates. The minimum number of subjects is crucial because it affords the creation of sub-population templates for advanced multi-atlas approaches6 (atlas segmentation using multiple templates) in a world where the number of available subject scans is limited.
Here, we systematically determined the minimum number of subjects to be included when creating QSM-T1w templates.
Methods
Subjects: We selected subject scans from an institutional database. Inclusion criterion was the availability of QSM and T1w data acquired with the protocol described below. To assemble a maximally heterogeneous cohort with respect to brain anatomy (worst case for template generation), we sorted all subjects in the order of their normalized brain parenchymal volume (obtained using SIENAX) and selected the 160 multiple sclerosis patients with the lowest brain volume (highest brain atrophy).Scanning protocol: 3T MRI (GE Signa Excite HDx; multi-channel head-neck coil) using a 3D GRE sequence (256x192x64 matrix, 256x192x128mm3, TE/TR=22ms/40ms, BW=13.9kHz, flip=12°) along with 3D T1-weighted images (IR-FSPGR, 1mm isotropic).
QSM reconstruction: Raw k-space data was reconstructed using scalar-phase-matching21, gradient unwarping22, best-path unwrapping.23 LBV24 and SDI25 were incorperated for background field removal and dipole inversion, respectively.
Template creation: We generated bi-modal QSM-T1w brain templates12 using the Advanced Normalization Tools (ANTs) antsMultivariateTemplateConstruction2.sh script.
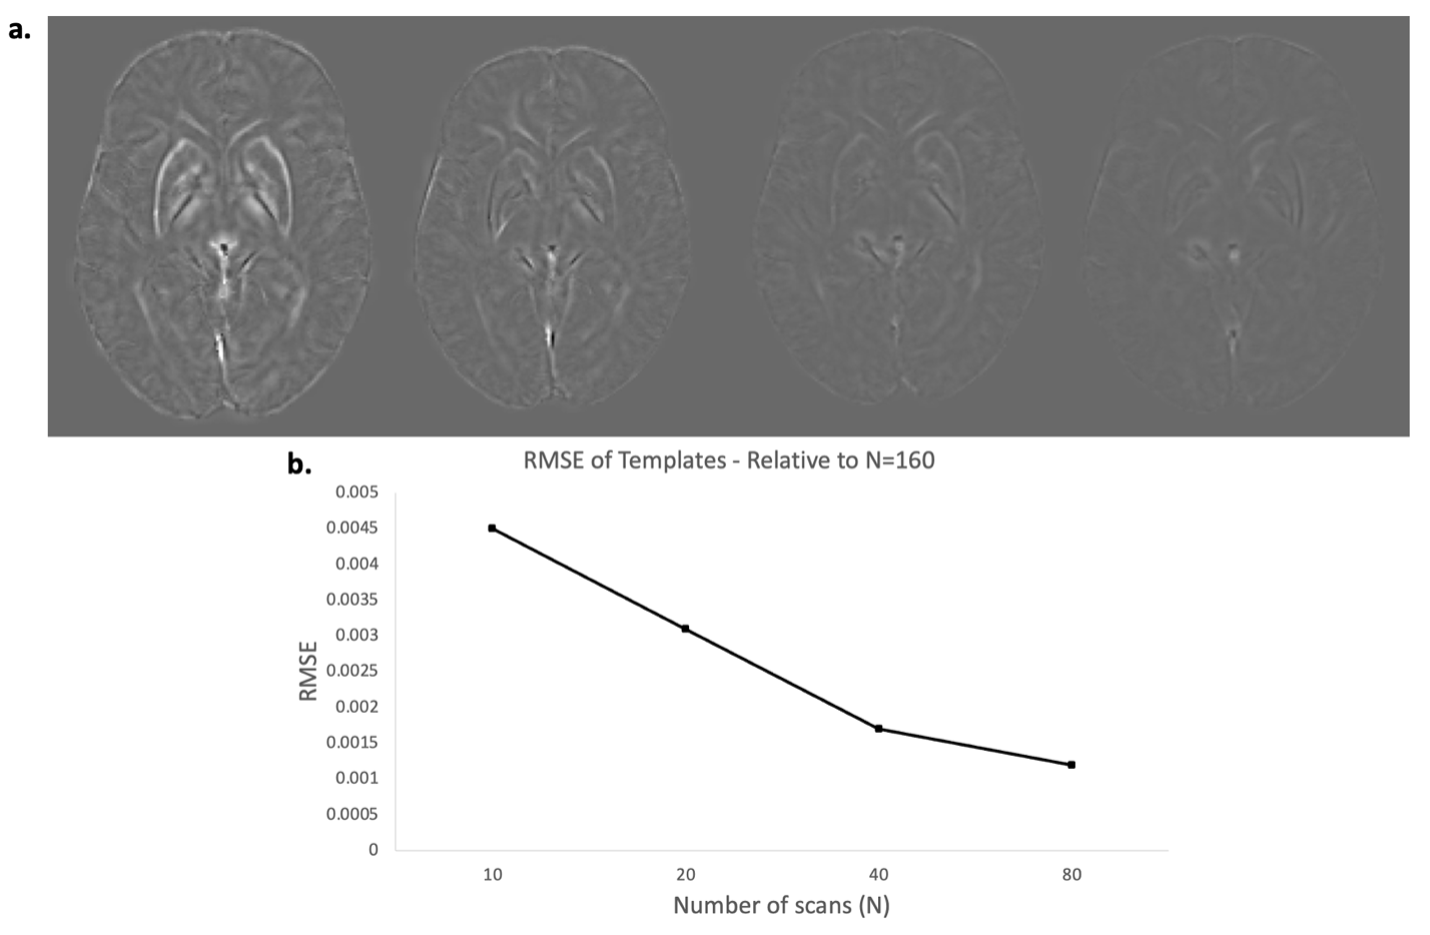
The template from N=160 subjects was used as a gold standard. We applied a subset approach to study the quality of templates generated from smaller numbers of subjects, yet from a cohort with similar anatomical characteristics. The subsets were created by uniformly subsampling the brain volume distribution. Subset templates were generated for N=80, 40, 20, and 10 subjects.
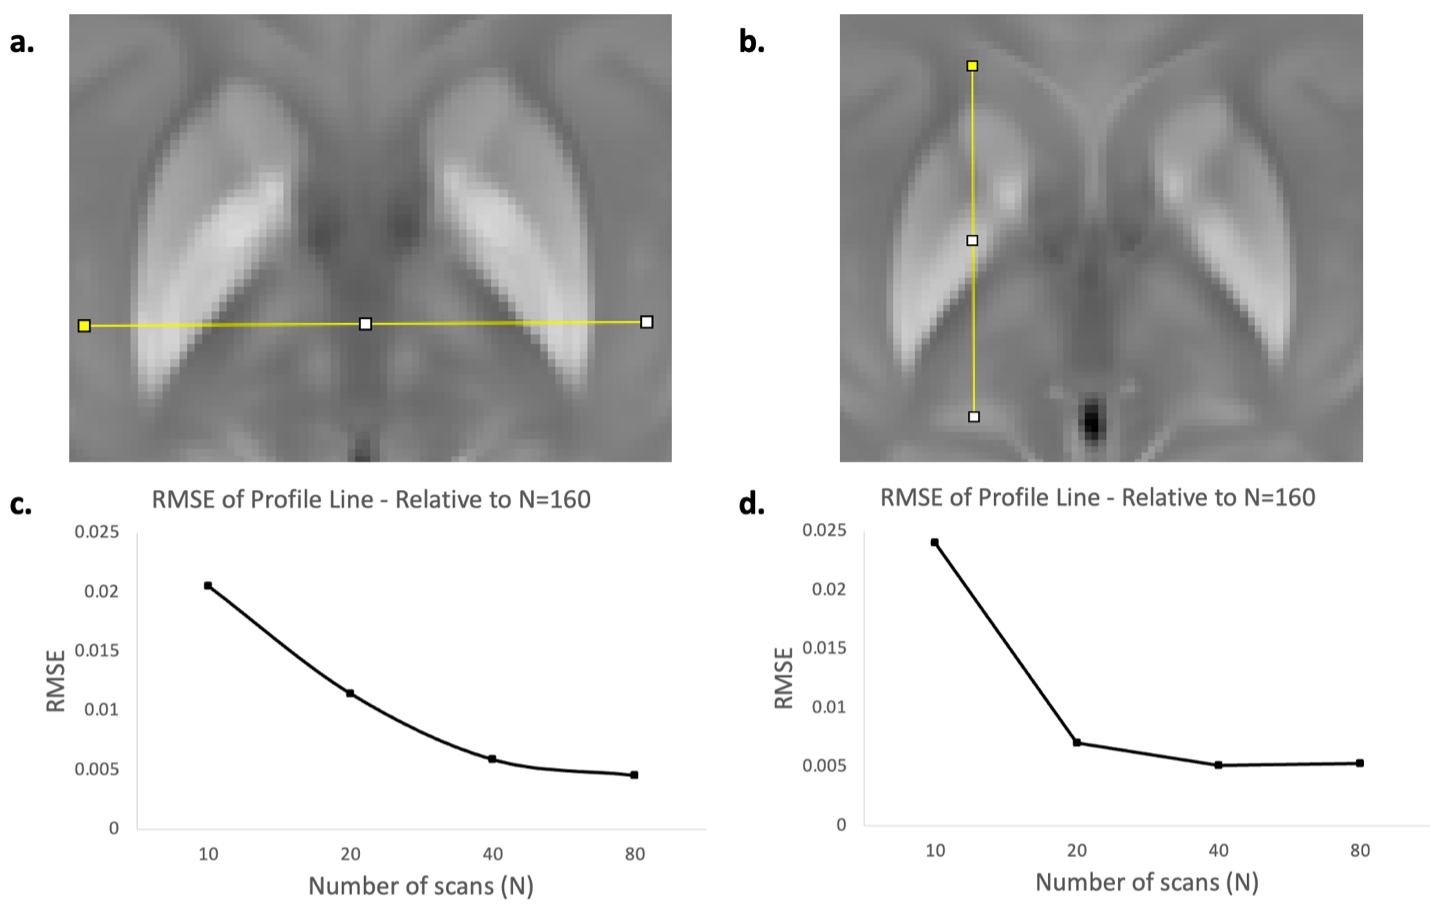
Image analysis: We quantified the effect of N on contrast and edge conspicuity using profile-line analysis in the deep gray matter (ImageJ), as illustrated in Fig. 4a,b. Identical profile lines were applied to all templates and the difference to the reference template was quantified using root mean squared error (RMSE). In addition, we quantified the whole-image RMSE for each template and inspected difference images.
Results
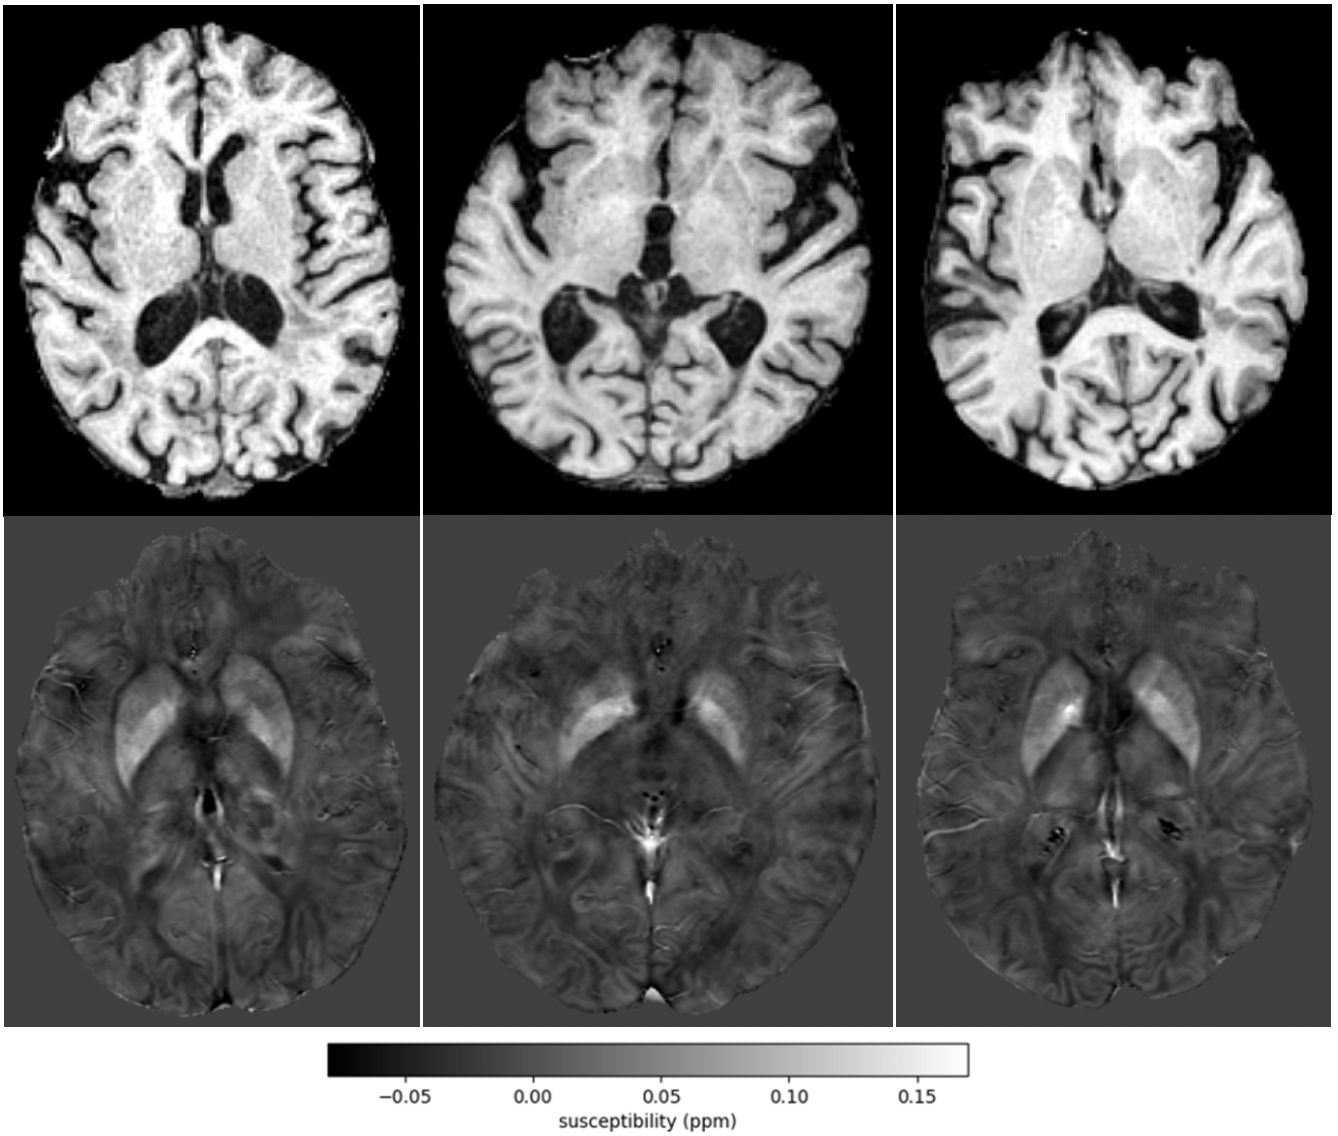
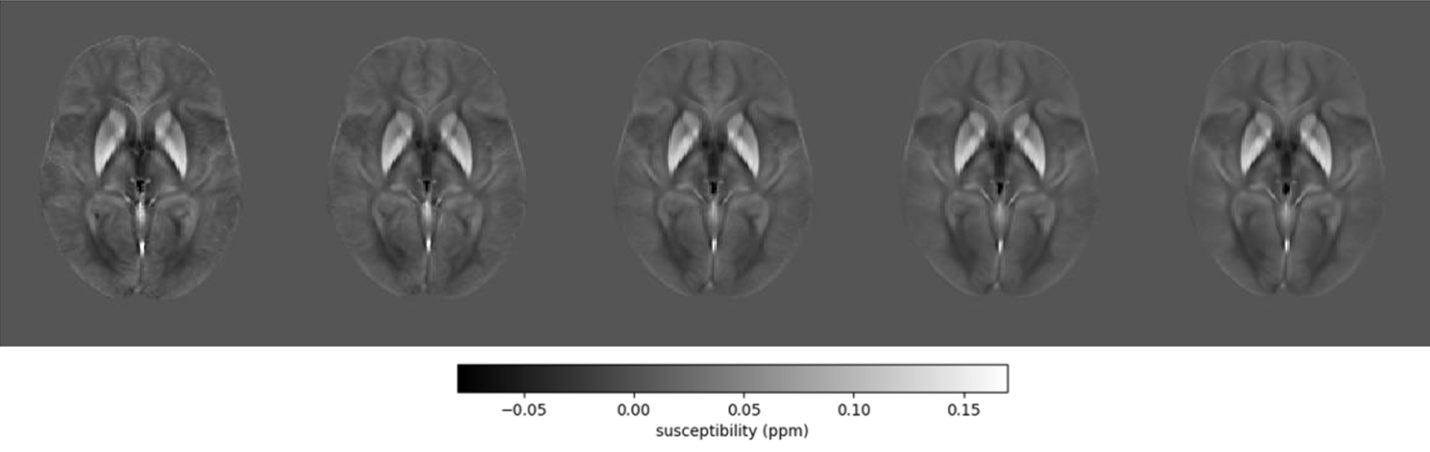
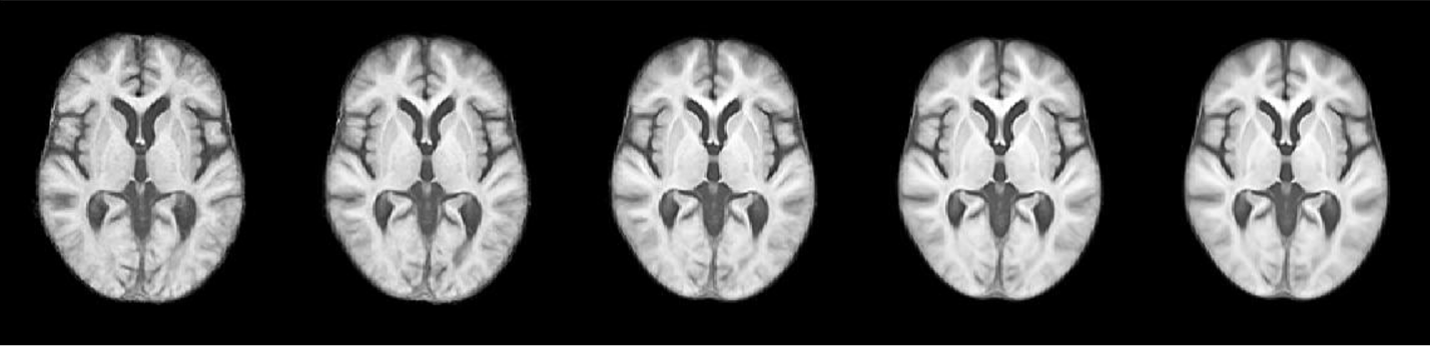
160 exams (three showcased in Fig. 1) were selected from a large set of exams that satisfied the inclusion criteria with an average age of 55.6±10.1 years, 137 females, 23 males, and average normalized brain volume of 1302.8 ±69.2 ml.Figures 2 and 3 portrays the bimodal templates generated for various sample sizes (N), which demonstrated a noticeable reduction in noise as N increases, indicating the impact of sample size on template quality, plateauing after at N=40.
The profile line analysis (Fig. 4c,d) and the whole brain analysis (Fig. 5b) demonstrated a monotonic decrease of the RMSE with increasing N, which plateaued at N=40 (profile line RMSE=5.2 ppb). Whole brain RMSE was around 50% lower for N=40 and 80 (RMSE=1.7 and 1.2 ppb, respectively) compared to N=10 and 20 templates (RMSE=4.5 and 3.1 ppb, respectively). Difference images were consistent with the profile line analysis and showed that increasing Nprimarily improved the edge definition (Fig. 5a).
Discussion
Our study revealed a diminishing return beyond N=40 scans, surpassing the previously recommended rule of thumb suggesting template stability around ten (10) scans.26 This number, although conservative, applies to scans with high atrophy and inter-subject anatomy variation. More homogeneous subject groups may plateau at lower N. Our finding of N=40 may be considered a conservative one-size-fits-all limit that can be used in multi-template generation pipelines to generate a large set of sub-group specific templates automatically.Although MRI acquisition parameter differences may not drastically affect our results, further research should explore potential variations arising from T1w scan contrast differences, scan resolution, and QSM inversion algorithms. Understanding these factors could impact the minimum number of subjects required for a high-quality template.
Conclusion
Our investigation revealed that around 40 is the minimum number of brain scans that should be used for template generation in heterogenous cohorts.Acknowledgements
Research reported in this publication was supported by the National Institute of Neurological Disorders And Stroke of the National Institutes of Health under Award Number R01NS114227 and the National Center for Advancing Translational Sciences of the National Institutes of Health under Award Number UL1TR001412. The content is solely the responsibility of the authors and does not necessarily represent the official views of the National Institutes of Health.References
[1] He N, Ling H, Ding B, Huang J, Zhang Y, Zhang Z, Liu C, Chen K, Yan F, 2015. Region-specific disturbed iron distribution in early idiopathic Parkinson’s disease measured by quantitative susceptibility mapping. Hum Brain Mapp 36, 4407–4420.
[2] Patenaude, B., Smith, S.M., Kennedy, D., and Jenkinson M. A Bayesian Model of Shape and Appearance for Subcortical Brain NeuroImage, 56(3):907-922 (2011).
[3] Klein, A., & Tourville, J. (2012). 101 labeled brain images and a consistent human cortical labeling protocol. Front Neurosci, 6, 171. doi:10.3389/fnins.2012.00171
[4] Fischl B (2012). “FreeSurfer.” Neuroimage, 62(2), pp. 774–781.
[5] Dale, A. M., Fischl, B., & Sereno, M. I. (1999). Cortical surface-based analysis. I. Segmentation and surface reconstruction. Neuroimage, 9(2), 179-194. doi:10.1006/nimg.1998.0395
[6] Li X, Chen L, Kutten K, Ceritoglu C, Li Y, Kang N, Hsu JT, Qiao Y, Wei H, Liu C, Miller MI, Mori S, Yousem DM, van Zijl PCM, Faria AV. Multi-atlas tool for automated segmentation of brain gray matter nuclei and quantification of their magnetic susceptibility. Neuroimage. 2019 May 1;191:337-349. doi: 10.1016/j.neuroimage.2019.02.016. Epub 2019 Feb 7. PMID: 30738207; PMCID: PMC6464637.
[7] Lancaster JL, Woldorff MG, Parsons LM, Liotti M, Freitas CS, Rainey L, Kochunov PV, Nickerson D, Mikiten SA, Fox PT, 2000. Automated Talairach atlas labels for functional brain mapping. Hum Brain Mapp 10, 120–131.
[8] Mazziotta J, Toga A, Evans A, Fox P, Lancaster J, Zilles K, Woods R, Paus T, Simpson G, Pike B, Holmes C, Collins L, Thompson P, MacDonald D, Iacoboni M, Schormann T, Amunts K, Palomero-Gallagher N, Geyer S, Parsons L, Narr K, Kabani N, Le Goualher G, Boomsma D, Cannon T, Kawashima R, Mazoyer B, 2001. A probabilistic atlas and reference system for the human brain: International Consortium for Brain Mapping (ICBM). Philos Trans R Soc Lond B Biol Sci 356, 1293–1322.
[9] Cobzas D, Sun H, Walsh AJ, Lebel RM, Blevins G, Wilman AH. Subcortical gray matter segmentation and voxel-based analysis using transverse relaxation and quantitative susceptibility mapping with application to multiple sclerosis. J Magn Reson Imaging. 2015 Dec;42(6):1601-10. doi: 10.1002/jmri.24951. Epub 2015 May 18. PMID: 25980643.
[10] Feng, X et al. An improved FSL-FIRST pipeline for subcortical gray matter segmentation to study abnormal brain anatomy using quantitative susceptibility mapping (QSM). Magn Reson Imaging. 2017 Jun; 39:110-122.
[11] Lim IA, Faria AV, Li X, Hsu JT, Airan RD, Mori S, van Zijl PC, 2013. Human brain atlas for automated region of interest selection in quantitative susceptibility mapping: application to determine iron content in deep gray matter structures. NeuroImage 82, 449–469.
[12] Hanspach, J. et al. Methods for the computation of templates from quantitative magnetic susceptibility maps (QSM): Toward improved atlas- and voxel-based analyses (VBA). J Magn Reson Imaging 46, 1474–1484 (2017).
[13] Lyman C, Lee D, Ferrari H, Fuchs TA, Bergsland N, Jakimovski D, Weinstock-Guttmann B, Zivadinov R, Dwyer MG. MRI-based thalamic volumetry in multiple sclerosis using FSL-FIRST: Systematic assessment of common error modes. J Neuroimaging. 2022 Mar;32(2):245-252. doi: 10.1111/jon.12947. Epub 2021 Nov 12. PMID: 34767684.
[14] Zhang Y, Wei H, Cronin MJ, He N, Yan F, Liu C, 2018. Longitudinal atlas for normative human brain development and aging over the lifespan using quantitative susceptibility mapping. NeuroImage 171, 176–189.
[15] Li W, Wu B, Batrachenko A, Bancroft-Wu V, Morey RA, Shashi V, Langkammer C, De Bellis MD, Ropele S, Song AW, Liu C, 2014. Differential developmental trajectories of magnetic susceptibility in human brain gray and white matter over the lifespan. Hum Brain Mapp 35, 2698–2713.
[16] Schweser F, Raffaini Duarte Martins AL, Hagemeier J, Lin F, Hanspach J, Weinstock-Guttman B, Hametner S, Bergsland N, Dwyer MG, Zivadinov R. Mapping of thalamic magnetic susceptibility in multiple sclerosis indicates decreasing iron with disease duration: A proposed mechanistic relationship between inflammation and oligodendrocyte vitality. Neuroimage. 2018 Feb 15;167:438-452. doi: 10.1016/j.neuroimage.2017.10.063. Epub 2017 Oct 31. PMID: 29097315; PMCID: PMC5845810.
[17] Pontillo G, Petracca M, Monti S, Quarantelli M, Criscuolo C, Lanzillo R, Tedeschi E, Elefante A, Brescia Morra V, Brunetti A, Cocozza S, Palma G. Unraveling Deep Gray Matter Atrophy and Iron and Myelin Changes in Multiple Sclerosis. AJNR Am J Neuroradiol. 2021 Jul;42(7):1223-1230. doi: 10.3174/ajnr.A7093. Epub 2021 Apr 22. PMID: 33888456; PMCID: PMC8324266.
[18] Li J, Zhang Q, Zhang N, Guo L. Increased Brain Iron Detection by Voxel-Based Quantitative Susceptibility Mapping in Type 2 Diabetes Mellitus Patients With an Executive Function Decline. Front Neurosci. 2021 Jan 15;14:606182. doi: 10.3389/fnins.2020.606182. PMID: 33519360; PMCID: PMC7843466.
[19] Reeves JA, Bergsland N, Dwyer MG, Wilding GE, Jakimovski D, Salman F, Sule B, Meineke N, Weinstock-Guttman B, Zivadinov R, Schweser F. Susceptibility networks reveal independent patterns of brain iron abnormalities in multiple sclerosis. Neuroimage. 2022 Nov 1;261:119503. doi: 10.1016/j.neuroimage.2022.119503. Epub 2022 Jul 22. PMID: 35878723; PMCID: PMC10097440.
[20] Hagemeier J, Ramanathan M, Schweser F, Dwyer MG, Lin F, Bergsland N, Weinstock-Guttman B, Zivadinov R. Iron-related gene variants and brain iron in multiple sclerosis and healthy individuals. Neuroimage Clin. 2017 Nov 8;17:530-540. doi: 10.1016/j.nicl.2017.11.003. PMID: 29201641; PMCID: PMC5699896.
[21] Robinson SD, Bredies K, Khabipova D, Dymerska B, Marques JP, Schweser F. An illustrated comparison of processing methods for MR phase imaging and QSM: combining array coil signals and phase unwrapping. NMR Biomed. 2017 Apr;30(4):e3601. doi: 10.1002/nbm.3601. Epub 2016 Sep 13. PMID: 27619999; PMCID: PMC5348291.
[22] Polak, P., Zivadinov, R., Ferdinand Schweser, F. Gradient Unwarping for Phase Imaging Reconstruction. DOI:10.13140/2.1.1857.7603. ISMRM 2014
[23] Hussein S. Abdul-Rahman, Munther A. Gdeisat, David R. Burton, Michael J. Lalor, Francis Lilley, and Christopher J. Moore, "Fast and robust three-dimensional best path phase unwrapping algorithm," Appl. Opt. 46, 6623-6635 (2007)
[24] Zhou, D., Liu, T., Spincemaille, P. & Wang, Y. Background field removal by solving the Laplacian boundary value problem. NMR Biomed 27, 312–319 (2014).
[25] Schweser F, Deistung A, Sommer K, Reichenbach JR. Toward online reconstruction of quantitative susceptibility maps: superfast dipole inversion. Magn Reson Med. 2013 Jun;69(6):1582-94. doi: 10.1002/mrm.24405. Epub 2012 Jul 12. PMID: 22791625.
[26] Avants BB, Tustison N, Song G. Advanced normalization tools (ANTS) Insight J. 2009;2:1–35.
Figures