3014
Quality assurance of quantitative MRI protocol for a hypoxia imaging clinical study in glioblastoma1Image X Institute, Sydney School of Health Sciences, The University of Sydney, Sydney, New South Wales, Australia, 2Institute of Medical Physics, School of Physics, The University of Sydney, Sydney, New South Wales, Australia, 3Department of Radiation Oncology, Northern Sydney Cancer Centre, Royal North Shore Hospital, Sydney, Sydney, New South Wales, Australia, 4The Brain Cancer Group Sydney, St Leonards, New South Wales, Australia, 5Department of Neuroradiology, Royal North Shore Hospital, Sydney, New South Wales, Australia, 6Siemens Healthcare Pty Ltd, Brisbane, Queensland, Australia, 7Centre for Health Economics Research and Evaluation, University of Technology Sydney, Sydney, New South Wales, Australia, 8Department of Neurosurgery, Royal North Shore Hospital, Sydney, New South Wales, Australia, 9Department of Nuclear Medicine, Royal North Shore Hospital, Sydney, New South Wales, Australia, 10Department of Neuroradiology, North Shore Radiology and Nuclear Medicine, St Leonards, New South Wales, Australia
Synopsis
Keywords: System Imperfections, Precision & Accuracy, Phantoms, brain, quantitative imaging, system imperfections: Measurement & correction
Motivation: A quantitative MRI (qMRI) protocol was developed for a clinical study aimed at identifying regions of tumour hypoxia in glioblastoma patients. Technical validation of qMRI biomarkers requires thorough testing of the protocol against reference standards.
Goal(s): To assess and report accuracy, repeatability, and reproducibility of the qMRI protocol.
Approach: Test-retest scans of the NIST systems phantom were acquired on two 3T MAGNETOM VIDA scanners. Accuracy, repeatability and reproducibility of T1, T2 maps, and calibrated T1 maps from dynamic oxygen enhanced imaging were assessed.
Results: qMRI parameters acquired with the study protocol showed accuracy, repeatability and reproducibility comparable to published literature findings.
Impact: Accuracy and precision (repeatability and reproducibility) of a qMRI protocol for glioblastoma hypoxia imaging were quantified. T1, including calibrated dynamic values, showed high accuracy and precision. T2 showed low accuracy compared to published findings. T2 and T2* showed moderate precision.
Introduction
Quantitative MRI (qMRI) has shown potential to providing non-invasive imaging biomarkers of hypoxia for improved tumour delineation, radiotherapy planning, treatment response assessment and prediction of prognosis in glioblastoma.[1] A qMRI protocol, including oxygen enhanced (OE) and a blood-oxygen level dependent (BOLD) sequences, was developed to quantify tumour in the prospective Magnetic resonance imAging of hypoxia for radiatioN treatment guidance in Glioblastoma multifOrme (MANGO) clinical study. Performance of quantitative imaging biomarkers (QIBs) is known to vary between protocols, scanners, and even within scanners.[2-4] Methods for measuring and evaluating QIBs performance using phantom reference standards has been established.[5] The goal of this study was to assess and report the accuracy, short-term intra-scanner repeatability, and inter-scanner reproducibility of the qMRI parameters acquired with the MANGO study MRI protocol.Methods
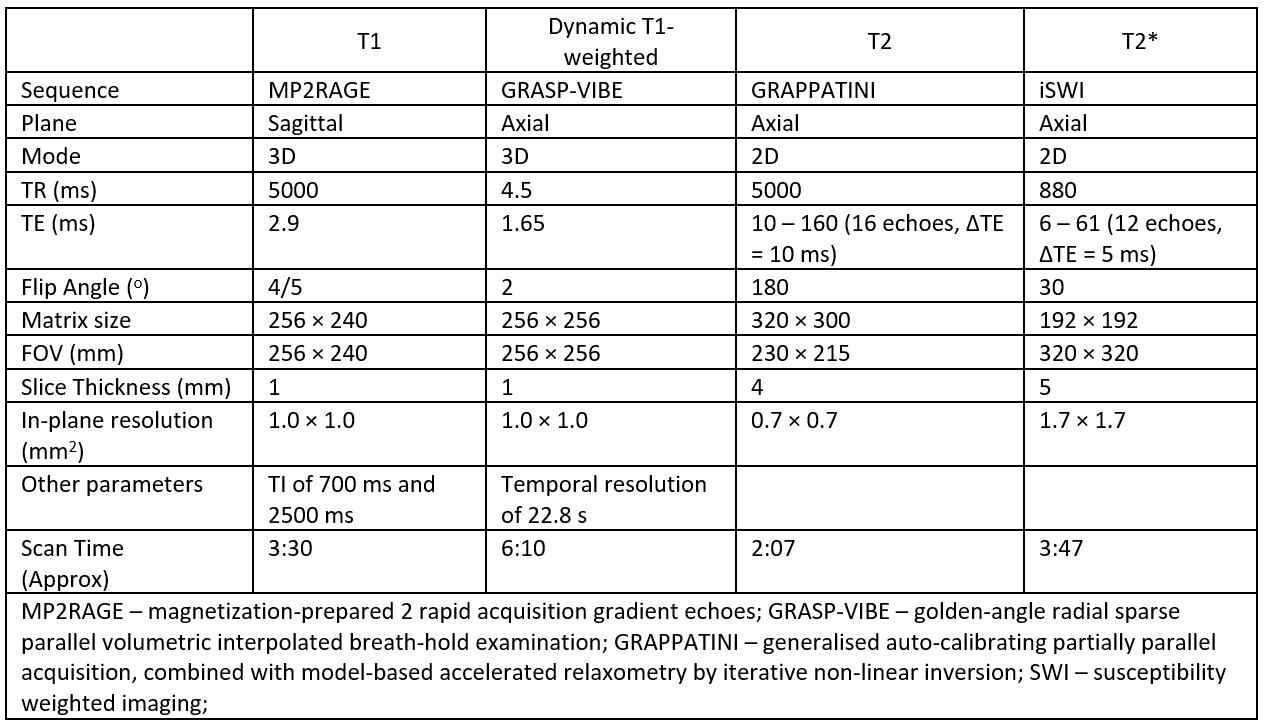
The qMRI protocol consisted of OE and BOLD MRI approaches involving T1, T2, and T2* mapping sequences, with imaging parameters shown in Table 1. Test-retest scans (same session, with reposition) were acquired on the System phantom (CalibreMRI, Boulder, Colorado USA), with known T1 and T2 values, in two 3T MRI units (two MAGNETOM Vida, Siemens, Erlangen, Germany). Parametric maps of T1, T2, and T2* were obtained from inline image processing on the Syngo workstation (Siemens, Erlangen, Germany). Dynamic T1 maps were computed from the dynamic T1-weighted imaging sequences using in-house code. Mean T1 values were extracted from compartments 1 to 5 in the T1 array of the System phantom (T1 range from 509ms to 1838ms). Mean T2 and T2* values were obtained in compartments 1 to 9 in the T2 array of the System phantom (T2 range from 30ms to 286ms). Errors in accuracy of the T1 and T2 measurements was calculated as the percentage absolute deviation from the reference values. Bland-Altman analysis were used to compare measured values with manufacturer’s reference T1 and T2 values and assess repeatability (within scanner) and reproducibility (between scanner) of T1, dynamic T1, T2, and T2* measurements. Limits of agreement were calculated as the 95% CI on the mean difference. Repeatability and reproducibility for each of the array compartments were assessed using the coefficient of variation (%CV) in the T1, dynamic T1, T2, and T2* measurements. Temporal stability of signal intensities from the dynamic T1-weighted sequence and dynamic T1 values in each compartment were assessed using %CV. The temporal stability of dynamic T1 measurements calculated with in-house code was compared to the outputs from a commercial software, IB DCE (ImagingBiometrics, Elm Grove, USA).Results
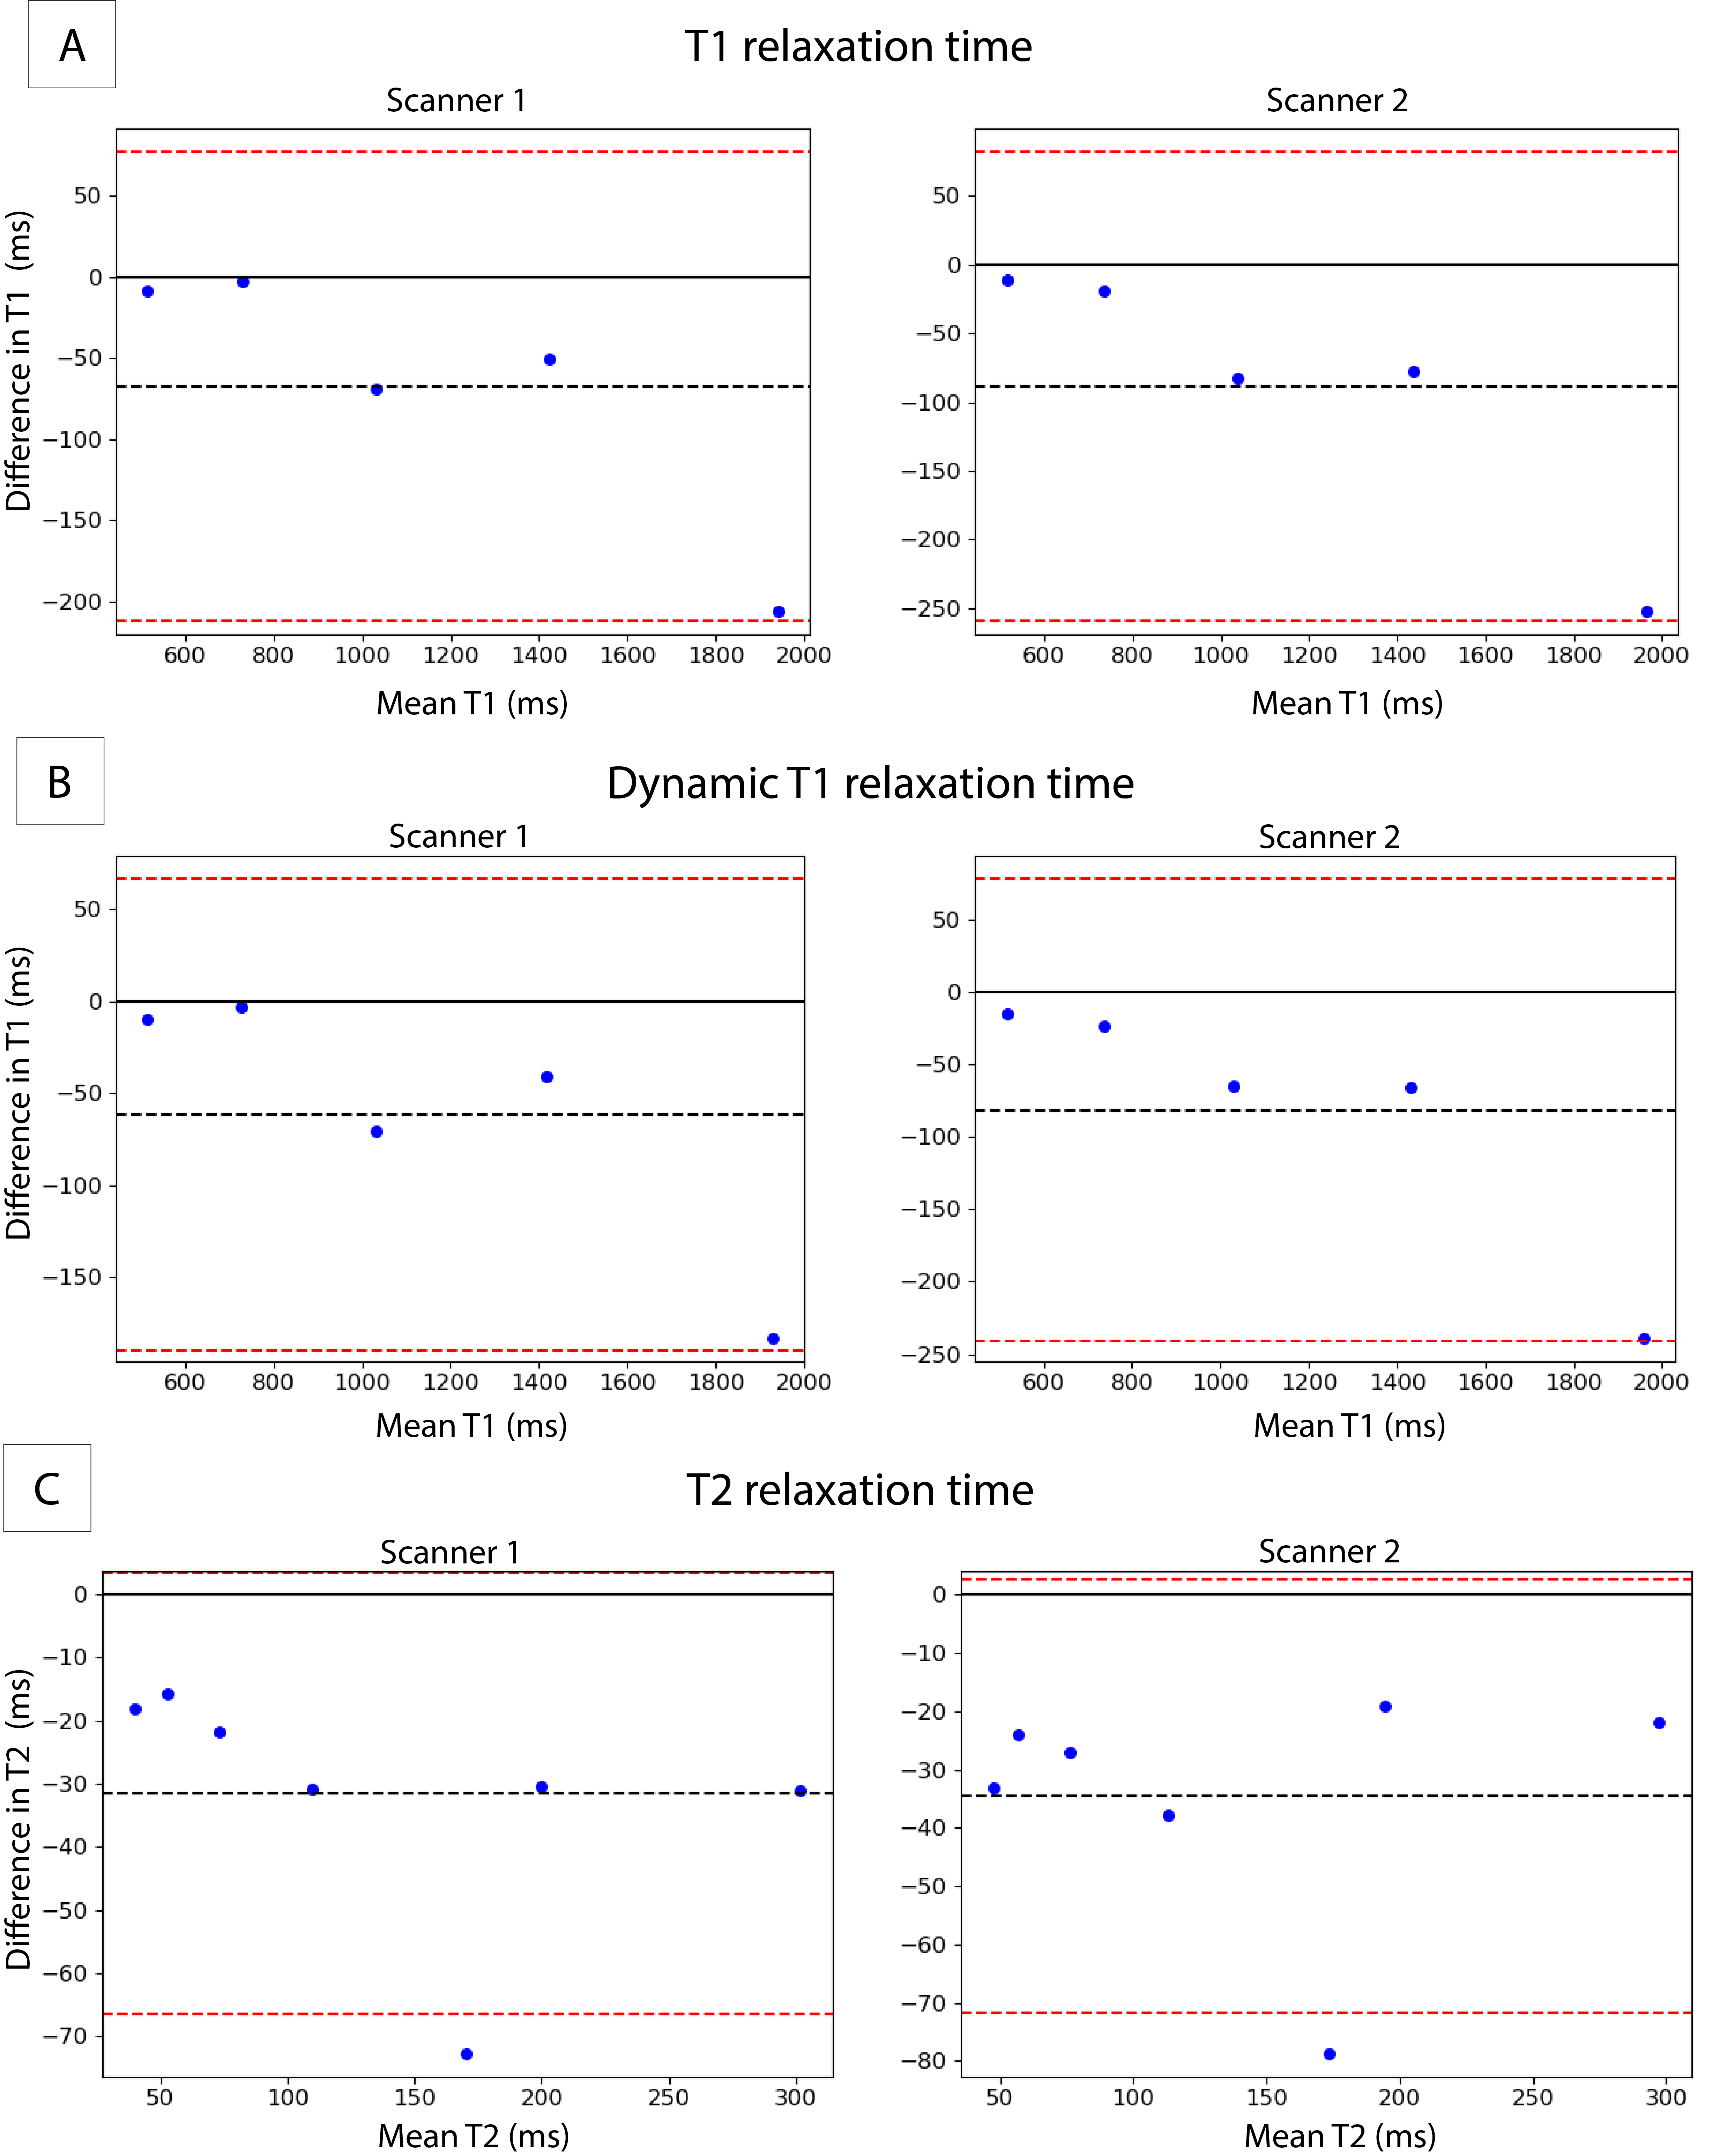
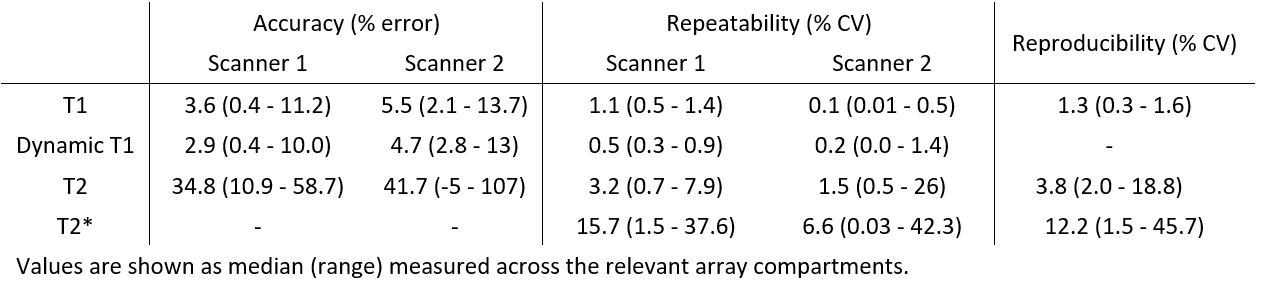
Bland-Altman plots comparing measured and reference T1, dynamic T1, and T2 values are shown in Figure 1. Median and range of errors in each compartment are given in Table 2. Errors in T1, dynamic T1, and T2 measurements were within limits of agreement, with the exception of the measured T2 values for the compartment with reference value of 134.1ms in both scanners.The repeatability and reproducibility of T1, dynamic T1, T2, and T2* is shown in Table 2. T1 and dynamic T1 showed high repeatability and reproducibility on both scanners (ICC > 0.99, %CVs<2%). T2* measurements were less repeatable and reproducible (ICC = 0.8), particularly in the two samples with highest expected values (T2 = 184.8 and 286.0 ms).
Signal intensities of the dynamic T1-weighted sequence showed high temporal stability (%CV<1%). Compared to dynamic T1 measurements computed using commercial software (%CV = 0.0%), values computed with in-house code showed relatively lower temporal stability, with median %CV of 0.5% (range of 0.2% to 0.9%).
Discussion
The qMRI protocol developed for hypoxia imaging in glioblastoma demonstrated high repeatability and reproducibility of T1, dynamic T1, T2 and T2* measurements. The accuracy of T1 measurements were similar or higher compared to performance of conventional techniques, such as variable flip angle.[2, 4] The accuracy of T2 measurements (~40%), however, were lower compared to published literature findings (<5%).[6] Whilst the cause is unknown, the compartment with T2 of 134.1ms showed consistently larger accuracy error on both scanners. Further investigation is required to distinguish between phantom and protocol-related causes. The dynamic T1-weighted sequence demonstrated high temporal stability, comparable to literature findings.[7] Differences in dynamic T1 values calculated with in-house and commercial software could be due to different fitting methods.Conclusion
A quality assurance study using a commercial phantom was conducted on two scanners to evaluate the accuracy, repeatability and reproducibility of a qMRI protocol for hypoxia imaging in glioblastoma. The quantified uncertainties will be used to further optimise the imaging protocol for patient imaging and for calibration of the qMRI measurements that will be acquired on glioblastoma patients in the MANGO trial.Acknowledgements
The authors acknowledge funding from The Brain Cancer Group, Cancer Institute NSW Early Career Fellowship (2019/ECF1015) and the Australian National Health and Medical Research Council Program Grant (APP1132471). The NIST Systems phantom used in this study was provided by Liverpool and Macarthur Cancer Therapy Centre.References
[1] Waldman AD, Jackson A, Price SJ, Clark CA, Booth TC, Auer DP, et al. Quantitative imaging biomarkers in neuro-oncology. Nature Reviews Clinical Oncology 2009;6(8):445-54.[2] Bane O, Hectors SJ, Wagner M, Arlinghaus LL, Aryal MP, Cao Y, et al. Accuracy, repeatability, and interplatform reproducibility of T1 quantification methods used for DCE-MRI: Results from a multicenter phantom study. Magn Reson Med 2018;79(5):2564-75.
[3] Deng J, Wang Y. Quantitative magnetic resonance imaging biomarkers in oncological clinical trials: Current techniques and standardization challenges. Chronic Dis Transl Med 2017;3(1):8-20.
[4] Wang Y, Tadimalla S, Rai R, Goodwin J, Foster S, Liney G, et al. Quantitative MRI: Defining repeatability, reproducibility and accuracy for prostate cancer imaging biomarker development. Magn Reson Imaging 2021;77:169-79.
[5] Shukla-Dave A, Obuchowski NA, Chenevert TL, Jambawalikar S, Schwartz LH, Malyarenko D, et al. Quantitative imaging biomarkers alliance (QIBA) recommendations for improved precision of DWI and DCE-MRI derived biomarkers in multicenter oncology trials. J Magn Reson Imaging 2019;49(7):e101-e21.
[6] Hilbert T, Sumpf TJ, Weiland E, Frahm J, Thiran J-P, Meuli R, et al. Accelerated T2 mapping combining parallel MRI and model-based reconstruction: GRAPPATINI. J Magn Reson Imaging 2018;48(2):359-68.
[7] Benz MR, Bongartz G, Froehlich JM, Winkel D, Boll DT, Heye T. Acceleration techniques and their impact on arterial input function sampling: Non-accelerated versus view-sharing and compressed sensing sequences. Eur J Radiol 2018;104:8-13.
Figures