3012
Quality Assurance of Diffusion and Fat Imaging using System Phantoms: Reproducibility for Multivendor Neuromuscular Studies1Translational Neuroscience, Barrow Neurological Institute, Phoenix, AZ, United States, 2Neuroimaging Innovation Center, Barrow Neurological Institute, Phoenix, AZ, United States, 3University of Arizona, Tucson, AZ, United States
Synopsis
Keywords: Phantoms, Neuro, Phantom, diffusion, fat imaging
Motivation: Our multi-site studies require quality assurance for diffusion and proton density fat fraction (PDFF) imaging across vendors.
Goal(s): To establish DWI and PDFF protocols and analysis tools to evaluate reproducibility and reliability.
Approach: DWI and PDFF protocols were conducted on two 3T MRI systems (Philips and GE) on a diffusion phantom and a PDFF phantom. The measured ADC and PDFF values were compared across the scanners and also compared with the phantom reference values. Correlation coefficient and root-mean-square error (RMSE) were reported.
Results: High reproducibility and high accuracy were achieved across the MRI vendors as indicated by the correlation coefficients and RMSE.
Impact: Our results showed that quality assurance can be well maintained between the two MRI scanners, both DWI and PDFF measured on the two scanners at our institute are reliable and accurate, this has important implications for our future multi-site studies.
INTRODUCTION
Diffusion-weighted imaging (DWI) is an MRI technique that is sensitive to the effect of tissue barriers on the diffusion of water molecules1. By highlighting tissues with different apparent diffusion coefficient (ADC), DWI can distinguish structural abnormalities, such as peripheral nerve trauma from surrounding healthy tissue2,3. In addition, information about cellular shape/structure can be inferred from the direction dependence (or anisotropy) of diffusion in tissue (e.g., diffusion is faster along axons than across them). This can provide valuable non-invasive diagnostic and/or monitoring tools to guide clinical decision making (e.g., whether a nerve repair was successful). The ability to produce precise and accurate DWI based measurements requires a properly calibrated, reliable MRI scanner. During recent years, MRI proton density fat fraction (PDFF) has also emerged as an objective, image-based biomarker of neuromuscular diseases4,5. By providing quantitative data about the amount and distribution of fat within muscles6,7, FF MRI can aid in the detection, diagnosis, and monitoring of chronic muscle denervation effects (atrophy and fat replacement). Combined nerve diffusion and muscle PDFF provide information on nerve de/regeneration and the functional consequences of these nerve pathologies in downstream muscles. As such they may provide novel biomarkers of disease progression and treatment response in clinical trials. In an effort to move these toward clinical trial readiness, we conducted DWI and PDFF across two MRI vendors at our institute to evaluate reproducibility and provide quality assurance.METHODS
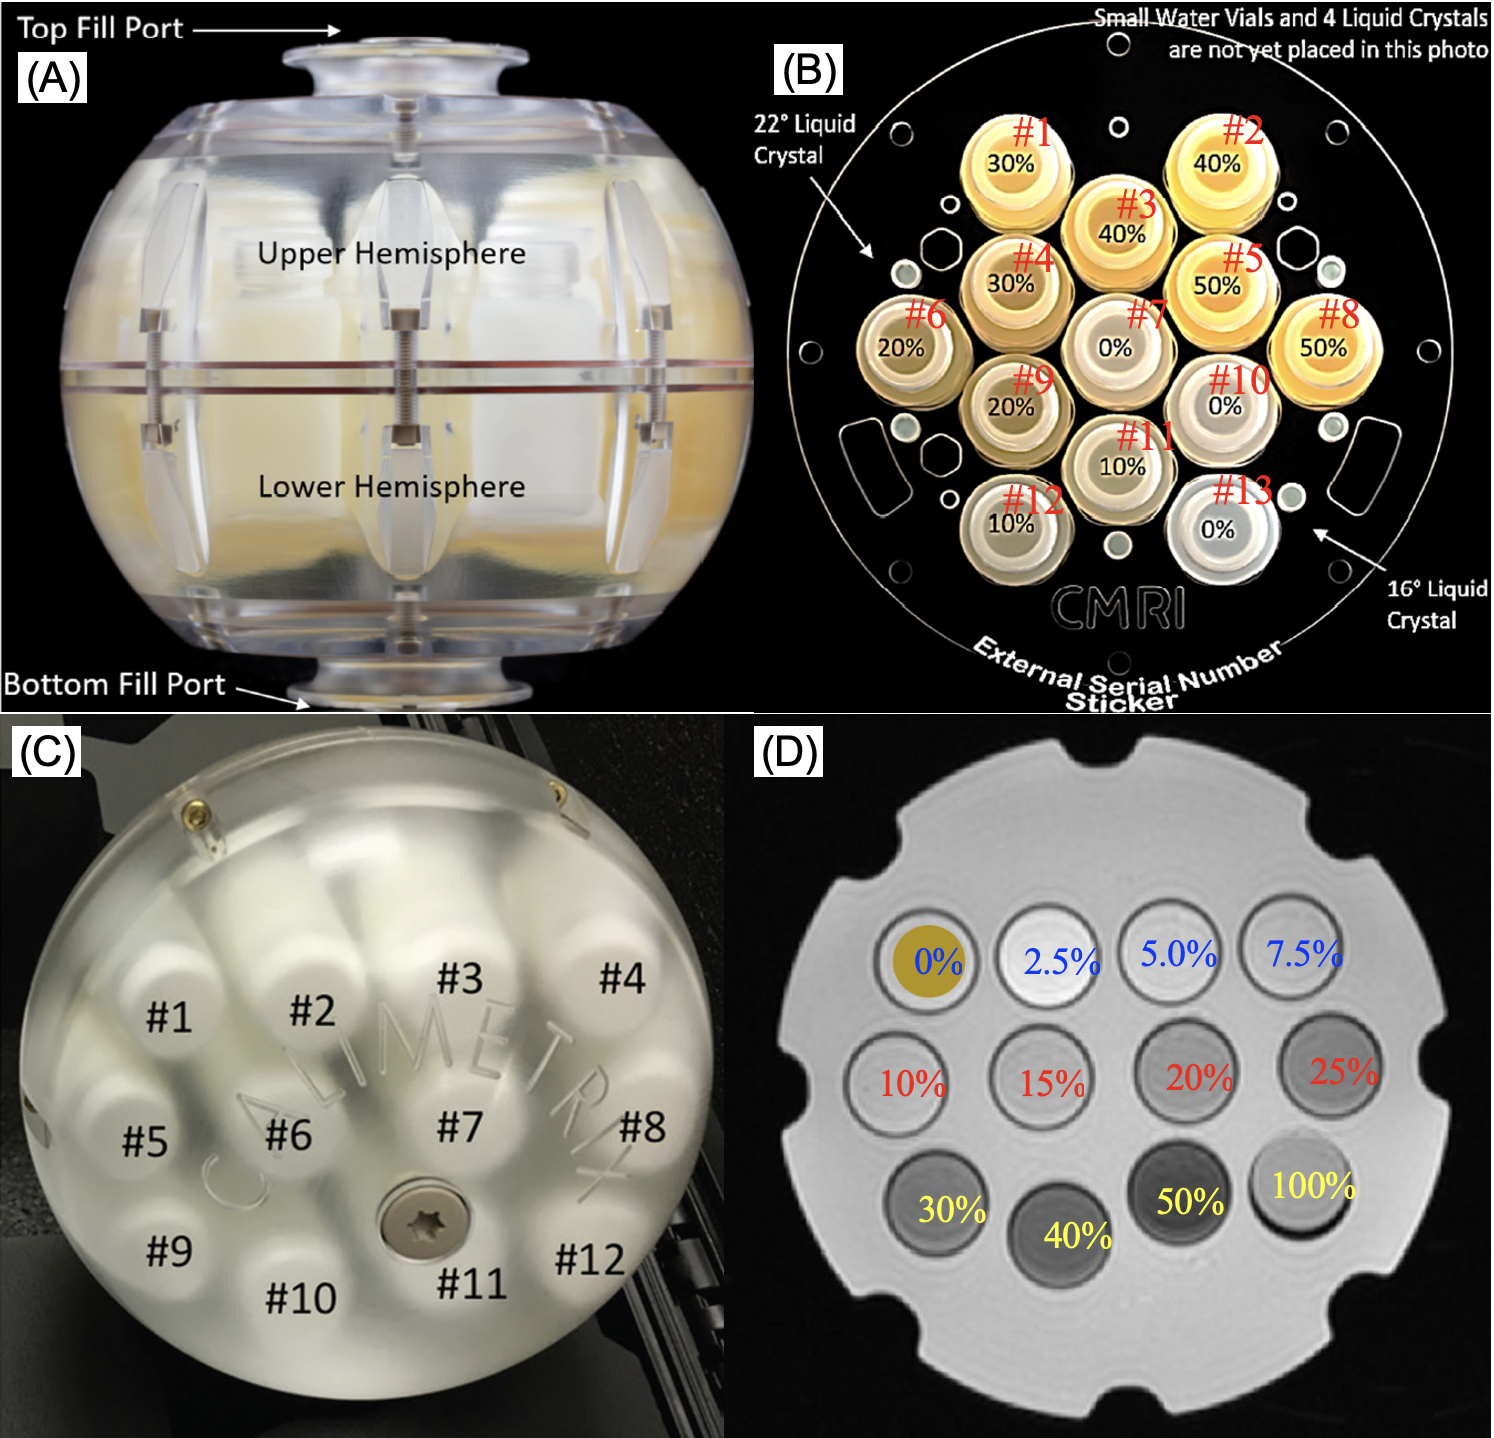
Two MRI systems, a Philips 3T Ingenia scanner (Philips Healthcare, Best, The Netherlands), and a GE 3T SIGNA Premier scanner (GE Healthcare Systems, Waukesha, WI, USA) were used in this study. A diffusion phantom (CaliberMRI, Model 128) and a PDFF phantom (Calimetrix, model 300) were employed for diffusion and PDFF imaging respectively, see Fig 1. For diffusion imaging, a SE-EPI sequence was used with following parameters: FOV = 220x220 mm2,TR = 8000 ms, TE (minimum) < 130 ms, Matrix = 128x128 mm2, thickness = 4 mm, b-values = [0, 500, 1000, 1500, 2000 s/mm2], and scan time ~ 4 min; For PDFF, the vendor protocols (Philips: mDixon-Quant; GE: IDEAL IQ) were used with following parameters: FOV = 400x400 mm2, TR = 5.55 – 7.32 ms, first TE = 0.69 – 0.99 ms, TE spacing = 0.69 – 0.97 ms, FA = 3°, echo number = 6, Matrix = 192x192 mm2, and scan time ~ 20 sec. Both PDFF protocols can output the FF map directly. After data acquisition, the ADC maps and FF maps from both scanners were compared respectively, which were also compared to the phantom reference values. In addition, correlation coefficient and root-mean-square error (RMSE) were calculated.RESULTS
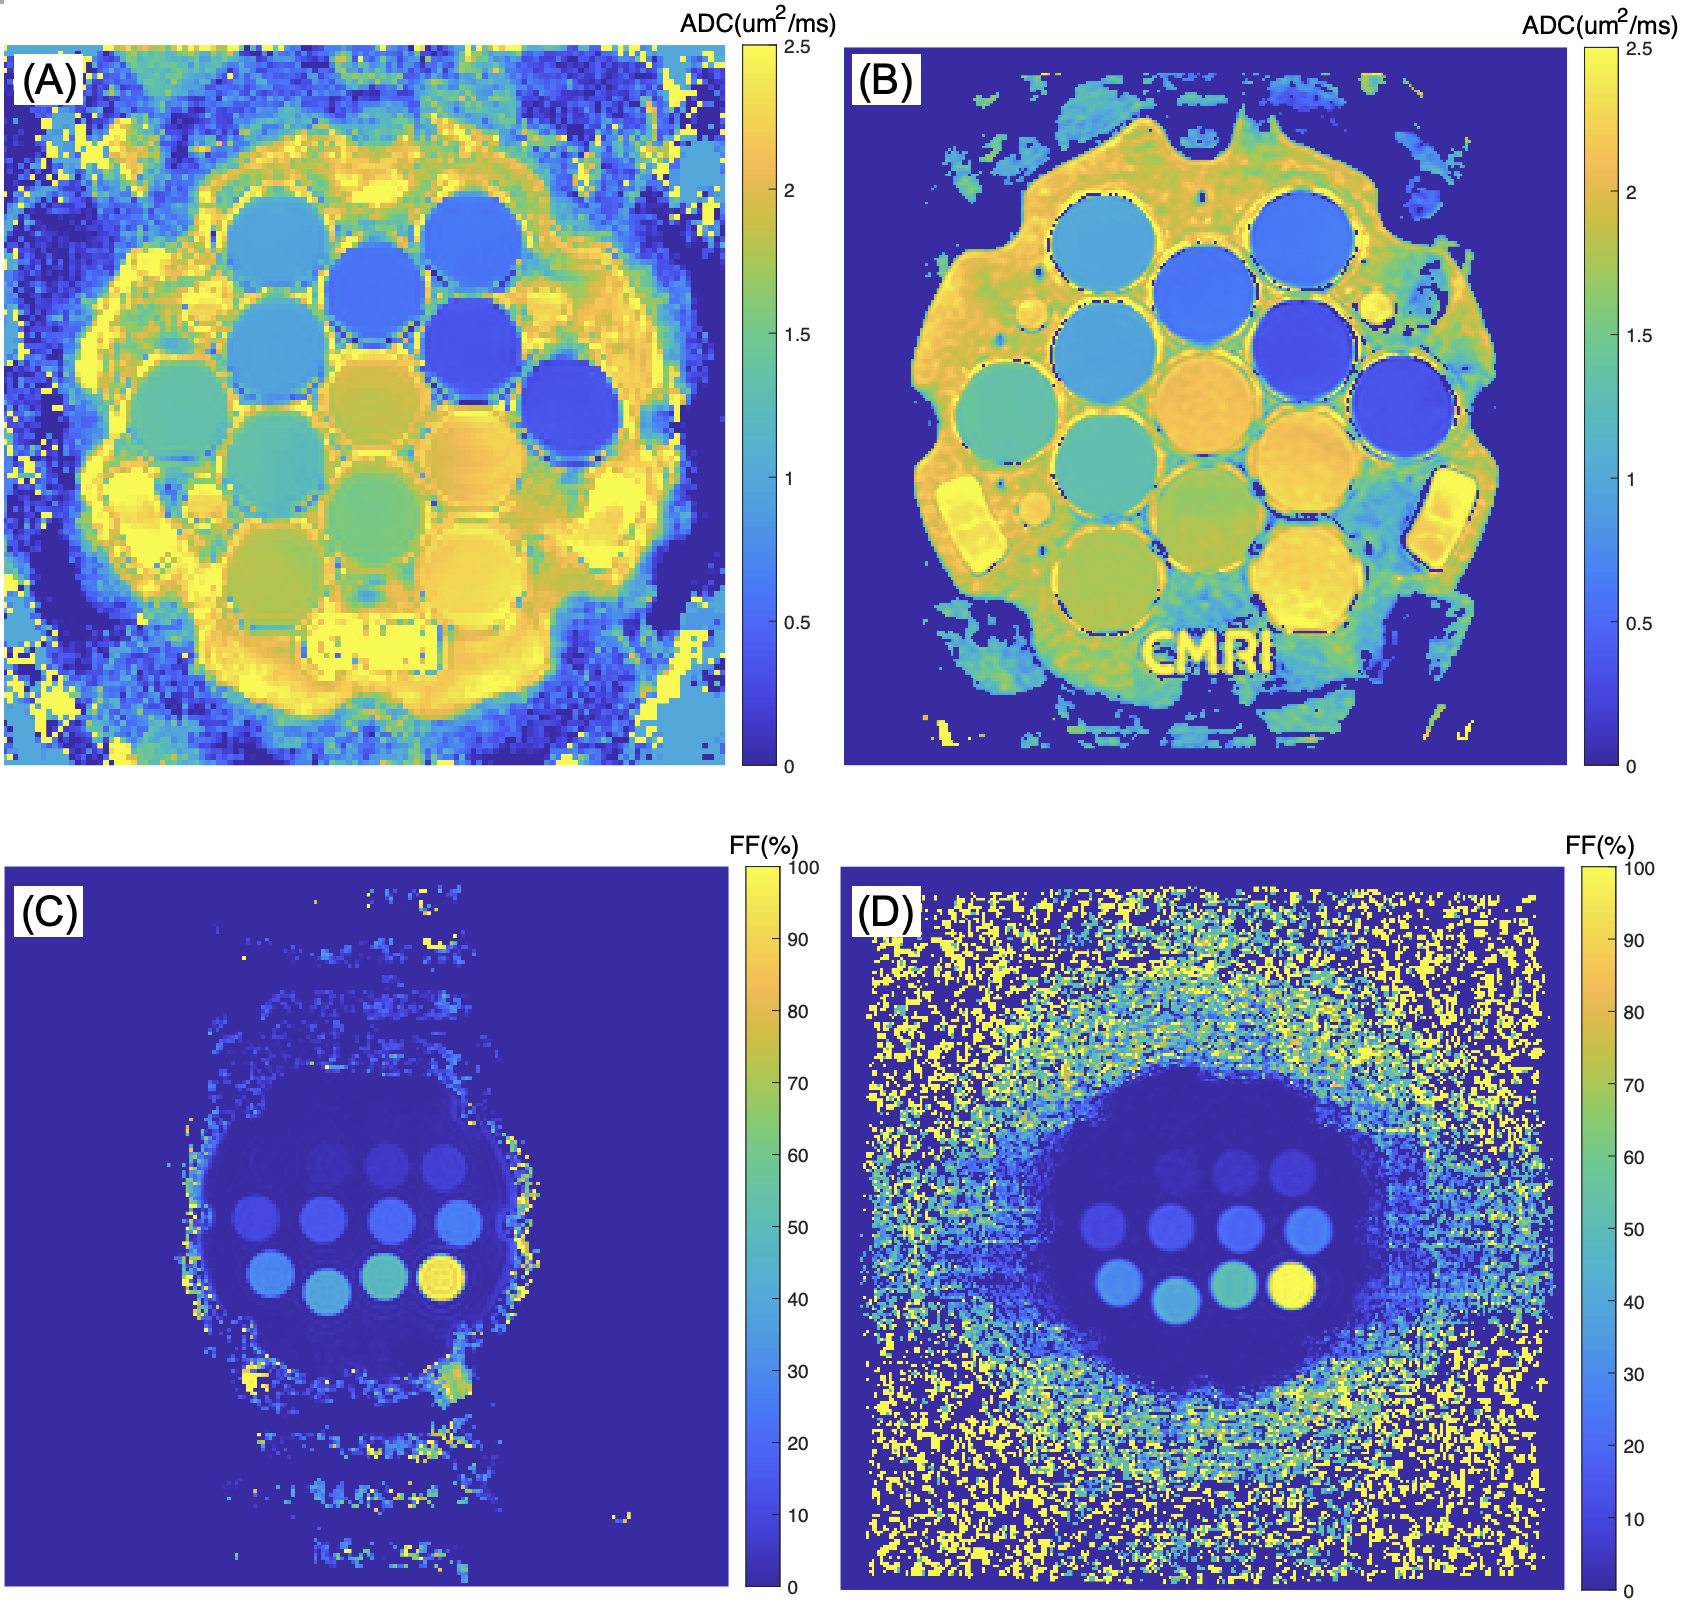
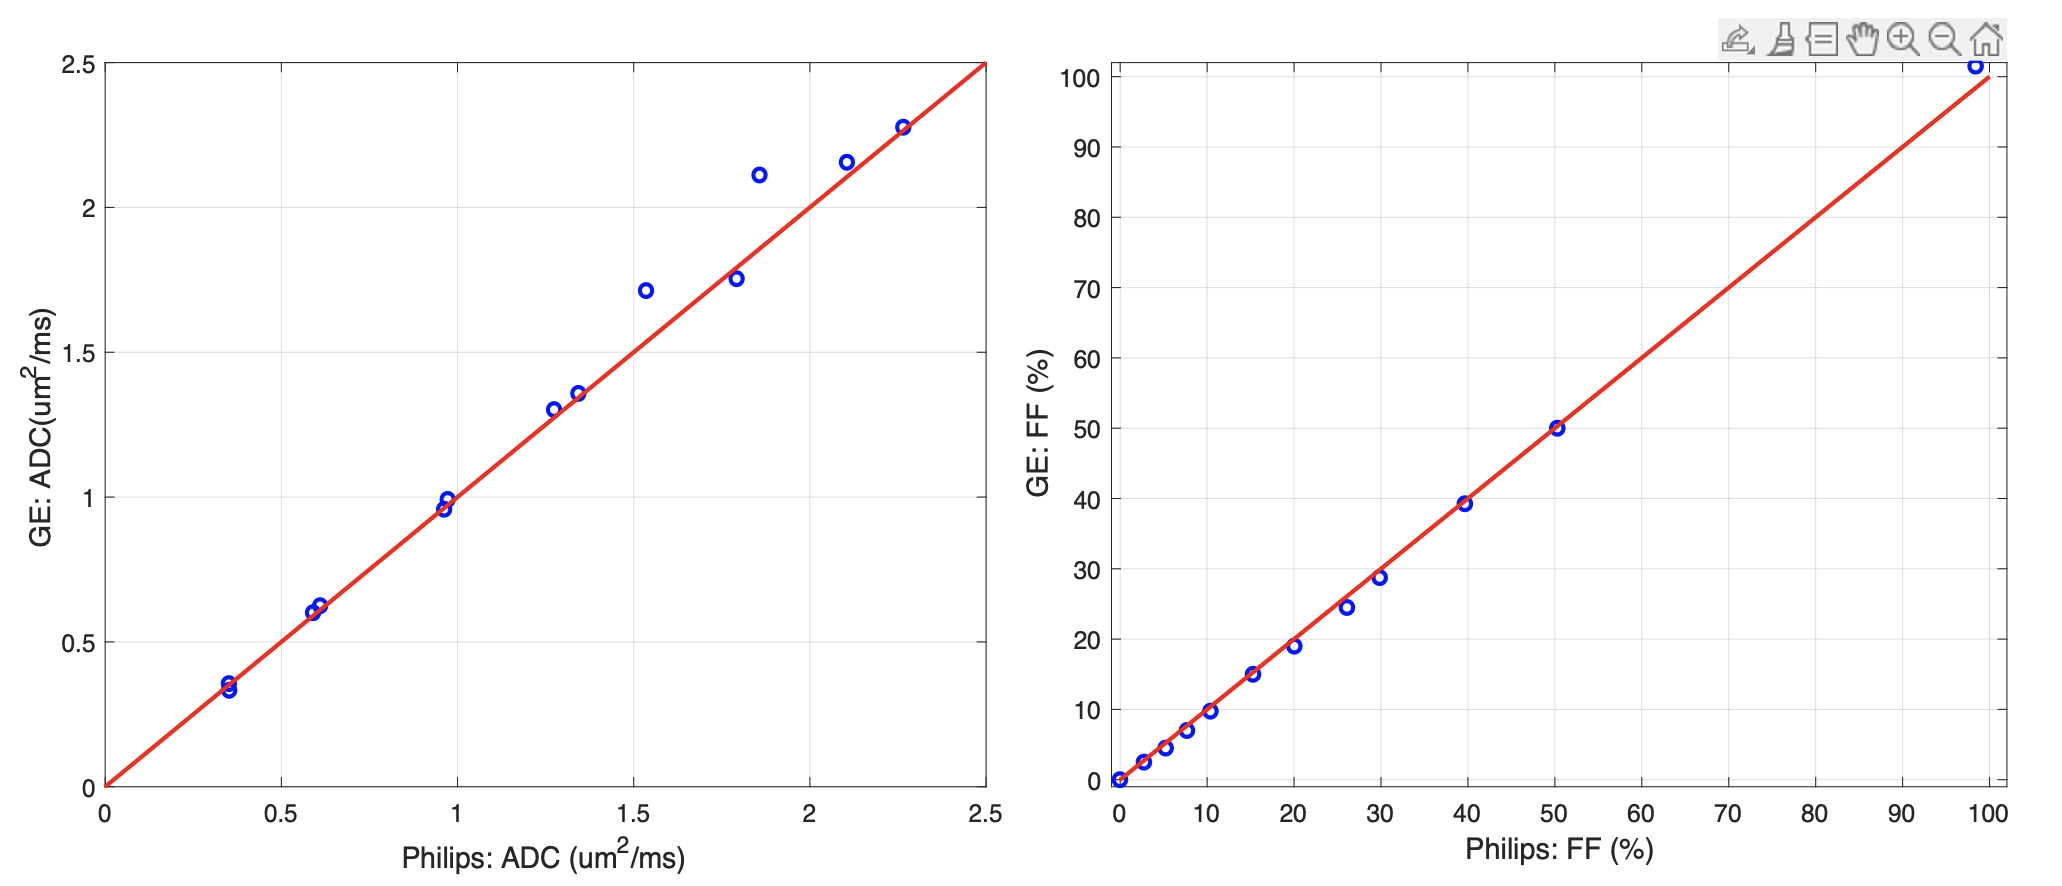
Fig. 2 shows the ADC maps and PDFF maps of the phantoms acquired on the two scanners. Tables 1 and 2 summarize the measured ADC and PDFF values and the phantom reference values. In addition, Fig. 3 shows the scatter plots of ADC and PDFF measured by the two MRI systems; the correlation coefficients (vendor vs. reference, and vendor vs. vendor) and RMSE (vendor vs. reference) were summarized in Table 3.DISCUSSION
DWI and PDFF offer quantitative assessment about tissue structure and composition, playing a crucial role in neuromuscular diseases (e.g., peripheral nerve trauma). As indicated by the correlation coefficient and RMSE, our results showed high reproducibility and high accuracy across two 3T MRI vendors using the system phantoms. The small difference in the measurement between the two scanners could be also attributed to the sequence difference as the parameters cannot be fully identical. Our results showed that quality assurance can be well maintained between the two MRI scanners, both DWI and PDFF measured on the two scanners at our institute are reliable and accurate, this has important implications for our future multi-site studies. Future work will focus on similar multi-vendor diffusion and PDFF studies in humans to further establish reproducibility.CONCLUSIONS
High reproducibility and high accuracy of DWI and PDFF are achieved on two MRI systems, which will provide quality assurance to ensure standardized DWI and PDFF in multi-site studies.Acknowledgements
The study was supported by the National Multiple Sclerosis Society (RG-2111-38720), DOD/PRMRP (PR211292), and Philips Healthcare.References
1. Beaulieu C. The basis of anisotropic water diffusion in the nervous system - a technical review. 2002; 15(7-8):435-55.
2. Baliyan V, Das C, Sharma R, et al. Diffusion weighted imaging: Technique and applications. World J Radiol. 2016; 8(9): 785–798.
3. Manzanera Esteve IV. Probabilistic Assessment of Nerve Regeneration with Diffusion MRI in Rat Models of Peripheral Nerve Trauma. Sci Rep. 2019; 9(1):19686.
4. Bray T, Chouhan M, Punwani S, et al. Fat fraction mapping using magnetic resonance imaging: insight into pathophysiology. Br J Radiol. 2018; 91(1089): 20170344.
5. Hu. H, Yokoo T, Bashir M, et al. Linearity and Bias of Proton Density Fat Fraction as a Quantitative Imaging Biomarker: A Multicenter, Multiplatform, Multivendor Phantom Study. Radiology. 2021; 298(3):640-651.
6. Morrow J, Evans M, Grider T, et al. Validation of MRC Centre MRI calf muscle fat fraction protocol as an outcome measure in CMT1A. Neurology. 2018; 91(12):e1125-e1129.
7. Naarding K, Reyngoudt H, van Zwet E et al. MRI vastus lateralis fat fraction predicts loss of ambulation in Duchenne muscular dystrophy. 2020; 94(13):e1386-e1394.
Figures