3011
RIMLA: Reproducibility-Informed Method for Longitudinal Assessment1Advanced Clinical Imaging Technology, Siemens Healthineers International AG, Lausanne, Geneva and Zurich, Switzerland, 2Department of Radiology, Lausanne University Hospital and University of Lausanne, Lausanne, Switzerland, 3LTS5, Ecole Polytechnique Fédérale de Lausanne, Lausanne, Switzerland, 4Department of Neurology and Center of Clinical Neuroscience, First Faculty of Medicine, Charles University and General University of Prague, Prague, Czech Republic, 5CIBM Centre for Biomedical Imaging, Geneva, Switzerland, 6Swiss Centre for Musculoskeletal Imaging (SCMI), Balgrist Campus, Zurich, Switzerland, 7Department of Radiology, First Faculty of Medicine, Charles University and General University of Prague, Prague, Czech Republic
Synopsis
Keywords: Data Processing, Reproductive, longitudinal analyses; quantitative biomarkers
Motivation: Estimating longitudinal changes in imaging biomarkers is challenging due to the multiple sources of variation during acquisition that can influence the analysis of MRI data.
Goal(s): To provide a robust estimate of longitudinal changes based on the comparison of cross-sectional imaging biomarkers from different time points.
Approach: We introduce RIMLA, a Reproducibility-Informed Method for Longitudinal Assessment that quantifies longitudinal imaging biomarker changes while accounting for the robustness of the underlying image processing algorithm.
Results: As a first application, we show that RIMLA allows to identify multiple sclerosis lesion subtypes characterized by statistically significant enlargement or shrinkage over time.
Impact: The here introduced Reproducibility-Informed Method for Longitudinal Assessment (RIMLA) allows to robustly detect small longitudinal changes in quantitative biomarkers. This increase in sensitivity can lead to better informed clinical decisions, for example during treatment monitoring or disease progression follow-ups.
Introduction
The extraction of quantitative imaging biomarkers typically suffers from limited reproducibility due to the multiple sources of variation characterizing the acquisition of MR images. This affects longitudinal analyses of imaging biomarkers based on pure cross-sectional measurements. The resulting lack of robustness is a crucial hindrance for the clinical adoption of automated biomarker extraction tools for individual patient monitoring.For example, in multiple sclerosis (MS), increasing interest is being given to the detection of slowly enlarging lesions, whose presence seems to indicate a continuous disease progression1–3. However, longitudinal volumetric changes in MS lesions are typically subtle and their detection challenging4.
Here, we propose a Reproducibility-Informed Method for Longitudinal Assessment (RIMLA) that allows to robustly estimate longitudinal volumetric changes while accounting for the reproducibility characteristics of the underlying processing algorithm. As a first example application, we use RIMLA for a longitudinal lesion monitoring task in an MS cohort.
Methods
Study population, MR protocol and pre-processingTwenty-five MS patients were recruited in a scan-rescan experimental setup5, where they underwent four MRI examinations on two different days, in 3T scanners (a pair among a MAGNETOM Skyra, Prismafit and Verio, all Siemens Healthcare, Erlangen, Germany). Additionally, 283 MS patients (detailed demographics in Table 1) were scanned at 3T (MAGNETOM Skyra, Siemens Healthcare, Erlangen, Germany) every six months for up to four years (relevant sequence parameters in Table 2).
MS lesions were segmented at all time points with a fully automated white matter hyperintensities segmentation6,7 AI-Rad Companion Brain MR software, using both MP-RAGE and FLAIR images as input. The last scan was used as reference for lesion tracking8.
RIMLA
The reproducibility of the lesion segmentation algorithm was first assessed on the individual lesion level using the scan-rescan dataset. To this end, we estimated individual lesion volumes across scans and computed the coefficient of variation (COV) between these measurements for each lesion that was detected across the four scans with volumes in the range of 3 to 150μL. The average COV ($$$\overline{COV}$$$) estimated across all lesion volumes was retained as a proxy for the reproducibility of the segmentation.
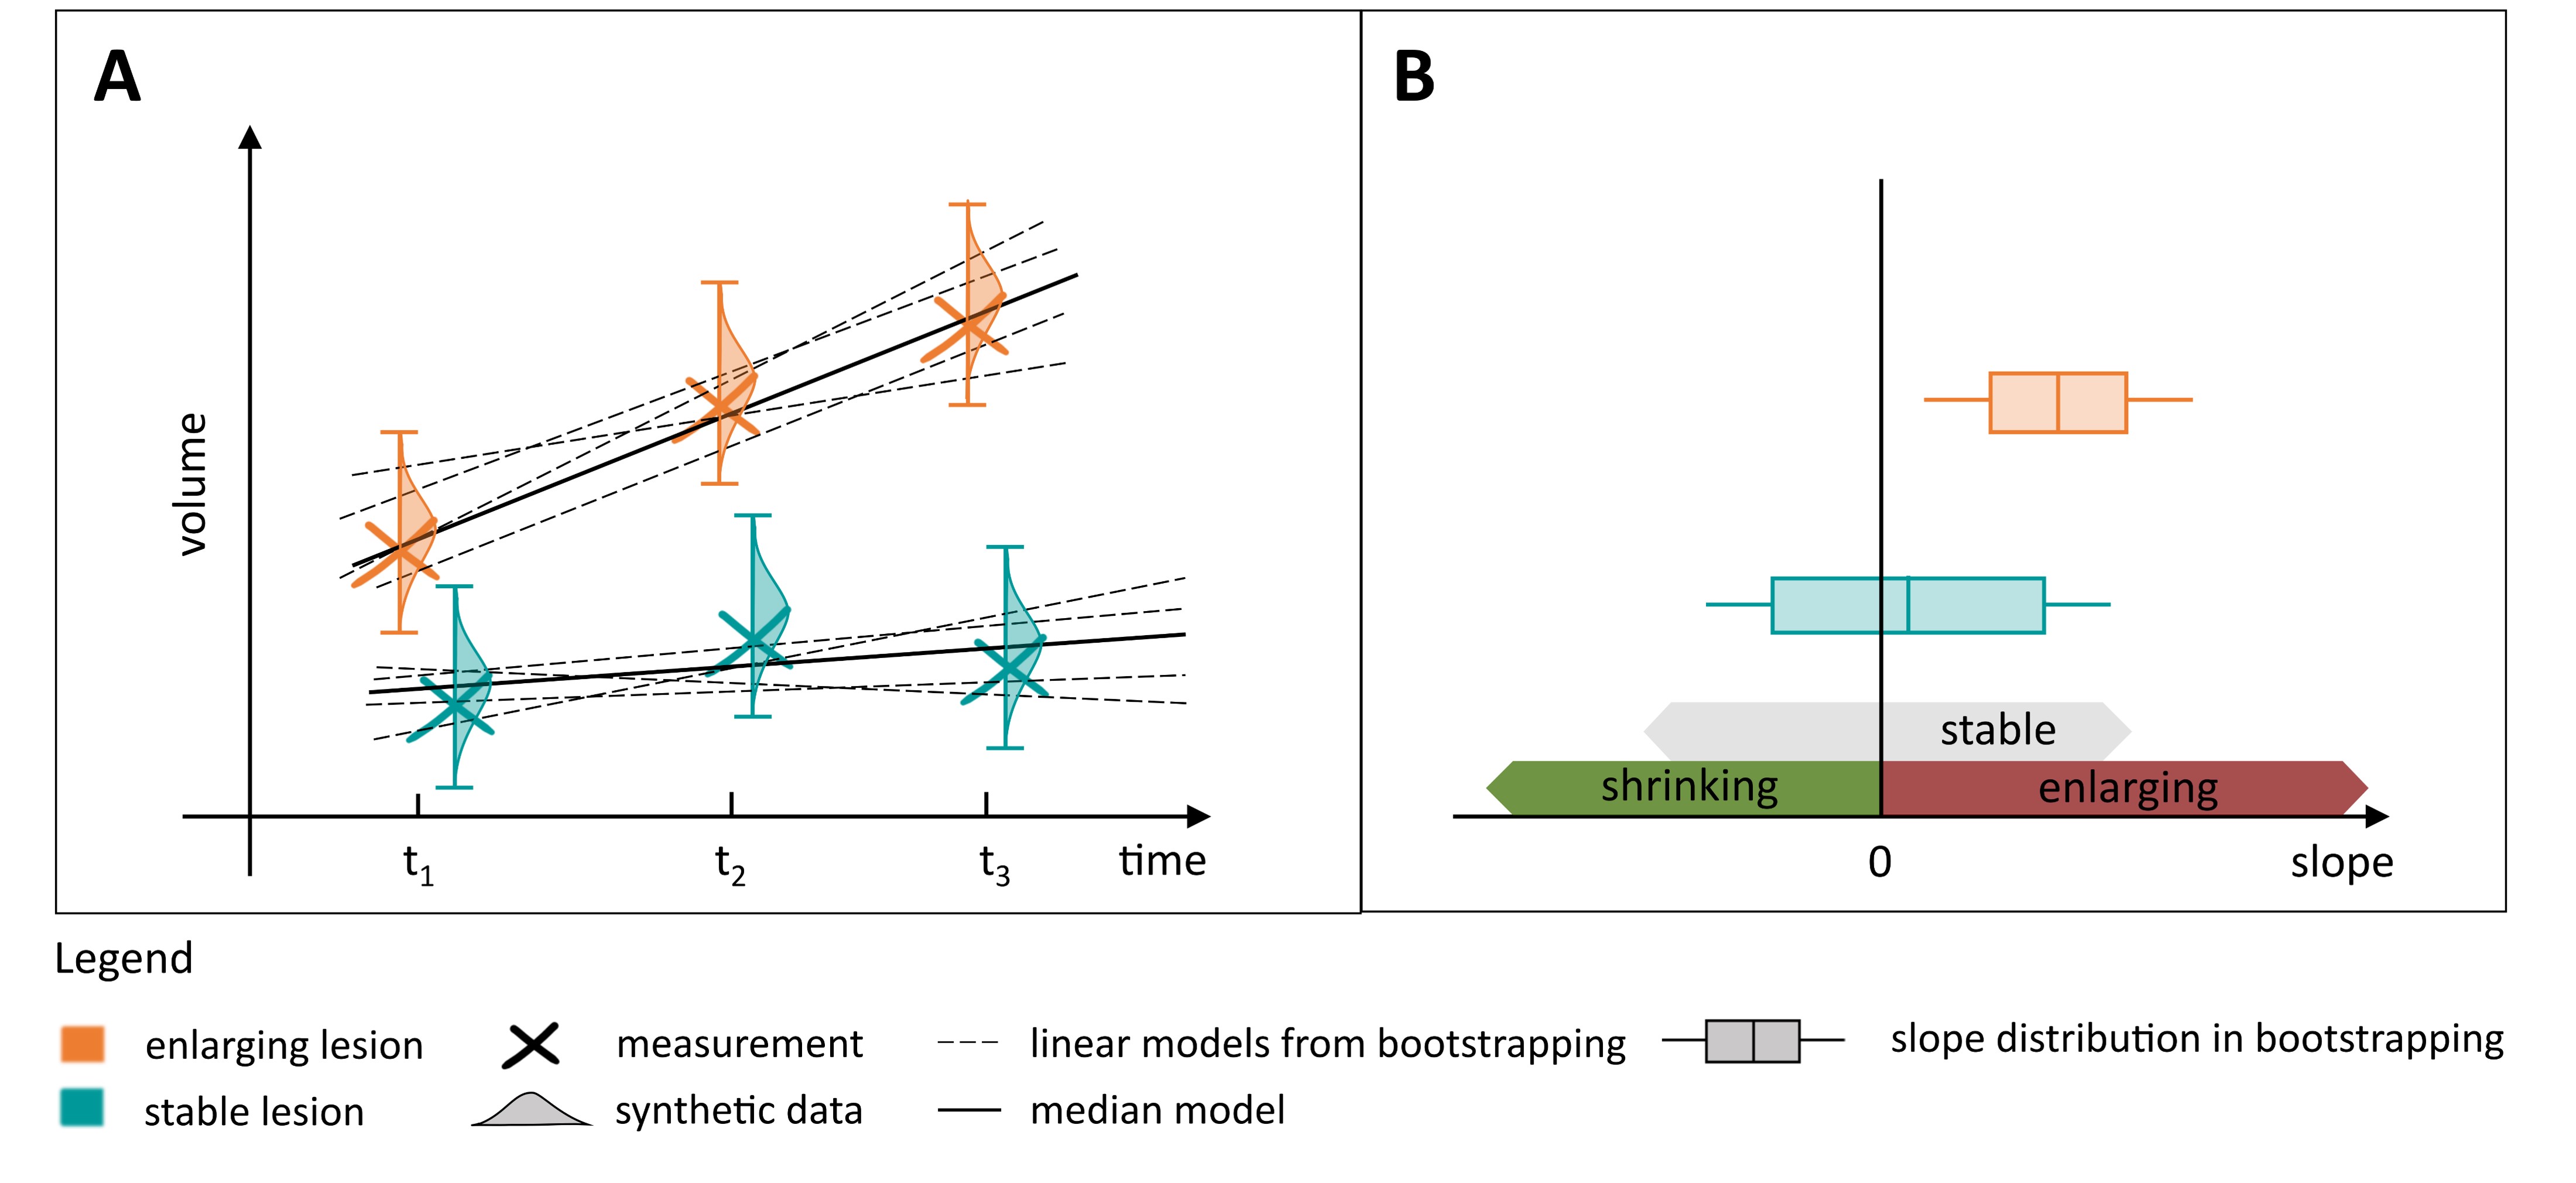
To model the variability due to changes in the volumetric estimation of each lesion $$$i$$$, 100 synthetic volume values $$$v'_i(t)$$$ were generated following a normal distribution with mean and standard deviation given by each cross-sectional volume measurement $$$v_i(t)$$$, and $$$\overline{COV}*v_i(t)$$$, respectively. Then, for each lesion, the coefficients of a linear regression model were estimated 100 times using bootstrapping, by randomly sampling one observation from the generated synthetic data at each timepoint (Figure 1A) such that:
$$
\hat{v}_i(t)=β_i^0 + β_i^1*t+ε
$$
with $$$β_i^1$$$ representing the estimated lesion volumetric change over time, $$$β_i^0$$$ the intercept and $$$ε$$$ the residual error.
The median $$$β_i^1$$$ value across bootstrapping samples represented a robust measure of lesion volumetric change over time. To identify statistically significant enlargement and shrinkage over time, an associated bootstrap p-value was tested against the null hypothesis:
$$
H_0:β_i^1=0.
$$
Lesions whose slope was estimated as positive or negative in at least 95% of the bootstrapping samples were defined to be significantly enlarging (shrinking if negative), while the others were labelled as stable (Figure 1B). Lesions that were only detected in the last time point were labelled as new.
Results
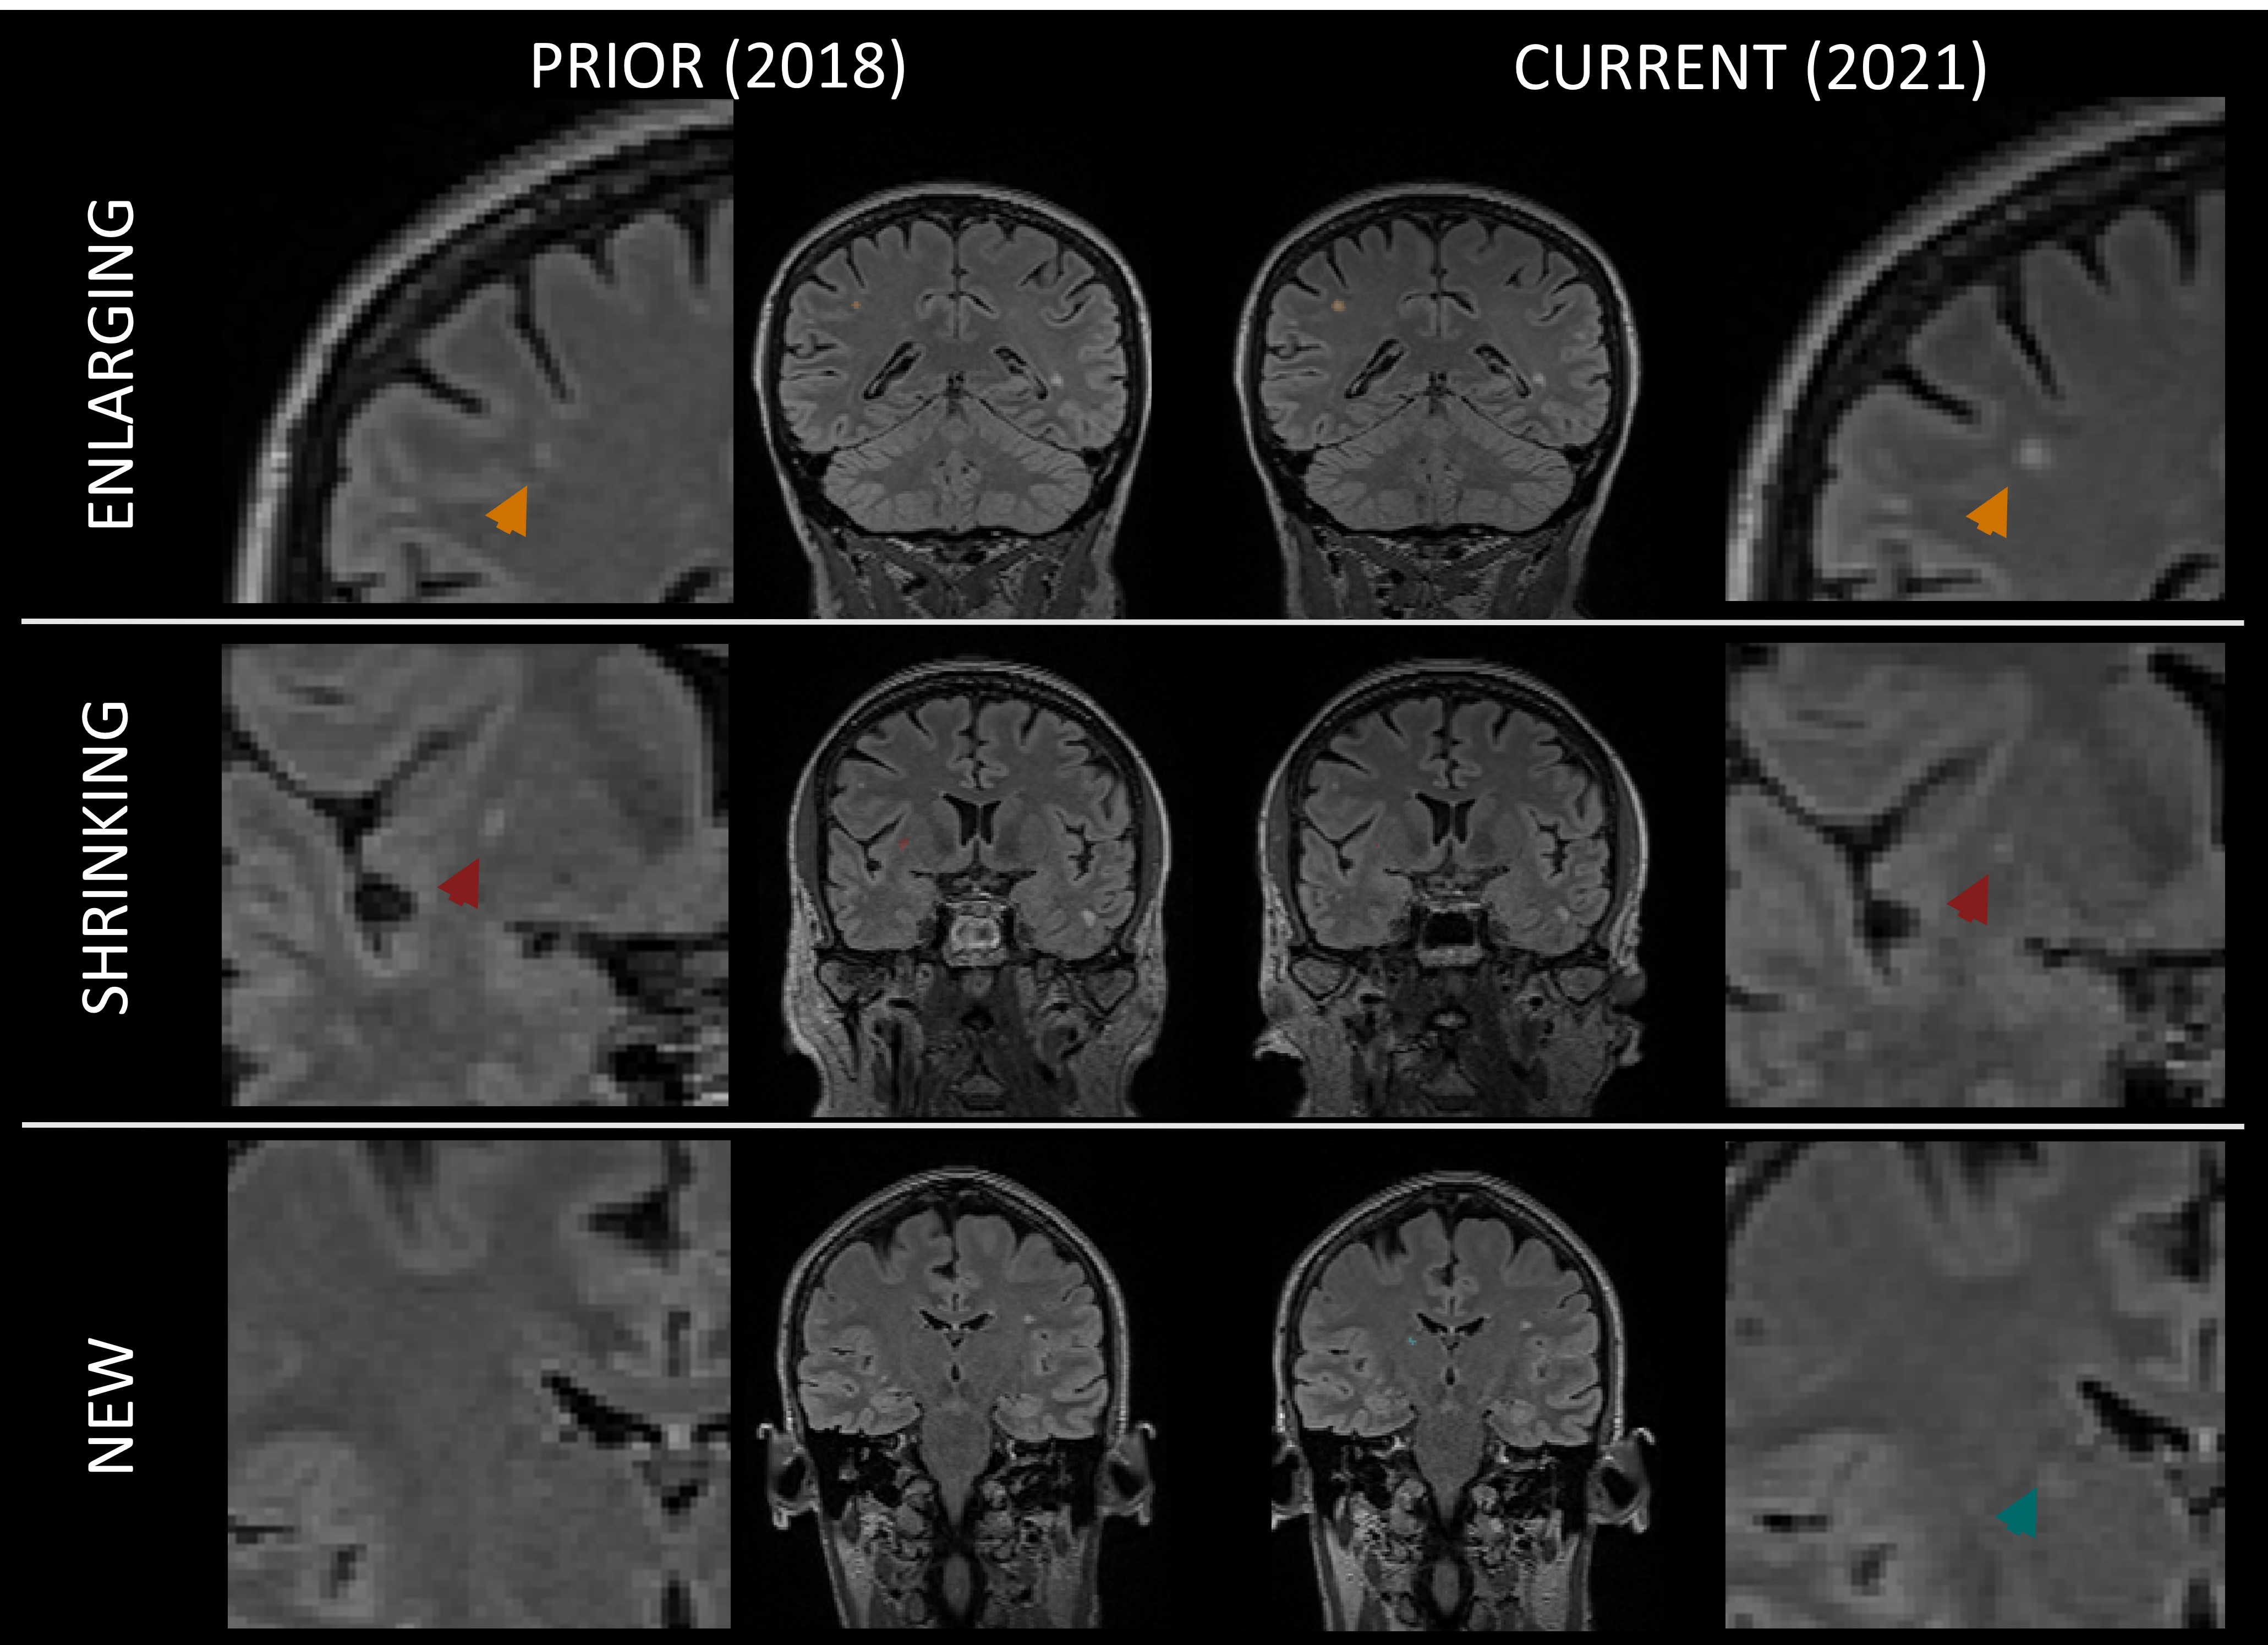
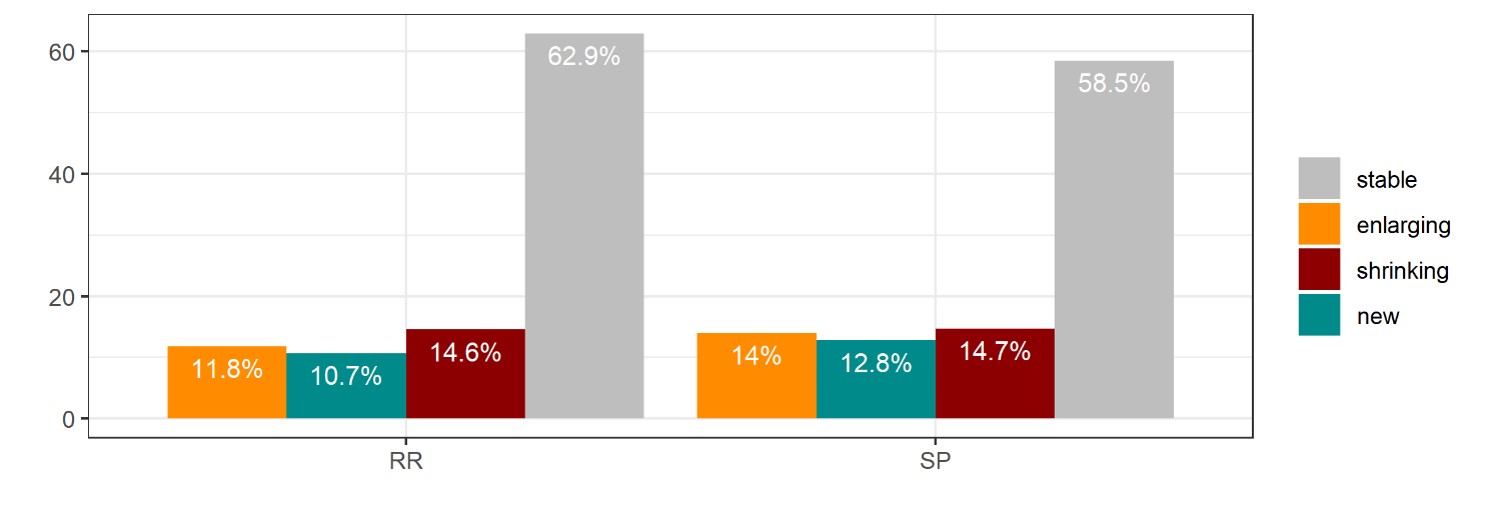
The reproducibility analysis of the volumetric assessment was performed on 551 lesions detected in the scan-rescan cohort, and the $$$\overline{COV}$$$ was found to be 0.17 (median=0.12, IQR=0.16). Figure 2 shows the longitudinal evolution of enlarging, shrinking and new lesions in an example patient over three years.The prevalence of each lesion class did not differ between relapsing-remitting and progressive patients when compared using the Wilcoxon’s test (new: W=3206, enlarging: W=3316, shrinking: W=3662, stable: W=4546, all with p>0.05) (see Figure 3). On average, stable lesions were the most prevalent in MS patients (62.4±24.2%) and lesions classified as new were the least frequent (10.9±16.6%). Enlarging (12.1±17.7%) and shrinking (14.6±16.8%) lesions showed a comparable prevalence.
Discussion and Conclusion
We introduced RIMLA, a fully automated reproducibility-informed longitudinal assessment framework that allows to robustly estimate longitudinal changes of quantitative imaging biomarkers over time, while accounting for the variability of the underlying processing pipeline. In the present work, we tested RIMLA in a MS lesion monitoring task, and showed that it allowed to identify lesion classes with distinct longitudinal phenotypes that are clinically relevant for predicting disability progression2,3,9.RIMLA is not restricted to volumetry of MS lesions, but a general method for providing statistically validated and robust estimates of longitudinal changes for imaging biomarkers evaluated cross-sectionally. Future work should thus extend the use of RIMLA to other processing methods and imaging biomarkers.
Acknowledgements
The project has received funding by Roche (Healthy controls) - clinical trial NTC03706118, Biogen (scan-rescan dataset) – clinical trial NCT04123353, Czech Ministry of Health project - grants NU 22-04-00193 and institutional support of the hospital research RVO VFN 64165, and Czech Ministry of Education- project Cooperation LF1, research area Neuroscience.
References
1. Calvi A, Haider L, Prados F, Tur C, Chard D, Barkhof F. In vivo imaging of chronic active lesions in multiple sclerosis. Mult Scler J. 2022;28(5):683-690. doi:10.1177/1352458520958589
2. Calvi A, Carrasco FP, Tur C, et al. Association of Slowly Expanding Lesions on MRI With Disability in People With Secondary Progressive Multiple Sclerosis. Neurology. 2022;98(17):E1783-E1793. doi:10.1212/WNL.0000000000200144
3. Absinta M, Sati P, Masuzzo F, et al. Association of Chronic Active Multiple Sclerosis Lesions with Disability in Vivo. JAMA Neurol. 2019;76(12):1474-1483. doi:10.1001/jamaneurol.2019.2399
4. Carass A, Roy S, Jog A, et al. Longitudinal multiple sclerosis lesion segmentation: Resource and challenge. Neuroimage. 2017;148(August 2016):77-102. doi:10.1016/j.neuroimage.2016.12.064
5. Tsang A, Wager C, Corredor-Jerez R, et al. Comparison of Techniques for Measurement of Brain Volume in Multiple Sclerosis Patients. Neurol (Conference Abstr. 2018;90(15 Supplement):P3.354. https://n.neurology.org/content/90/15_Supplement/P3.354.
6. Fartaria MJ, Todea A, Kober T, et al. Partial volume-aware assessment of multiple sclerosis lesions. NeuroImage Clin. 2018;18(January):245-253. doi:10.1016/j.nicl.2018.01.011
7. Fartaria MJ, Bonnier G, Roche A, et al. Automated detection of white matter and cortical lesions in early stages of multiple sclerosis. J Magn Reson Imaging. 2016;43(6):1445-1454. doi:10.1002/jmri.25095
8. Fartaria MJ, Kober T, Granziera C, Bach Cuadra M. Longitudinal analysis of white matter and cortical lesions in multiple sclerosis. NeuroImage Clin. 2019;23(July):101938. doi:10.1016/j.nicl.2019.101938
9. Zivadinov R, Bergsland N, Dwyer MG. Atrophied brain lesion volume, a magnetic resonance imaging biomarker for monitoring neurodegenerative changes in multiple sclerosis. Quant Imaging Med Surg. 2018;8(10):979-983. doi:10.21037/qims.2018.11.01
Figures
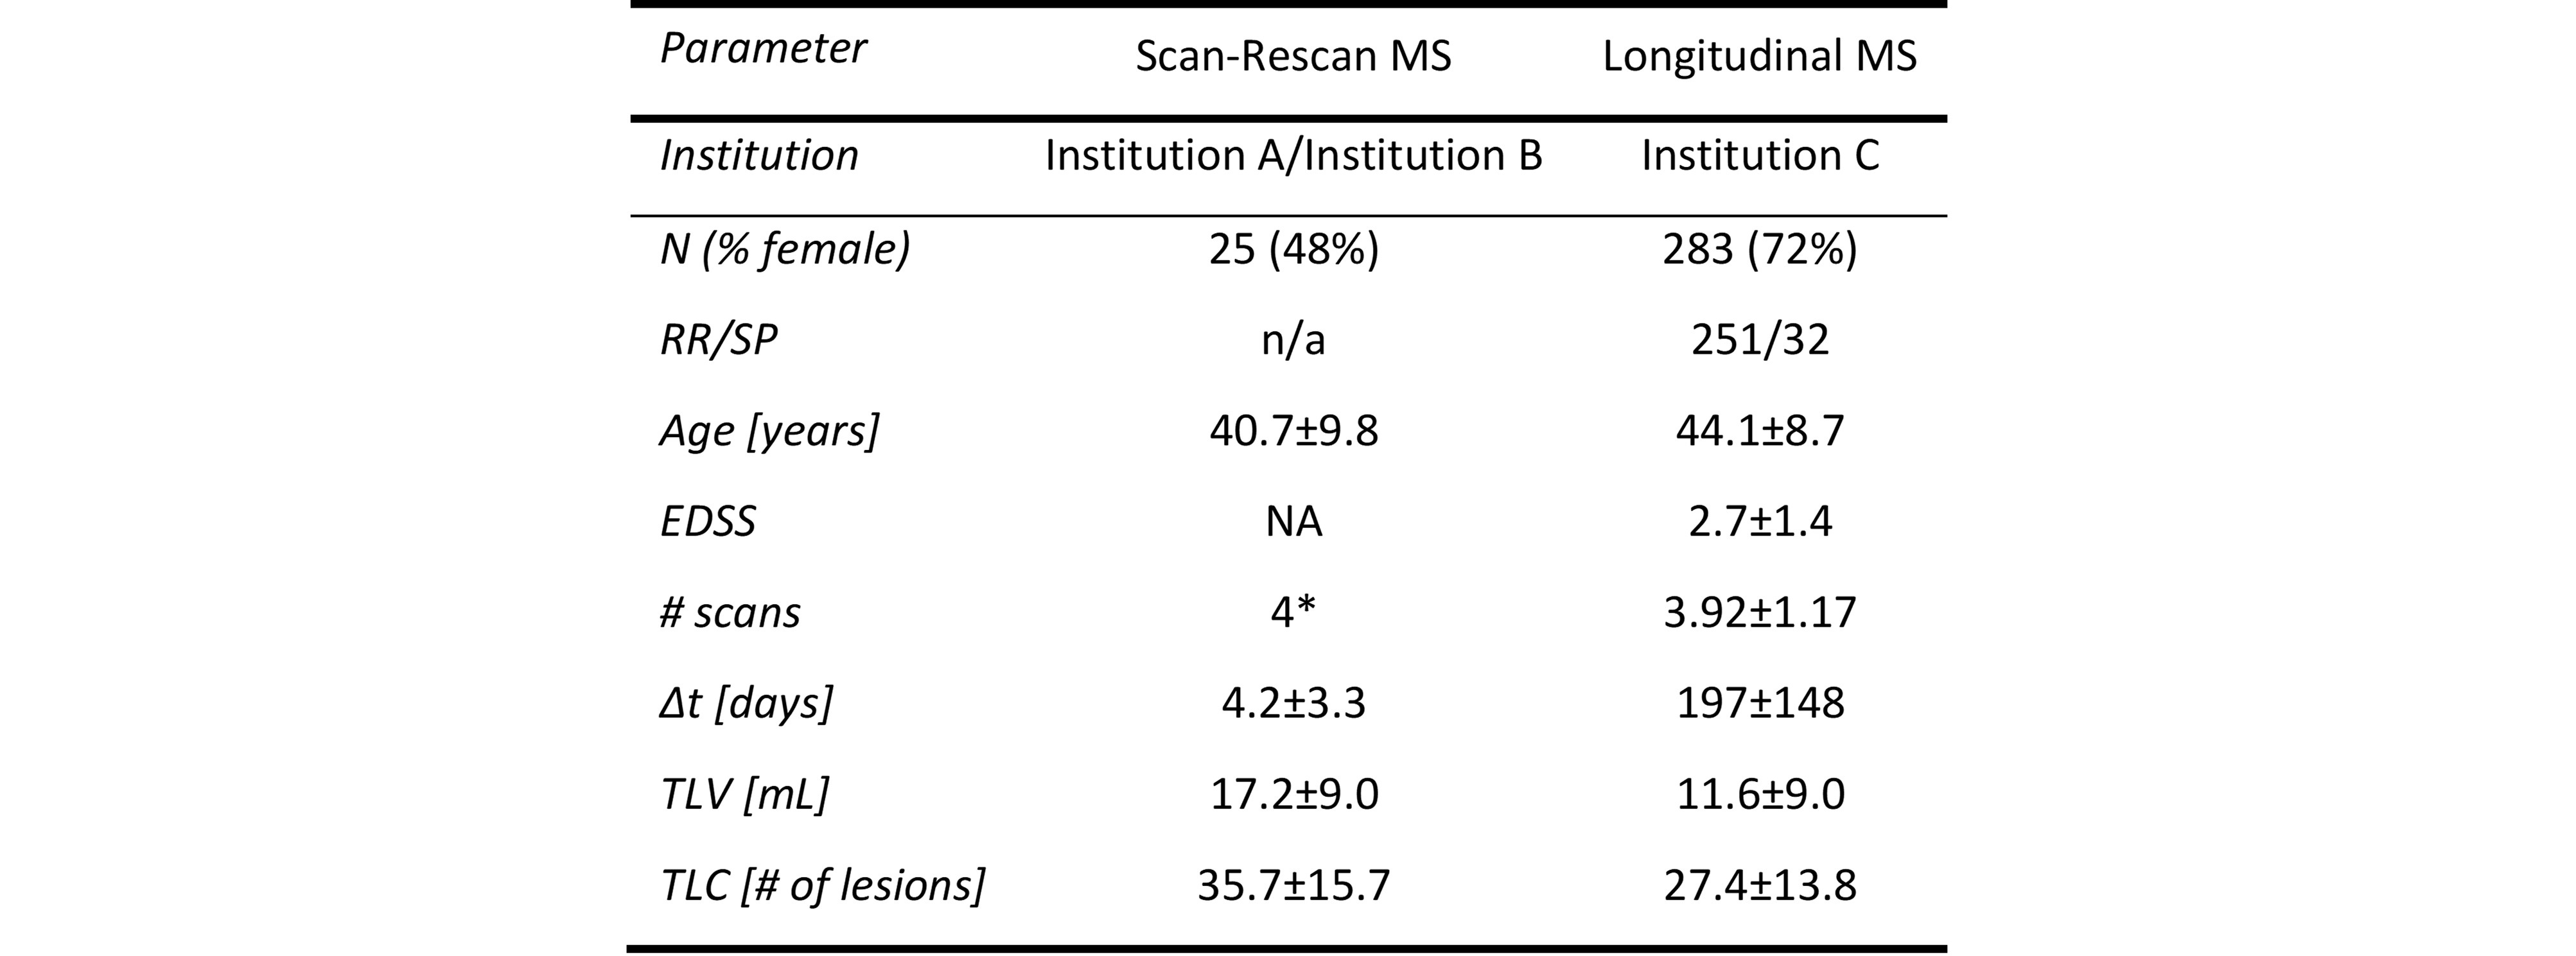
Table 1. Demographics and disease characteristics of multiple sclerosis (MS) cohorts. Values are provided as average ± standard deviation.
Abbreviations: RR: relapsing-remitting, SP: secondary progressive, EDSS: Expanded Disease Disability Scale, ΔEDSS: EDSS change in two years, Δt: time elapsed between MRI examinations, TLV: Total Lesion Volume, TLC: Total Lesion Count. *: two scans per day.
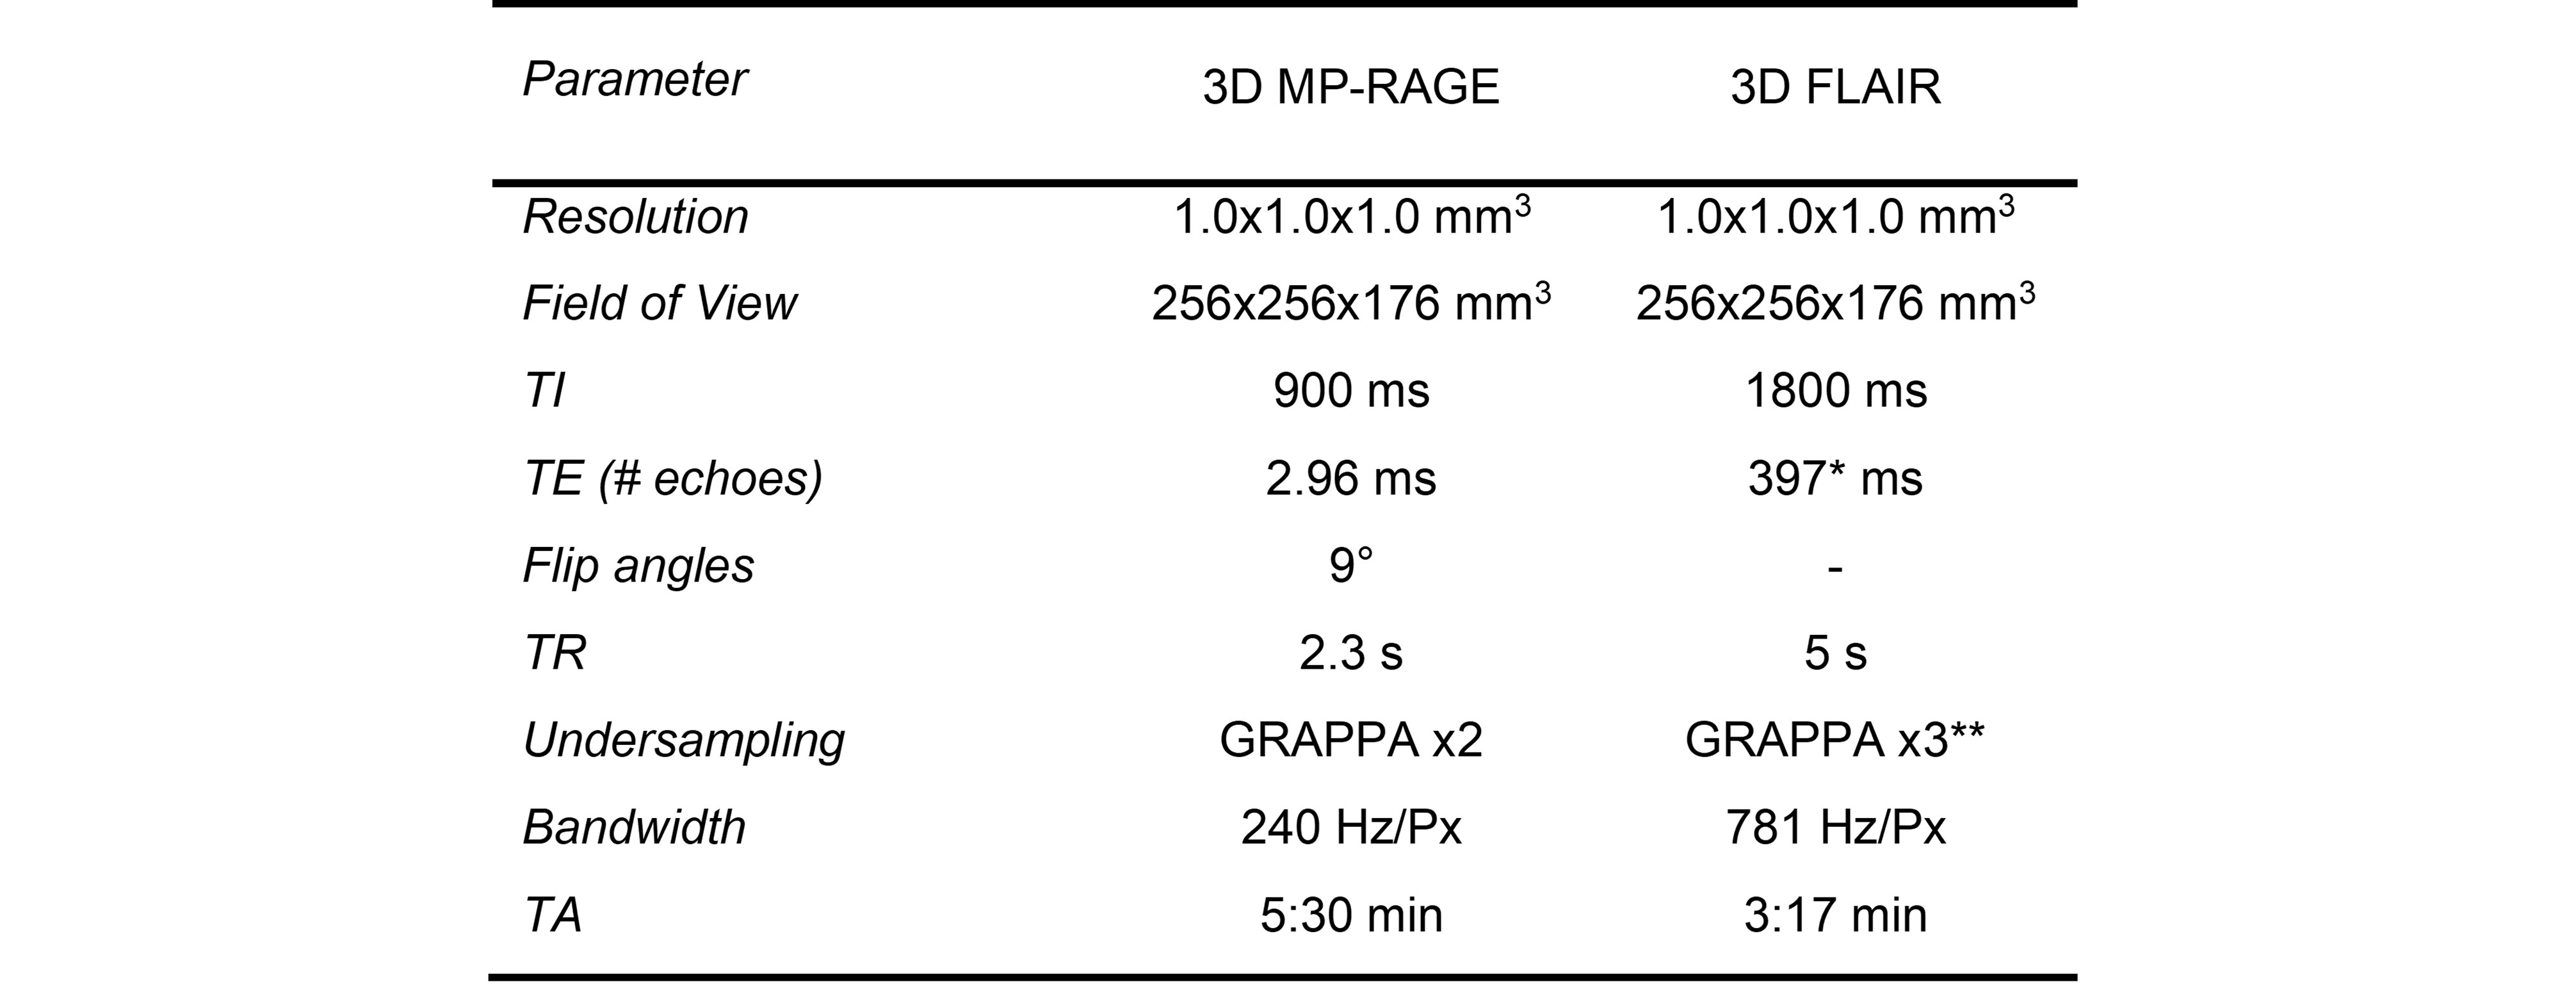
Table 2. MRI protocol acquisition parameters.
Abbreviations: MP-RAGE: Magnetization-prepared rapid gradient echo, FLAIR: fluid-attenuated inversion recovery, MP2RAGE: magnetization-prepared 2 rapid gradient echo, TA: acquisition time, TI: inversion time, TE: echo time, GRAPPA: generalized auto-calibrating partially parallel acquisitions.
*: 392 ms for the scan rescan dataset, **: GRAPPA x2 for the scan rescan dataset