3010
Image processing techniques used in satellite imaging can improve change detection on longitudinal MRI scans1Bernard and Irene Schwartz Center for Biomedical Imaging, Department of Radiology, New York University Grossman School of Medicine, New York, NY, United States, 2Center for Advanced Imaging Innovation and Research (CAI2R), Department of Radiology, New York University Grossman School of Medicine, New York, NY, United States, 3Vilcek Institute of Graduate Biomedical Sciences, New York University Grossman School of Medicine, New York, NY, United States, 4Department of Electrical Engineering and Information Technology, University of Napoli Federico II, Napoli, Italy
Synopsis
Keywords: Visualization, Tumor
Motivation: Change mapping techniques used in satellite imaging could be used for visualizing changes in longitudinal MRI.
Goal(s): To generate change maps to highlight tumor margins in longitudinal MRI scans of patients with brain metastasis.
Approach: We used the NYUMets public dataset. We adapted the VALE method used in satellite imaging to generate change saliency maps for patients with small brain metastasis by performing spatial and intensity registration over longitudinal MRI data.
Results: The change mapping technique made small tumors visually obvious, enhanced visualization of change in tumors and edema over time, and showed tumor boundaries that were not visible on T1-post contrast images.
Impact: This work demonstrates that image processing techniques used in satellite imaging could be effectively used for tracking changes in longitudinal MRI. The proposed approach can lead to better treatment planning and patient progress monitoring due to its sensitivity to changes.
Introduction
Change mapping is a powerful technique used in satellite imaging to identify and track gradual and abrupt transformations on multiple satellite images taken over periods of months or years1,2. Applications include tracking land degradation, changes in water bodies, and urban expansion3. The aim of this work was to explore the cross-domain adaptability of the techniques used in satellite imaging change mapping to enable accurate tracking of longitudinal changes in brain MRI. We chose this application because (1) tracking of metastatic brain cancer over time remains a challenge in clinical care, (2) detecting and outlining brain metastases on MR images needs to be accurate for correct tumor resection margins, and (3) there is a need to separate tumor progression from treatment response for effective clinical care4.Methods
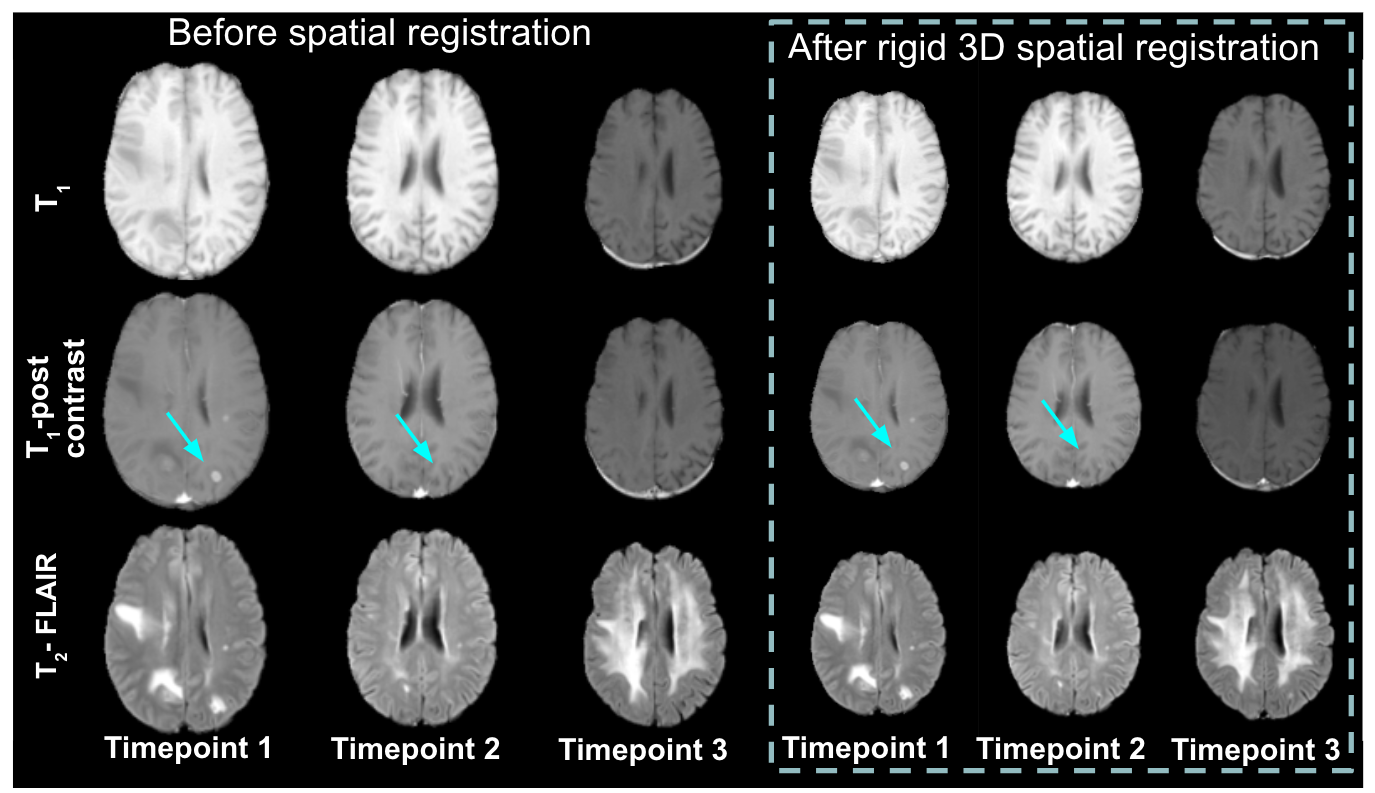
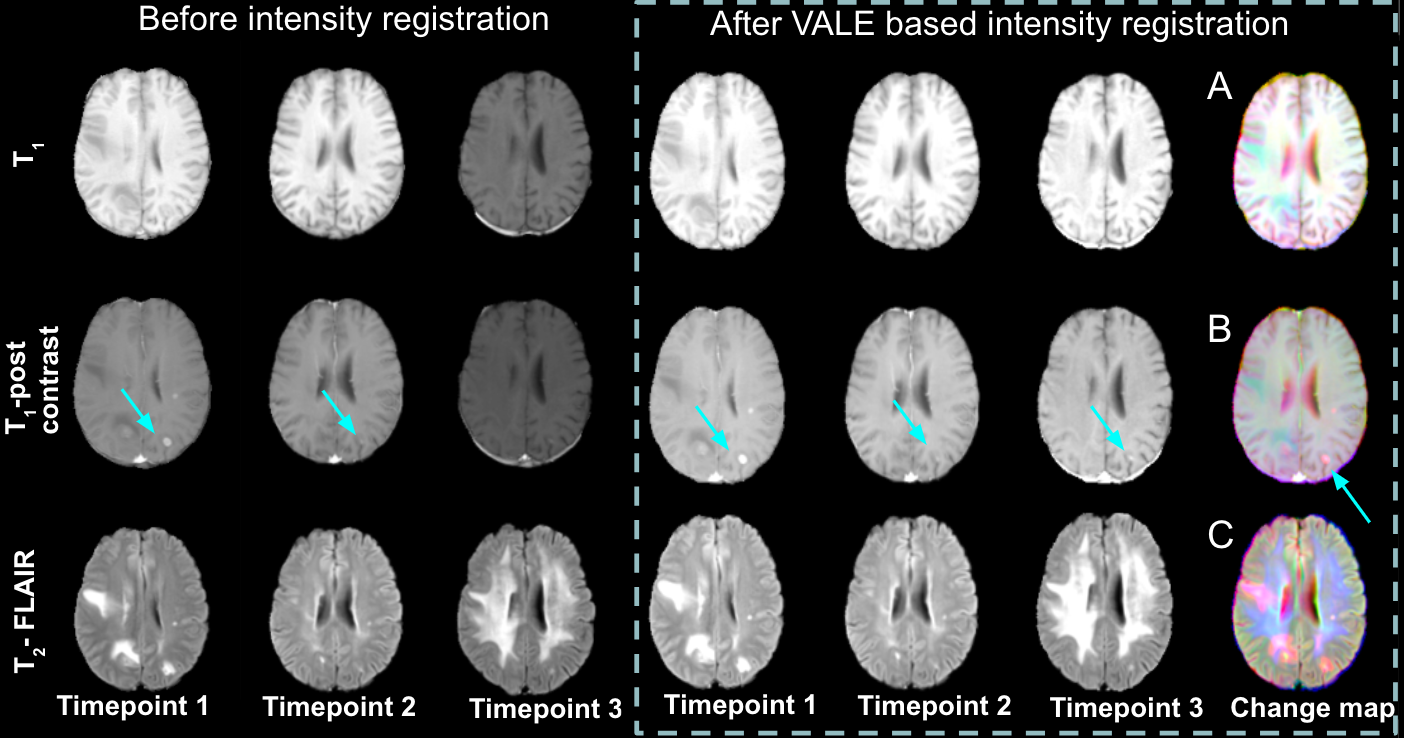
We used the NYUMets dataset, which is a collection of longitudinal brain MRI scans of clinical metastatic (Stage IV) cancer5. To our knowledge, this is the only publicly available dataset of brain metastasis patients. We explored the use of the VALE method6,7, which is based on processing a set of spatially, temporally and radiometrically comparable images to generate a color-coded change map. We adapted the VALE method to process the NYUMets dataset in order to visualize longitudinal changes, specially of small brain metastasis, which remain to be a challenge to track and delineate.For this feasibility study, we selected three timepoints per patients approximately 6 months apart. Four main steps were used: (1) spatial registration: a 3D rigid registration framework was used to register the T2-FLAIR, T1-post contrast and subsequent timepoints to the first timepoint of the T1 image; (2) mask extraction: the white matter mask was extracted in the first timepoint of the T1 images and applied to the spatially registered sequences and timepoints to scale the median intensities of the image across timepoints; (3) intensity registration: histogram clipping was performed as described in Ruello et al. The quantile values used were 90%, 80%, 80% for T1, T2- FLAIR and T1-post contrast sequences respectively; (4) the final change color map was generated by overlaying the first, second and third timepoints in the channel dimension (resulting size x, y, z, slices, 3). These four steps resulted in a set of spatially, temporally and pathologically comparable images.
Results
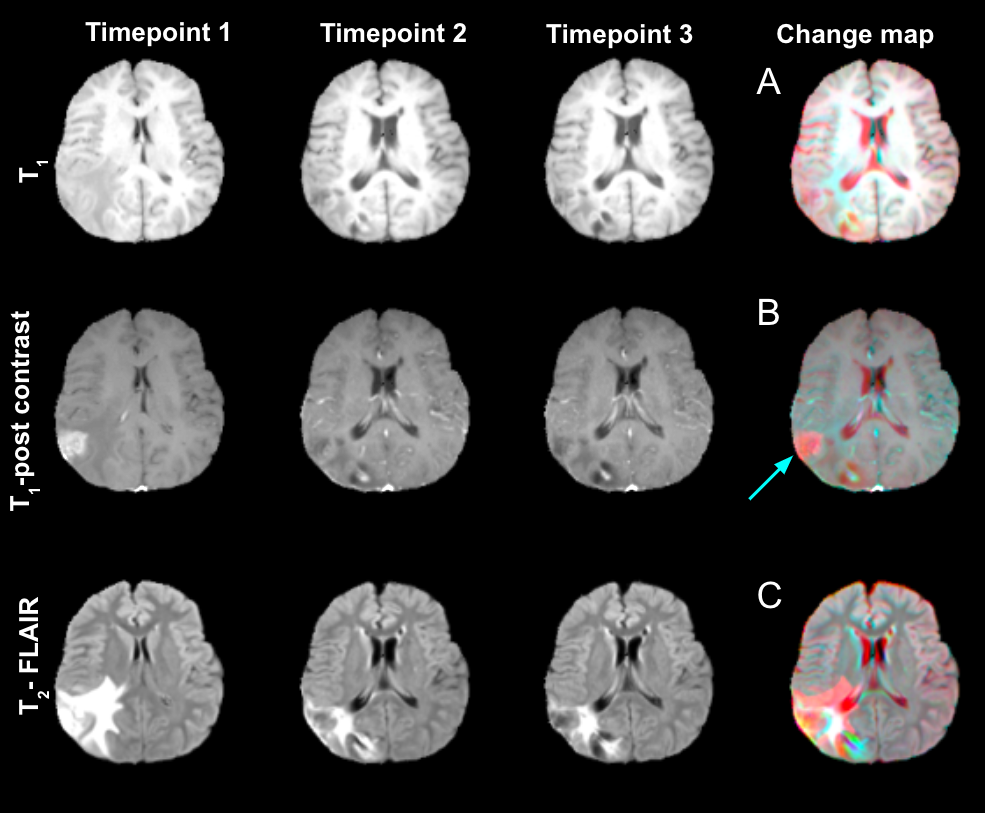
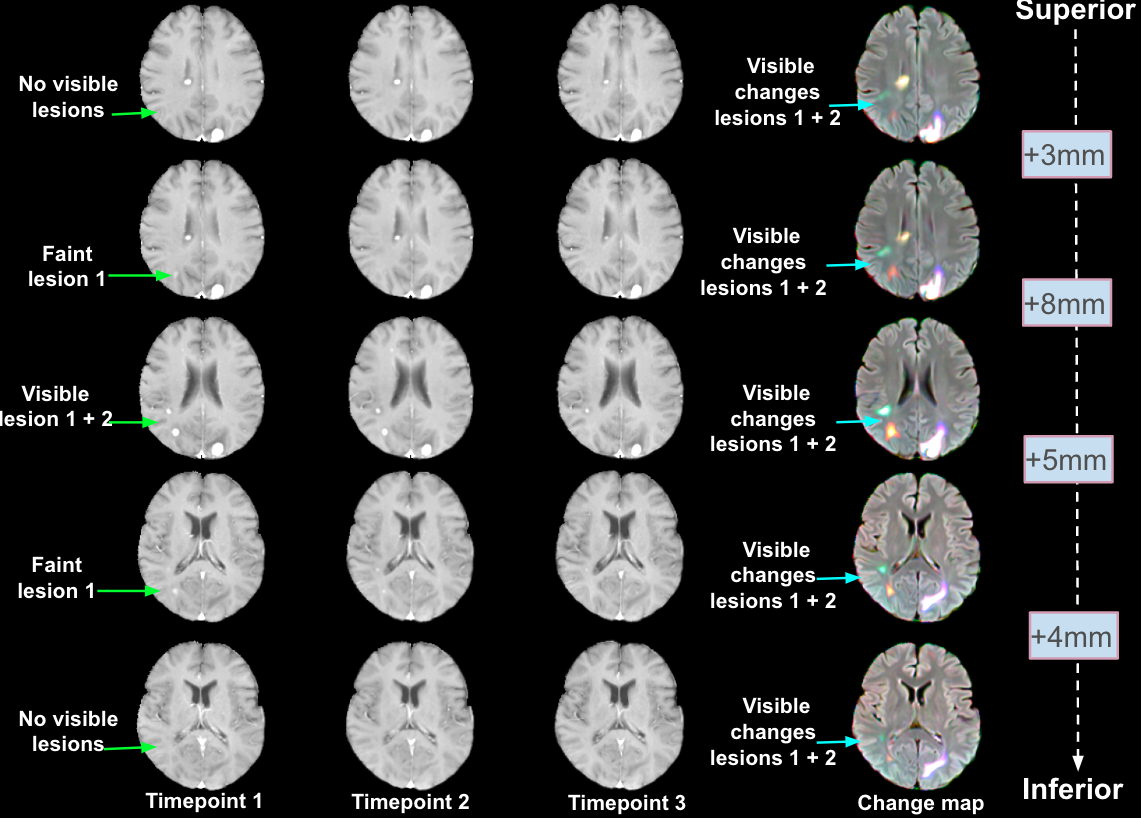
Figure 1 shows an example result of the 3D, rigid registration to the first timepoint of the T1 images. As indicated by the blue arrow, the registration allows accurate spatial tracking of an individual lesion over time. On the same patient and same slice, figure 2 shows the effect of intensity registration and the generated change maps. After performing the intensity registration, the blue arrows indicate the increased visibility of the lesion in timepoint 3 and subsequently its pink color in the change map, indicating the lesion was present in timepoint 1, shrinks in timepoint 2 and grows in timepoint 3. In figure 2C, a new edema appearing at timepoint 3 is easily seen as blue in the change map, and changes (pink) and stability (white) in local edema patterns are also visible. Similar results are seen in figure 3, the lesion indicated with the blue arrow is large and visible in the first timepoint but disappears over time. In figure 3C, the “red” edema is well situated around the tumor boundary. In figure 4, the sensitivity of the method to locate tumor margins, which are not visible on the post contrast images, is demonstrated. In particular, the change maps for certain brain slices showed tumor margins that were not visible in the T1- post contrast images.Discussion and Conclusion
In this study we have shown, for the first time, the cross-domain adaptation of change detection methods traditionally used in satellite imaging for visualizing longitudinal changes in MRI datasets. We found that change maps can make small brain tumors and metastasis more visually apparent. Moreover, they show associations between progression of edema and lesions in the same regions and make apparent tumor boundaries that are not obvious in the T1-post contrast images. The proposed approach could lead to better resection of tumors during gamma knife surgery, reducing the risk of tumor recurrence by minimizing the amount of cancerous cells left behind. Future work will include the use of these change maps as saliency maps in neural networks to test if patterns of local changes over time can predict patient treatment progression or response.Acknowledgements
This work was supported in part by NIH R01 EB024536 and was performed under the rubric of the Center for Advanced Imaging Innovation andResearch (CAI2R, www.cai2r.net), an NIBIB National Center for Biomedical Imaging and Bioengineering (NIH P41 EB017183)References
1 Cudahy, T. et al. Satellite-derived mineral mapping and monitoring of weathering, deposition and erosion. Scientific reports 6, 23702 (2016).
2 Amitrano, D. et al. Sentinel-1 for monitoring reservoirs: A performance analysis. Remote Sensing 6, 10676-10693 (2014).
3 Klaric, M. N. et al. GeoCDX: An automated change detection and exploitation system for high-resolution satellite imagery. IEEE Transactions on Geoscience and Remote Sensing 51, 2067-2086 (2013).
4 Ozkara, B. B. et al. Correlating volumetric and linear measurements of brain metastases on MRI scans using intelligent automation software: a preliminary study. J Neurooncol 162, 363-371 (2023). https://doi.org:10.1007/s11060-023-04297-4
5 Oermann, E. et al. Longitudinal deep neural networks for assessing metastatic brain cancer on a massive open benchmark. (2023).
6 Amitrano, D., Di Martino, G., Iodice, A., Riccio, D. & Ruello, G. A new framework for SAR multitemporal data RGB representation: Rationale and products. IEEE Transactions on Geoscience and Remote Sensing 53, 117-133 (2014).
7 Amitrano, D. et al. Multitemporal Level-$1\beta $ Products: Definitions, Interpretation, and Applications. IEEE Transactions on Geoscience and Remote Sensing 54, 6545-6562 (2016).
Figures