3006
Multi-site Scanner Characterisation for Global Ultra-low Field MR Imaging1Medical Radiation Physics, Lund University, Lund, Sweden, 2Neuroimaging, King's College London, London, United Kingdom, 3Hyperfine Inc., Guilford, CT, United States, 4Cardiff University Brain Research Imaging Centre (CUBRIC), Cardiff University, Cardiff, United Kingdom, 5University of British Columbia, Vancouver, BC, Canada, 6Perinatal Imaging & Health, King's College London, London, United Kingdom, 7Department of Paediatrics and Child Health, Red Cross War Memorial Children’s Hospital, University of Cape Town, Cape Town, South Africa, 8The Neuroscience Institute, University of Cape Town, Cape Town, South Africa, 9Training & Research Unit of Excellence (TRUE), Zomba, Malawi, 10Infectious Diseases Division, icddr,b, Dahka, Bangladesh, 11Institute for Cellular and Molecular Medicine, Department of Medical Immunology, Faculty of Health Sciences, University of Pretoria, Pretoria, South Africa, 12CaliberMRI, Boulder, CO, United States, 13MNCH D&T, Bill & Melinda Gates Foundation, Seattle, WA, United States
Synopsis
Keywords: Phantoms, MR Value, Quality Assurance
Motivation: Combining data from multiple sites is necessary in order to reach large sample sizes. This can be challenging, especially with portable ultra-low field (ULF) systems where conditions can vary.
Goal(s): To characterise image quality across multiple sites using ULF-MRI for future data harmonization.
Approach: Acquisition of QA scans across sites with centralised analysis for cross-sectional and longitudinal assessment. SNR and T2w contrast were calculated
Results: SNR was consistent within site, but some variation between sites. Image contrast was consistent, but extra care should be taken with software updates.
Impact: Quality assurance is essential for portable ultra-low field MRI. Our results demonstrate that SNR and contrast are useful metrics for image quality characterisation. This paves the way for harmonization of in vivo data in global studies using ultra-low field MRI.
Introduction
Combining MRI data in multi-site studies can prove challenging, but it is evident that pooling data from multiple sites is the only way to achieve large sample sizes needed to map, for instance, normal brain development.1 Ultra-low field MRI scanners lower the threshold for accessing MR imaging through reduced cost and siting requirements, which will facilitate inclusive global imaging studies. However, there is limited knowledge about harmonization methods for ultra-low field MRI systems in multi-site studies.In this work we describe our efforts towards harmonization of ultra-low field MRI systems in a multi-site, global neuroimaging study of the developing brain, using a commercially available phantom. Image contrast and signal-to-noise ratios are reported, with cross-sectional results from 11 sites and longitudinal results from 3 sites.
Phantom description
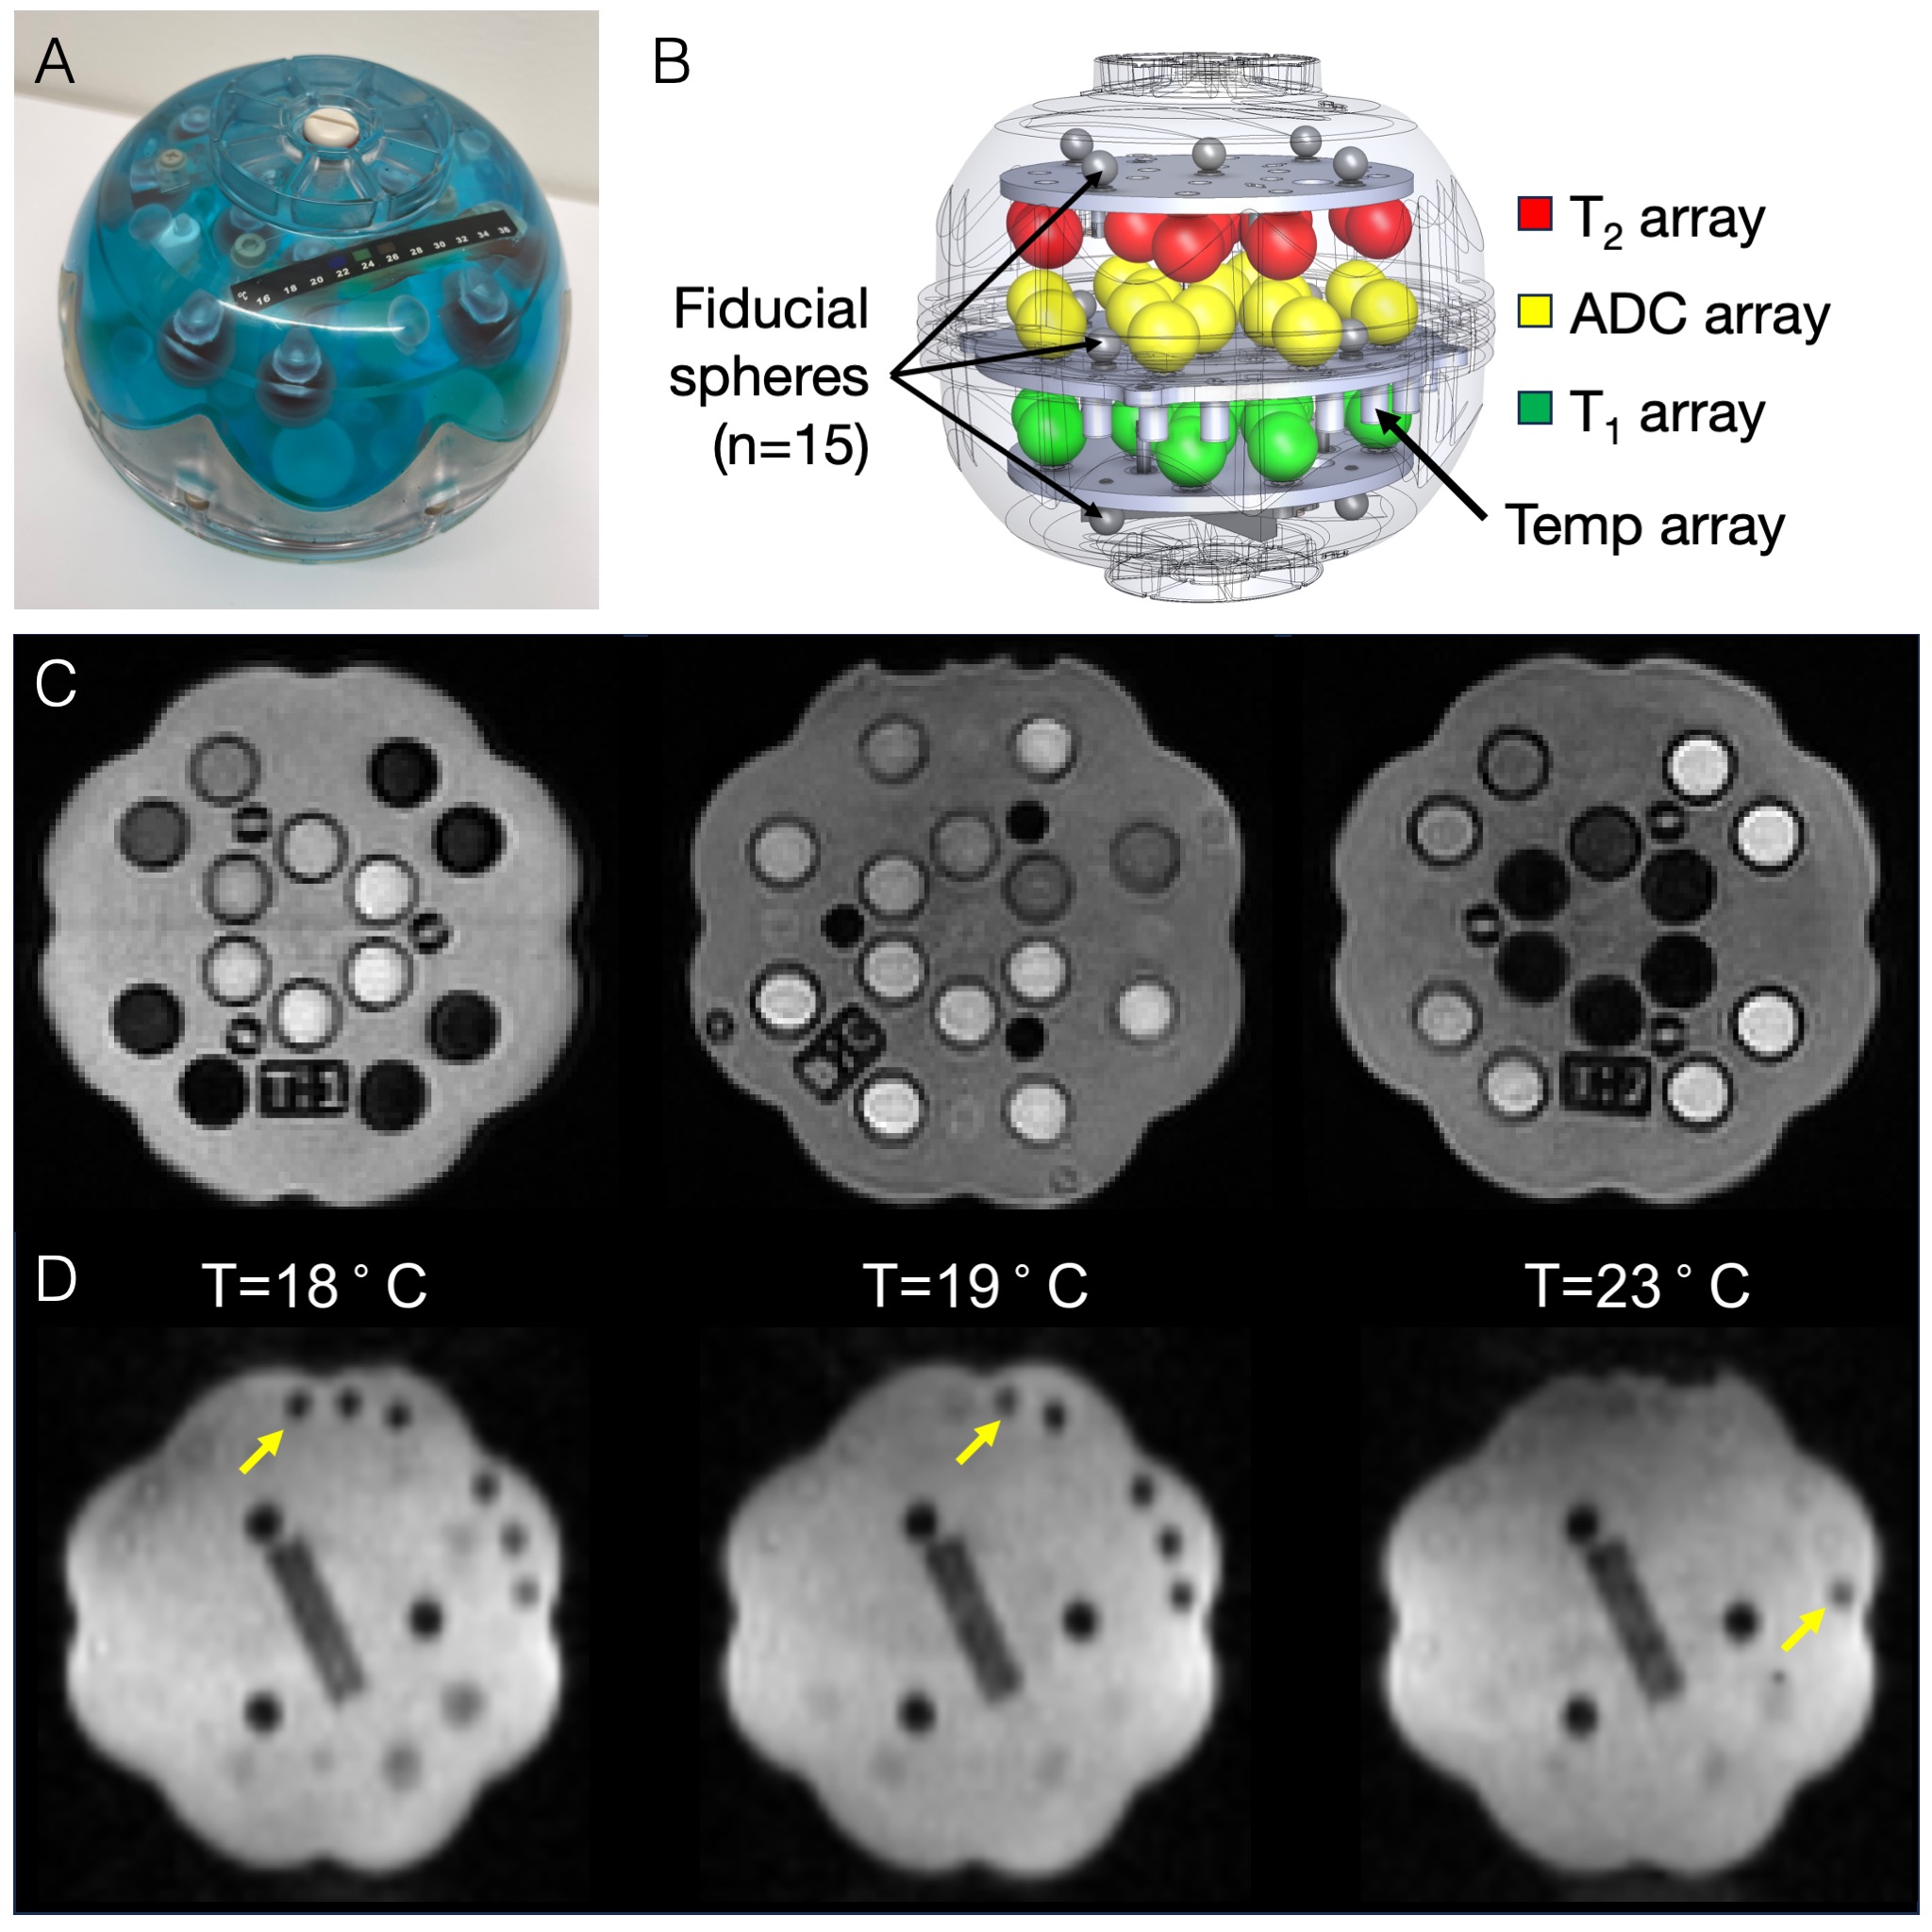
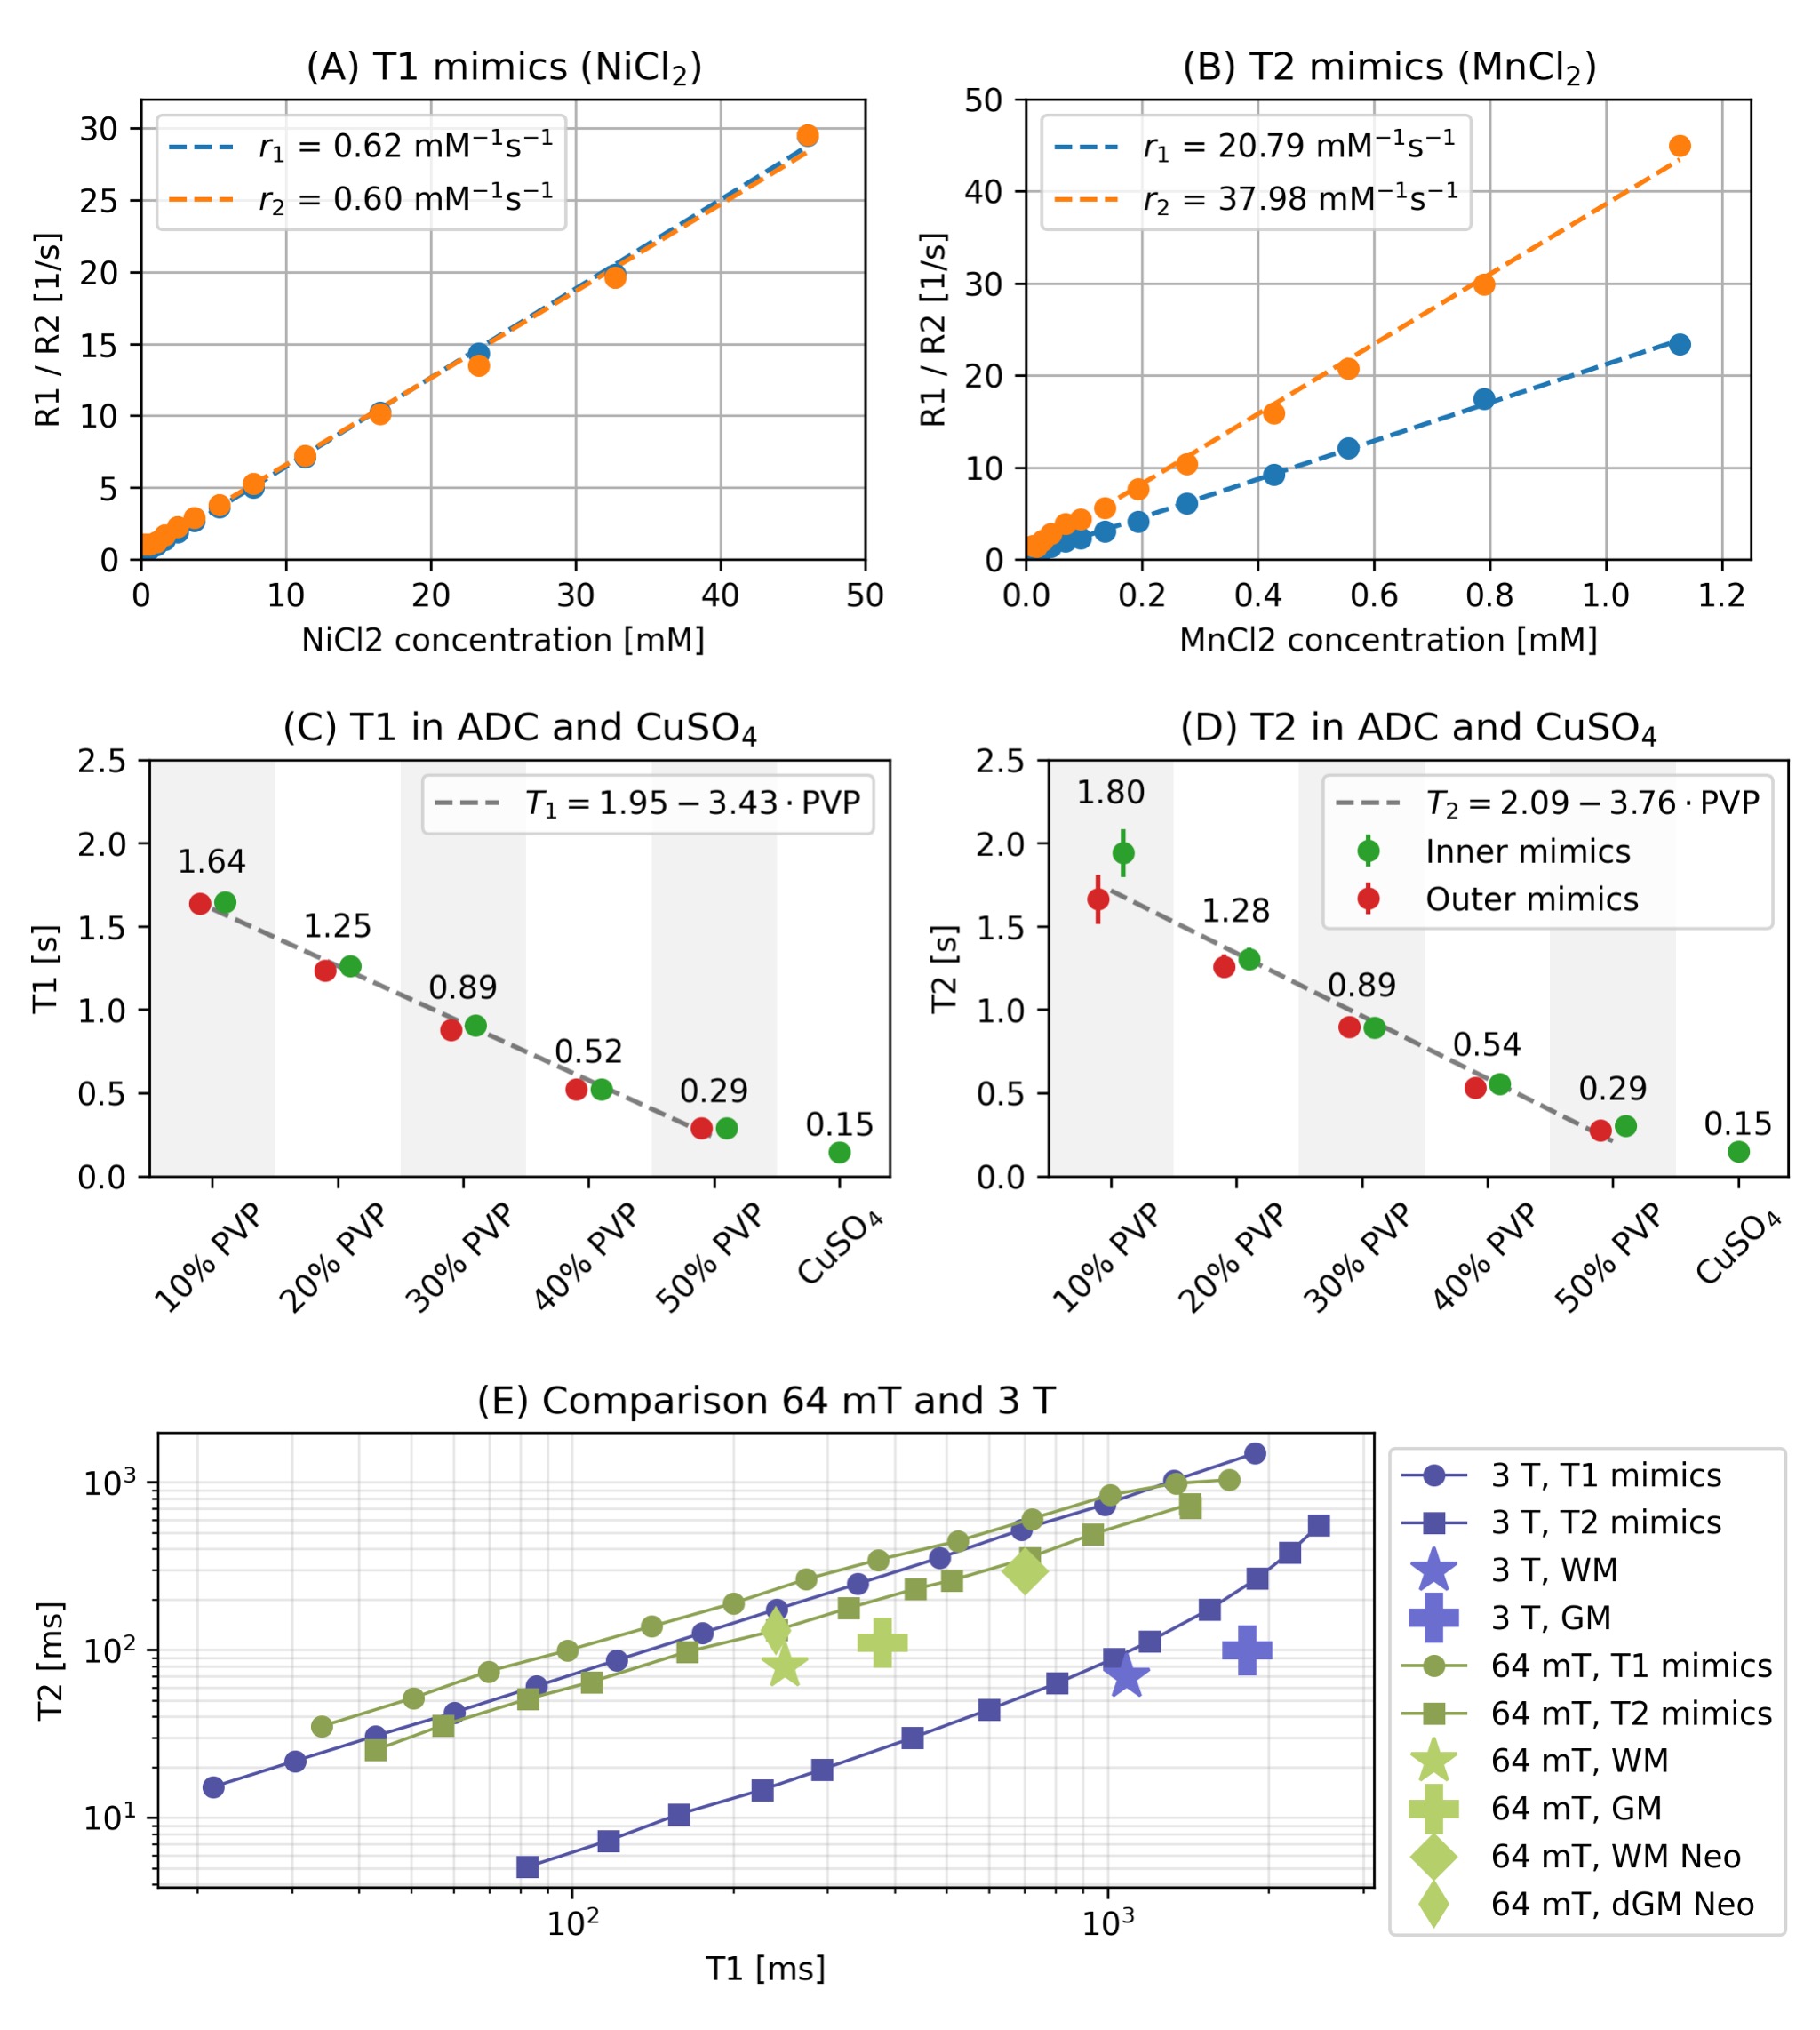
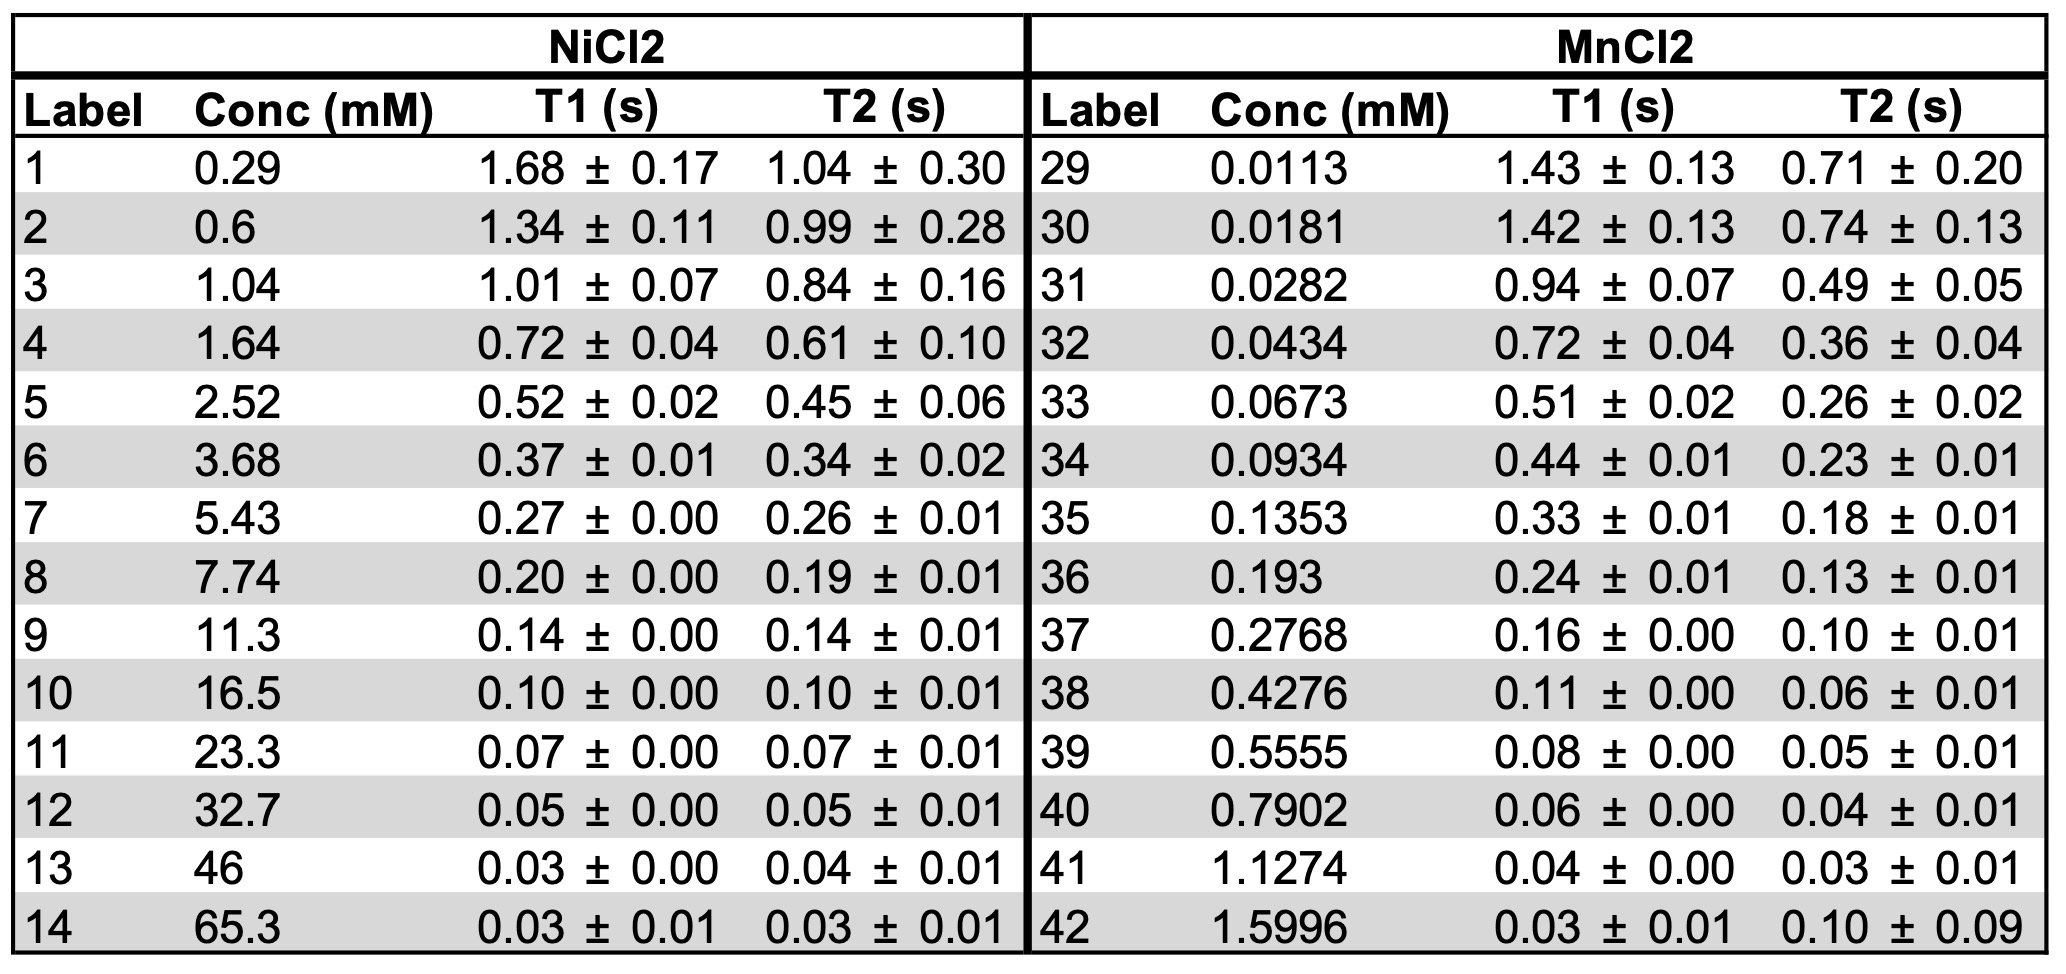
The phantom (CaliberMRI Mini-Hybrid model 137) is a smaller version (170 mm in diameter) of the ISMRM/NIST phantom2 with T1, T2, and ADC tissue mimics, as well as a set of solid fiducial markers to map geometrical distortions (Figure 1). An MR-readable liquid crystal (LC) thermometer is also embedded.3 The T1 and T2 mimics are filled with NiCl2 and MnCl2, with concentrations ranging between 0.3-65.3 mM and 0.01-1.6 mM respectively, with relaxivity at 64 mT measured by Martin et al. to be NiCl2: (r1,r2)=(0.59, 0.57), MnCl2: (20.46, 39.28) mM-1s-1.4 The ADC vials are filled with 0-50% of polyvinylpyrrolidone (PVP). The fill solution is CuSO4.Methods
Parameter mappingRelaxation properties of the phantom mimics were measured at 64 mT using the Hyperfine Swoop (software version 8.7beta1). T1 was quantified using a IR-FSE sequence with 20 TIs logarithmically spaced TIs (25-4000 ms), and TR=5 s. Images were reconstructed offline and T1 maps were calculated using QUIT.5,6,7 T2 maps were acquired with a multi-echo FSE sequence with first TE at 9 ms, echo spacing of 27 ms and TR=3 s. Image reconstruction and parameter map estimation were performed using scanner online methods.
QA Protocol
A QA protocol was developed including five scans for the following purposes:
- Rapid gradient echo - visualisation of the LC thermometer
- 2x axial T2w FSE - Signal-to-noise ratio (SNR), contrast, and geometric distortions
- Cor and Sag T2w FSE - geometric distortions
QA image analysis
All compartments of the phantom (T1, T2, ADC mimics and CuSO4 fill) were automatically segmented. SNR was calculated using the NEMA subtraction method7 from voxels in the CuSO4, as this gives a large number of voxels for robust SNR estimates. Image contrast was calculated from the T1 and T2 mimics by normalizing to the respective mimic with lowest salt concentration. In this study, we only investigated SNR and image contrast; geometric distortions will be reported in future work.
Pilot QA data collection
Data was collected from 11 sites, all using Hyperfine Swoop systems, running different hardware and software versions, and with scanners located in different environments. Three of these sites also provided longitudinal data.
Results
Parameter mappingThe T1 and T2 relaxation measurements are shown in Figure 2. The vials with the highest doping were excluded due to too short T1/T2 for accurate parameter estimation. We found a linear relationship between PVP concentration and T1 and T2 (Figure 2), higher PVP concentration yields lower ADC. Mimics 37,36 and 32,36 were identified as being close to adult and neonatal WM/GM T2 contrast (Table 1).9,10
Pilot multi-site QA
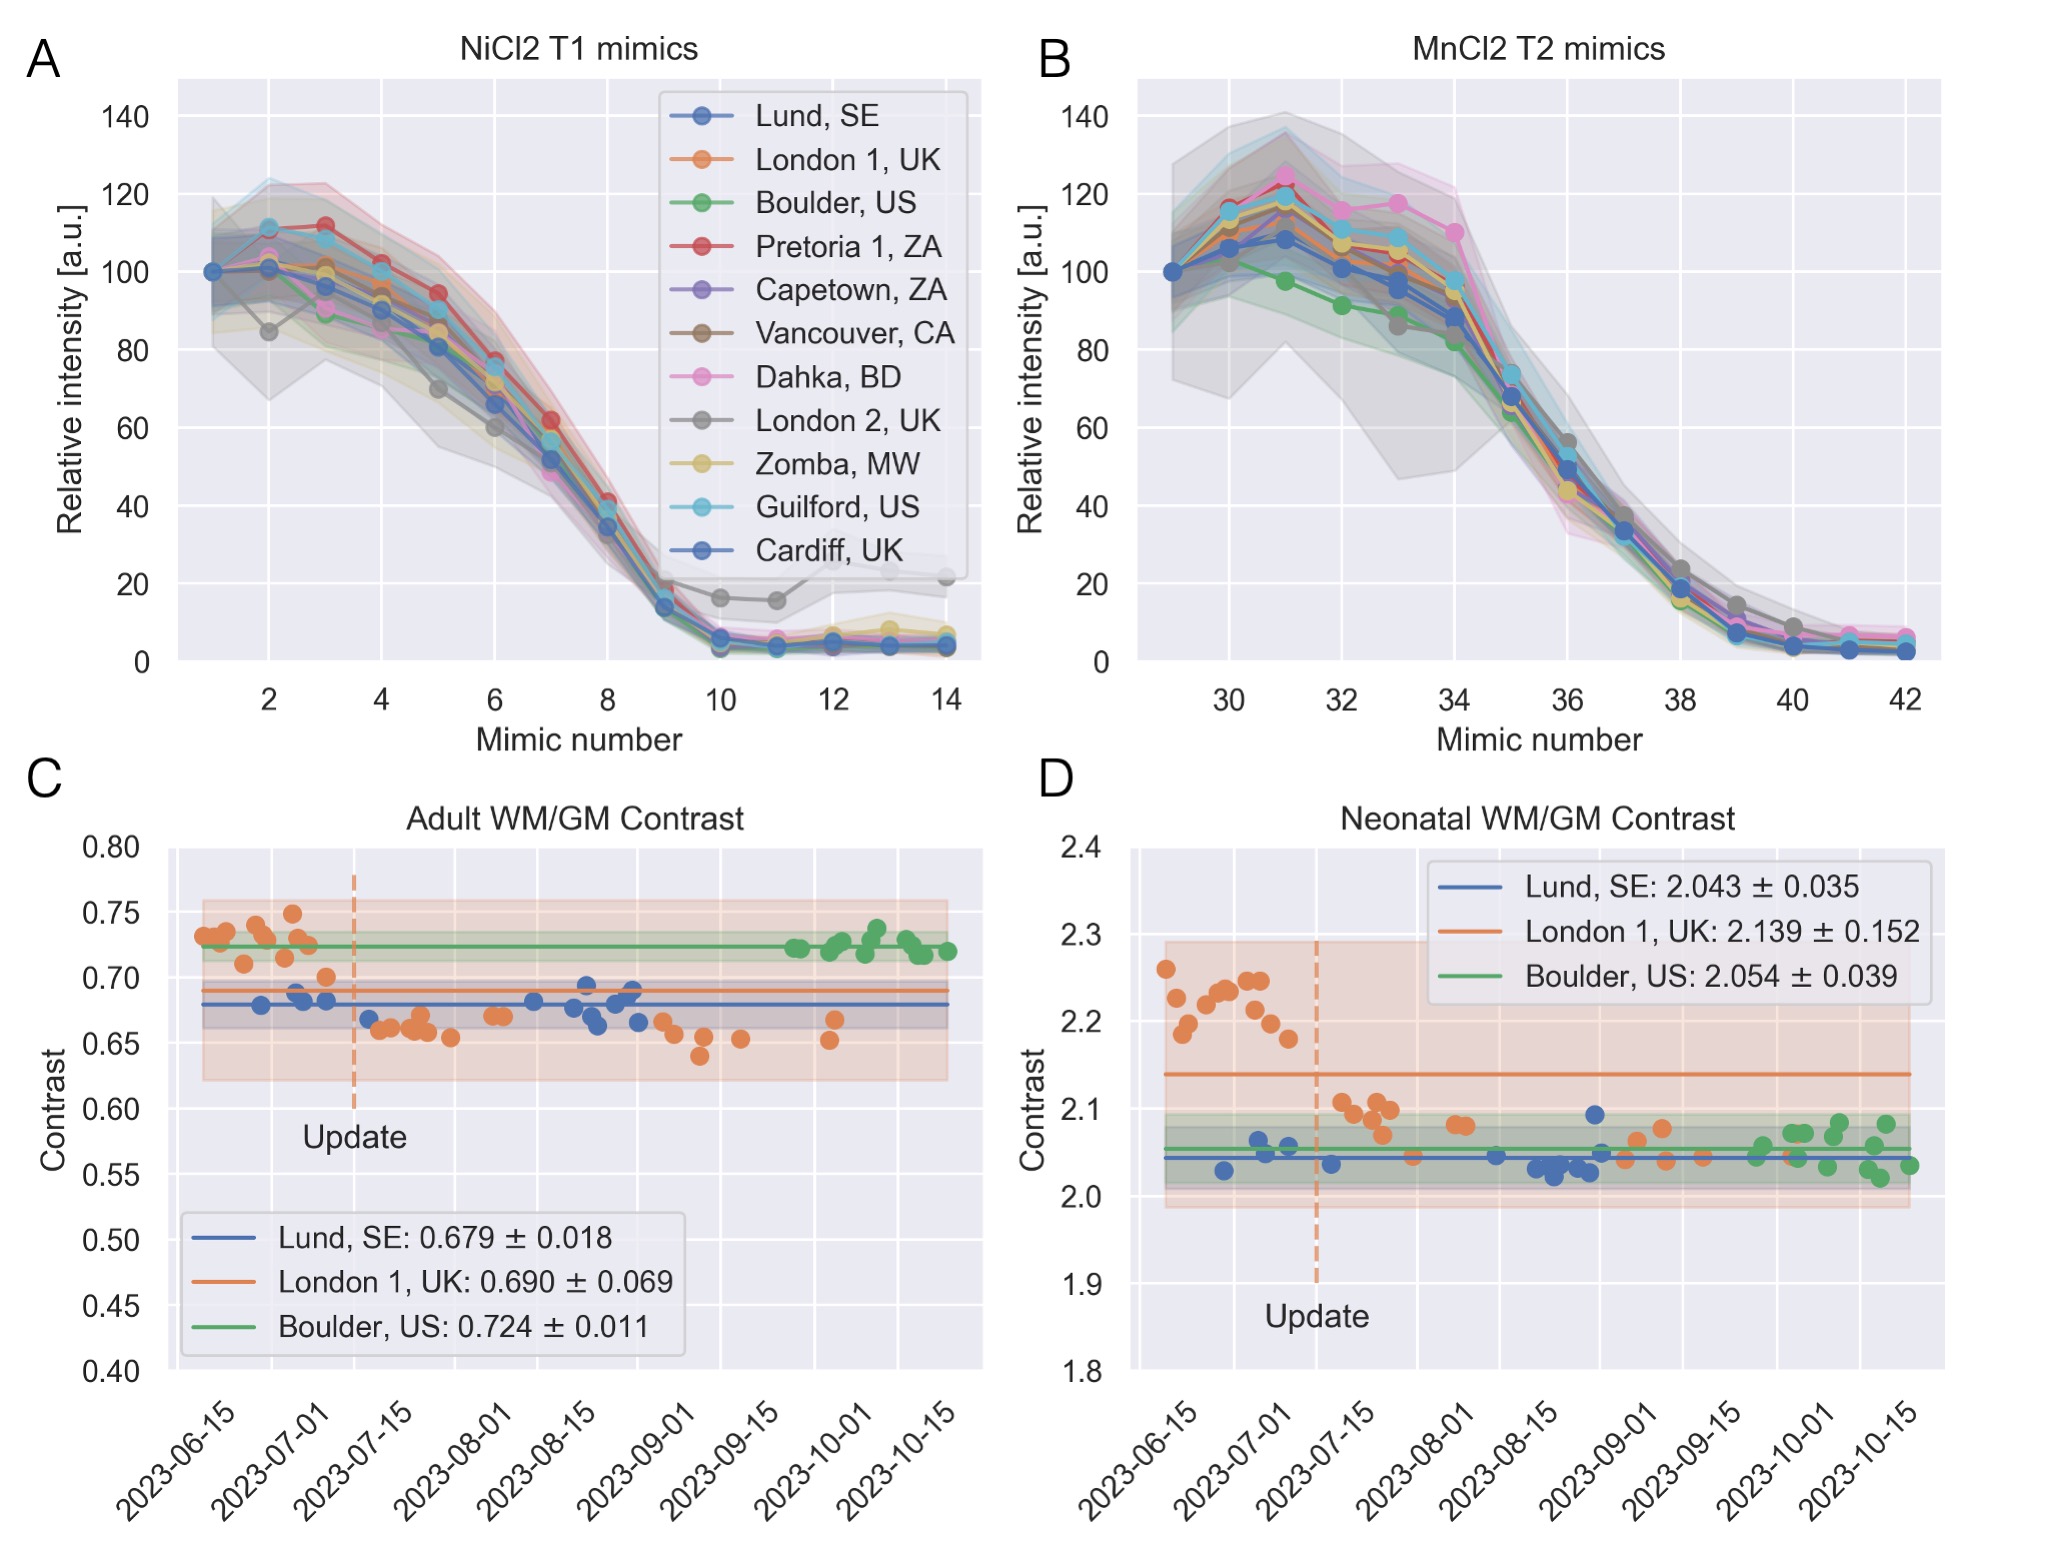
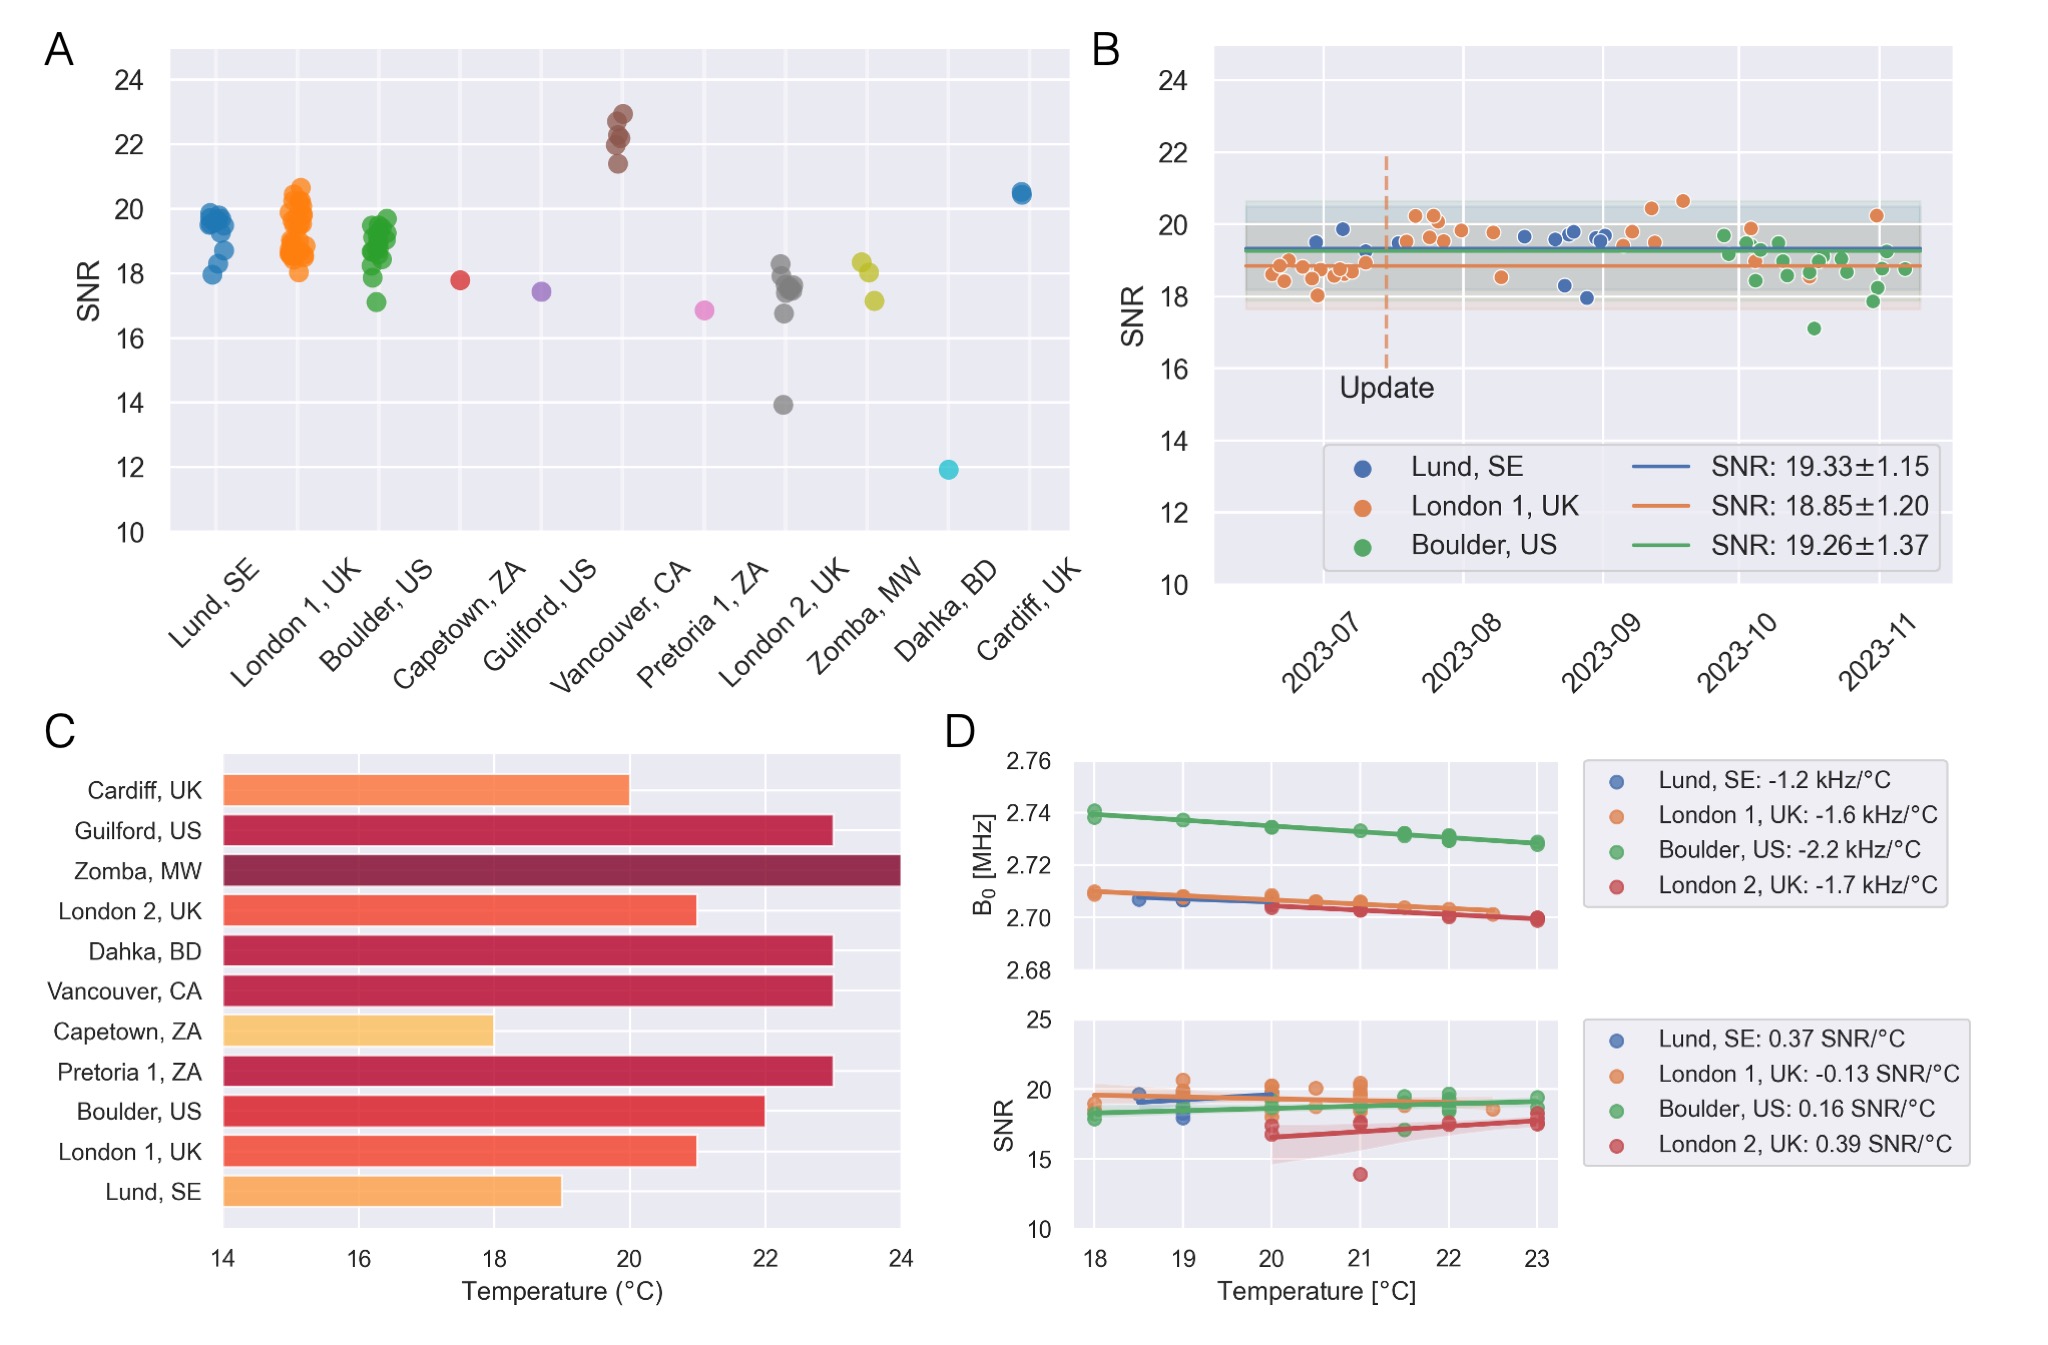
Analysis of image contrast showed consistent results between sites (Figure 3A,B). Longitudinal proxy WM/GM contrast (Figure 3C,D) was consistent within sites, but some effect of the software update which included a known change in sequence parameters. SNR analysis showed high consistency within sites while there were some differences between sites (Figure 4 A,B), as expected when scanners are situated in different environments, evident from differences in operation temperature of 6°C (Figure 4C). We observe a linear relationship between scanner center frequency and temperature, but no clear correlation with SNR.
Discussion and conclusion
We demonstrate that a standardized phantom can be used across a large ultra-low field imaging consortium for scanner characterisation, as a first step towards harmonization. Through this process we identify participation by local team members for QA data collection and management as a critical part for success. Continuous assessment of metrics such as SNR and contrast across the consortium makes it possible to identify factors affecting image quality, e.g., scanner environment or software updates. The next step is to validate these methods in the context of harmonizing in vivo data from multiple sites.Acknowledgements
This work was funded by the Bill and Melinda Gates Foundation (INV-041062), and part-funded by The Crafoord Foundation (#20220898).References
1. Bethlehem RAI, Seidlitz J, White SR, Vogel JW, Anderson KM, Adamson C, et al. Brain charts for the human lifespan. Nature. 2022 Apr 21;604(7906):525–33.
2. Stupic KF, Ainslie M, Boss MA, Charles C, Dienstfrey AM, Evelhoch JL, et al. A standard system phantom for magnetic resonance imaging. Magnetic Resonance in Med. 2021 Sep;86(3):1194–211.
3. Keenan KE, Stupic KF, Russek SE, Mirowski E. MRI‐visible liquid crystal thermometer. Magn Reson Med. 2020 Sep;84(3):1552–63.
4. Martin MN, Jordanova KV, Kos AB, Russek SE, Keenan KE, Stupic KF. Relaxation measurements of an MRI system phantom at low magnetic field strengths. Magn Reson Mater Phy [Internet]. 2023 May 20 [cited 2023 May 25]; Available from: https://link.springer.com/10.1007/s10334-023-01086-y
5. Wood TC, Ljungberg E, Wiesinger F. Radial Interstices Enable Speedy Low-volume Imaging. Journal of Open Source Software. 2021;6(66):3500–3500.
6. Wood TC. QUIT: QUantitative Imaging Tools. Journal of Open Source Software. 2017;3(26):656–656.
7. Padormo F, Cawley P, Dillon L, Hughes E, Almalbis J, Robinson J, et al. In vivo T1 mapping of neonatal brain tissue at 64 mT. Magnetic Resonance in Med. 2023;89(3):1016–25.
8. National Electrical Manufacturers Association. NEMA standards publication MS 1‐2008 (R2014): determination of signal‐to‐noise ratio (SNR) in diagnostic magnetic resonance imaging [Internet]. 2014. Available from: https://www.nema.org/docs/default-source/standards-document-library/ms1-2008-r2014-watermarked.pdf?sfvrsn=2101f7b9_2
9. Artz, Nathan S, Sien, S Maura, Robinson, Amie S, Hu, Houchun H, O’Halloran, Rafael, Poorman, Megan, et al. T1 and T2 Mapping of the Infant Brain with a Low-Field, Portable MRI System. In: Proc Intl Soc Mag Reson Med 30 (2022). London, UK; p. 1811.
10. Jordanova KV, Martin MN, Ogier SE, Poorman ME, Keenan KE. In vivo quantitative MRI: T1 and T2 measurements of the human brain at 0.064 T. Magn Reson Mater Phy [Internet]. 2023 May 20 [cited 2023 May 25]; Available from: https://link.springer.com/10.1007/s10334-023-01095-x
Figures