3004
Spatial characterization of signal-to-noise ratio (SNR) differences among multiple sites using a phantom1Danish Research Centre for Magnetic Resonance, Center for Functional and Diagnostic Imaging and Research, Copenhagen University Hospital – Amager and Hvidovre, DRCMR, Copenhagen, Denmark, 2Department of Neurology, Danish Multiple Sclerosis Center, Copenhagen University Hospital-Rigshospitalet, Glostrup, Copenhagen, Denmark, 3Department of Clinical Medicine, University of Copenhagen, Copenhagen, Denmark, 4Department of Neurology, Danish Multiple Sclerosis Center , Copenhagen University Hospital-Rigshospitalet, Glostrup, Copenhagen, Denmark, 5Department of Neurology, Copenhagen University Hospital Bispebjerg, Copenhagen, Copenhagen, Denmark, 6Department of Health Technology, Technical University of Denmark, Lyngby, Lyngby, Denmark
Synopsis
Keywords: Data Processing, Phantoms
Motivation: The motivation came to acknowledge the aid for sequence standardization and to assess other site-related differences.
Goal(s): We aim to consider the SNR differences to improve comparability between sites in structural analysis of brain data.
Approach: We describe preliminary MRI phantom data from a longitudinal, multi-site MS study, illustrating an approach to sequence standardization and assessing site-related differences.
Results: Scan-rescan data were collected on three 3T MRI systems, using study specific, previously optimized sequences. Signal-to-noise ratio (SNR) was measured on a 16 x 16 grid structure within the phantom. Imaging voxels within the grid where algorithmically identified and SNR assessed in each cube.
Impact: Large between-site differences in SNR and spatial variability were observed, while longitudinal data showed good consistency in mean SNR and spatial appearance. These differences underscore the need for correction to improve between-site comparability.
Background
Multi-site MRI studies are often hampered by the lack of sequence standardization and scanner-related differences. B0 field inhomogeneities, gradient non-linearities, or scanner drifts and upgrades may affect longitudinal data quantification in addition to likely hardware differences. Travelling head studies (Richter, et al. 2022)1 or phantoms (Kathryn E. Keenan, et al. 2017)2 may be used to aid sequence standardization and to assess other site-related differences. However, inter-site differences in clinical trials are not commonly assessed with such reference methods.Purpose
In this work, we analyzed phantom data that are acquired as part of an ongoing longitudinal MRI study at seven radiological sites across Denmark with MRI scanners from three different scanner vendors. Phantom data are collected at least once yearly for the duration of the study, and approximately every 2 months at the main study site. Here, we present initial signal-to-noise ratio (SNR) measurements from four different sites, including longitudinal data, assessed for structural T1w images.Methods
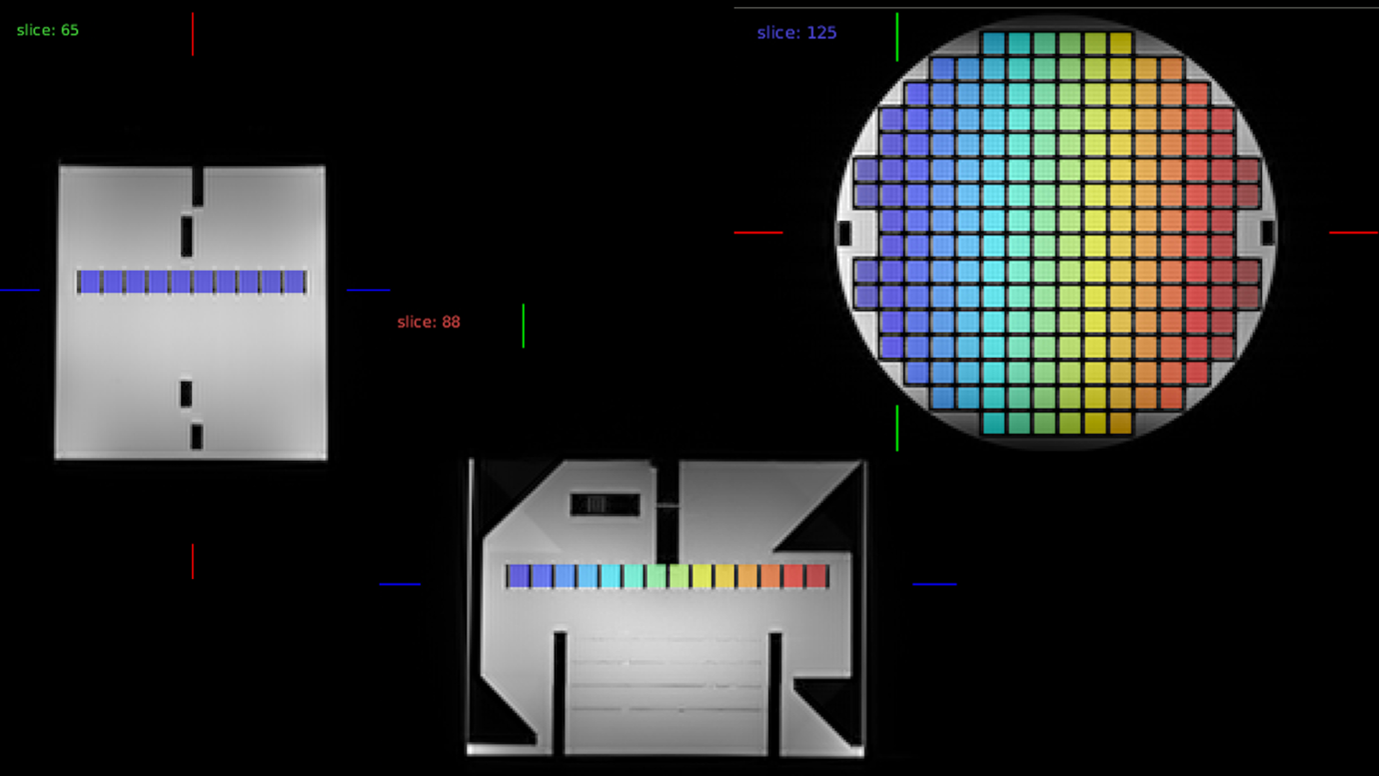
Phantom data were collected on four 3T MRI systems (2 GE, 2 Siemens), for which sequences were optimized beforehand to achieve comparable MR contrasts across sites. The commercial cylindrical phantom includes a circular array of a 16 x 16 grid structure and is filled with 10 mmol NiCl2 and 75 mmol NaCl. Sagittal 3D MPRAGE images were acquired as part of the clinical study protocol with an isotropic resolution of 1 mm3. All sequences were acquired twice within the same scan session. For the main study site, data for 11 time points were available, and two time points from the partner sites. SNR measurements were performed on the above-mentioned grid structure, which is centrally located within the phantom (Fig. 1). The re-scan acquisitions were linearly co-registered (FSL’s FLIRT) to the first scan (M. Jenkinson 2002)3. An in-house algorithm was used to identify imaging voxels of the separate cubes within the grid via intensity thresholding and using a refining step based on the ideal square shape and spatial separation. SNR was assessed in each cube, taking the mean signal of the corresponding voxels and the standard deviation of the noise, obtained by subtracting the repeated images acquired in the same session (PriceRR 1990)4.Result
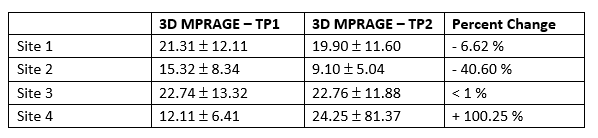
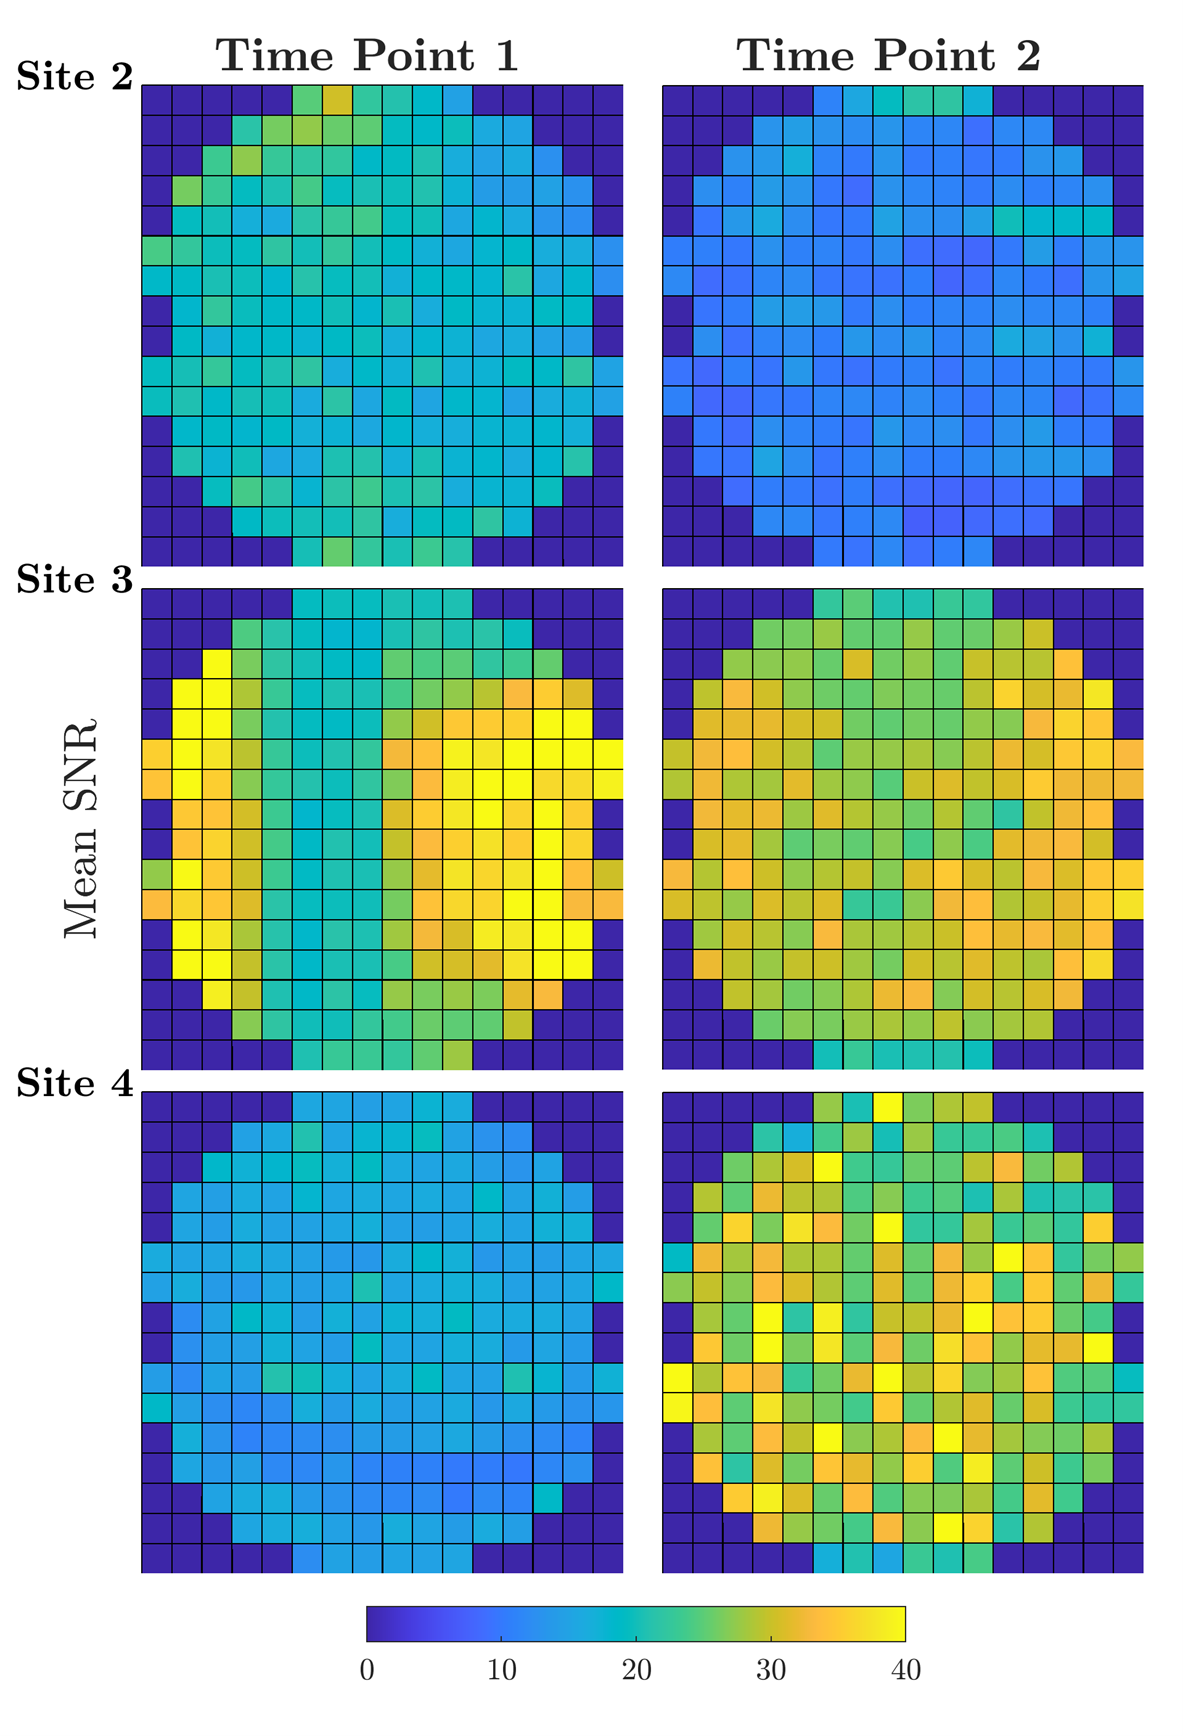
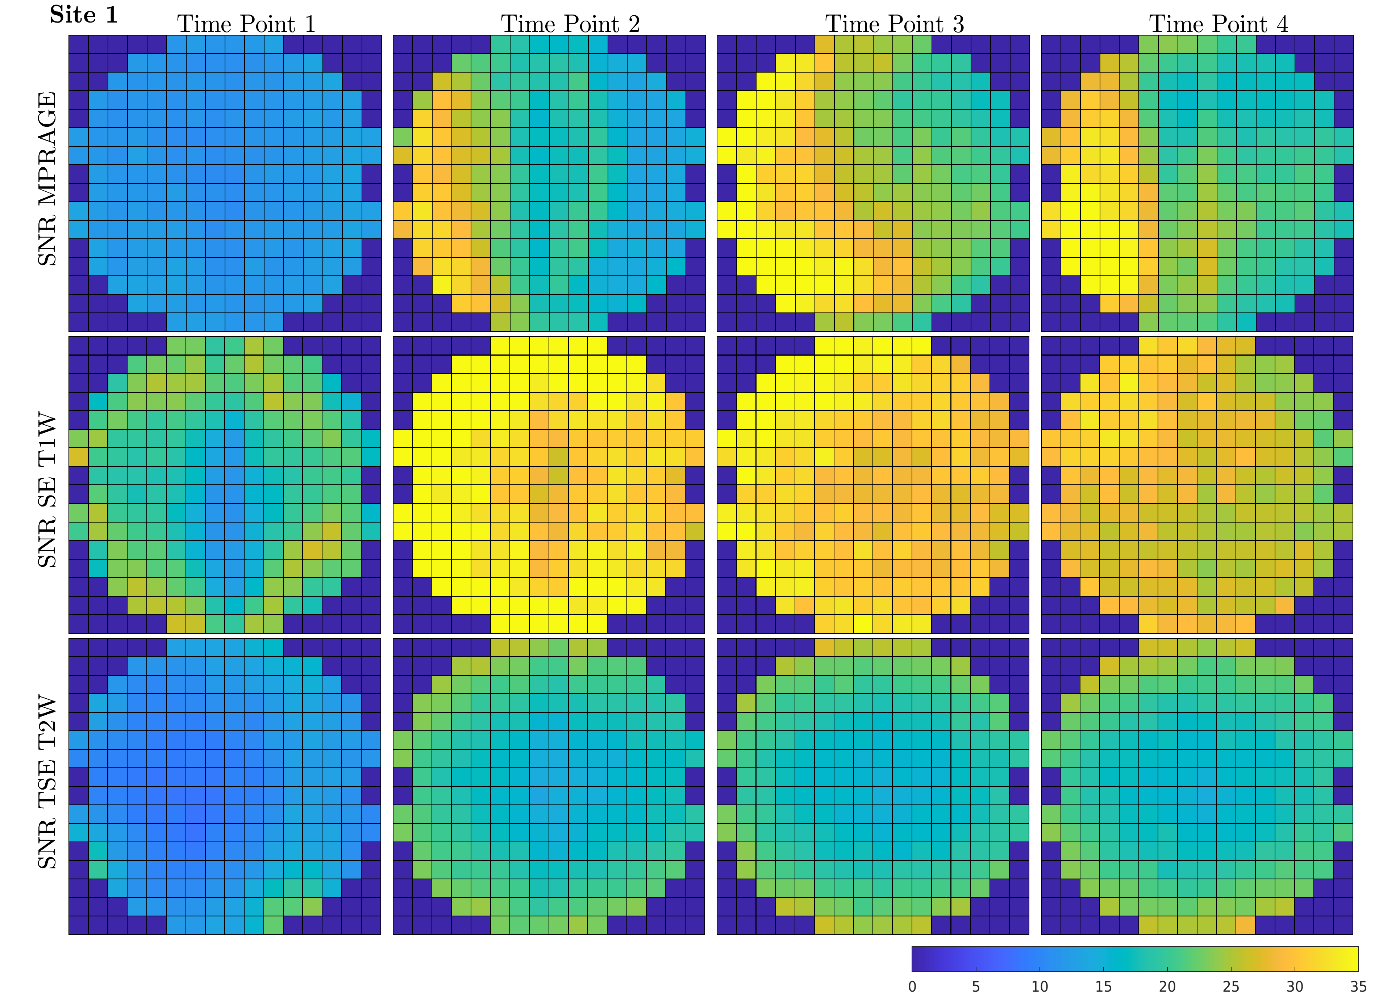
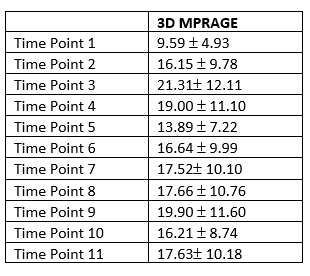
Table 1 lists the mean SNR values and standard deviations across all cubes for the different sites and time points. In addition, Fig. 2 displays the SNR maps of the MPRAGE data at three partner sites. We observed not only large differences in SNR between sites, but also strong spatial variability, in particular for site 3, with SNR differences of up to 50% between regions. Longitudinal data showed good consistency in both mean SNR values and spatial appearance for the main site (site 1), with exception of the 1st and 5th time point (Fig. 3). The partner sites exhibited to various degrees differences in mean SNR and spatial SNR distribution between the two time points. Table 2 reports all longitudinally assessed mean SNR values from the main site.Discussion and Conclusion
Substantial SNR differences exist between sites and, although not unexpected, can lead to differences in structural or lesion segmentation analysis performances. Importantly, there are strong spatial dependencies in SNR, which do not relate to the expected pattern of B0 and B1 field inhomogeneities. Therefore, between-site or between-timepoint differences cannot be easily modeled statistically, assuming for example a fixed factor or offset. We aim to consider these SNR differences to improve comparability between sites in structural analysis of brain data. We further plan to use computed tomography data as a gold standard to assess structural deformities longitudinally.Acknowledgements
Data for this study are acquired in multiple centers across Denmark. The study is supported by the Danish Regions (Regionernes Medicin- og Behandlingspulje). We wish to acknowledge that VW is supported by the Danish Scleroses Foundation (A40219/A41695/A42693) and the Lundbeck Foundation (R347-2020-2413). HL has received funding from the European Research Council (ERC) under the European Union’s Horizon 2020 research and innovation program (grant agreement No 804746).References
1Kathryn E. Keenan, Maureen Ainslie, Alex J. Barker, Michael A. Boss, Kim M. Cecil, Cecil Charles, Thomas L. Chenevert, et al. 2017. "Quantitative magnetic resonance imaging phantoms: A review and the need for a system phantom." ISMRM Magnetic Resonance in Medicine 14. 2M. Jenkinson, P.R. Bannister, J.M. Brady, and S.M. Smith. 2002. "Improved optimisation for the robust and accurate linear registration and motion correction of brain images." NeuroImage, 17(2) 825-841. 3PriceRR, AxelL ,MorganT, etal. 1990. "Quality assurance methods and phantoms for magnetic resonance imaging." report of AAPM nuclear magnetic resonance Task Group No.1. Med Phys;17 287-95. 4 Richter, Sophie, Stefan Winzeck, M. Marta Carreia, N. Evgenios Kornaropoulos, Anne Manketelow, Joanne Outtrim, Doris Chatfield, et al. 2022. "Validation of cross-sectional and longitudinal ComBat harmonization." Neuroimage: Reports 10.Figures