3003
A new approach for reproducible water fraction and T1 mapping across different qMRI acquisition protocols1The Edmond and Lily Safra Center for Brain Sciences, The Hebrew University of Jerusalem, Jerusalem, Israel, 2Donders Institute for Brain, Cognition and Behavior, Radboud University, Nijmegen, Netherlands, 3The Edmond and Lily Safra Center for Brain Sciences (ELSC), The Hebrew University of Jerusalem, Jerusalem, Israel
Synopsis
Keywords: Data Processing, Brain
Motivation: The quantitative MRI community uses various acquisition approaches to extract the same quantitative maps while continuously working to find the agreement between them.
Goal(s): Our goal was to examine the agreement between the outcomes of two acquisition approaches, variable flip angle and MP2RAGE.
Approach: We produced a postprocessing method that generated qMRI maps from both acquisition approaches and controlled the similarities between the maps.
Results: Our new approach produced strong correlations between qMRI maps acquired with different sequences, emphasizing the agreement and consistency between them.
Impact: Our approach provides high agreement between different qMRI acquisition strategies, that may allow harmonization between different scanners and MR protocols and enable the usage of multiple datasets for research purposes.
Introduction
Quantitative MRI (qMRI) is highly valuable method to estimate the human brain microstructural changes during aging and disease. An important goal of qMRI field is to provide reliable multi-parametric brain maps1. A commonly used qMRI metric of the human brain is T1 map. Two main acquisition approaches to quantify T1 on clinical scanners are variable flip angle (VFA) and Magnetization Prepared with 2 Rapid Gradient Echoes (MP2RAGE), yet the agreement between these approaches was not yet determined in extensive in vivo datasets. A potential benefit of VFA is the fact that it allows the extraction of an additional qMRI map, i.e., proton density (PD) map2, which is not often explicitly extracted using the MP2RAGE formalism or mentioned in the original publications3,4. In the brain, normalized PD is used to estimate the water fraction (WF). In this work, we first examined the agreement between the T1 maps obtained from these two approaches. Second, we presented a pipeline to obtain PD and WF maps from the MP2RAGE protocol that agree well with the VFA’s maps. Hence, this work obtains an additional qMRI map for the MP2RAGE approach which is in agreement with the VFA approach.Methods
Data- In this work, we used 14 healthy individuals aged 26-75, who were scanned in both VFA and MP2RAGE protocols:(i) VFA, Gradient echo sequence was acquired with the parameters TR=19 ms, five equally spaced echoes TE=3.34-14.02 ms, using 4 different FA=4°,10°,20°,30°, TAcquisition=~25 minutes, resolution=1mm isotropic.
(ii) MP2RAGE sequence was acquired with the parameters TR=5000 ms, TE=2.98 ms, TI= 700, 2500 ms, FA=4°,5°, TAcquisition=~8 minutes, resolution=1mm isotropic.
(iii) We computed a B1 bias correction on the maps extracted from VFA protocol using mrQ software5. For this correction, spin-echo inversion recovery images were acquired with echo-planar imaging readout (SEIR-EPI). The parameters were TE=49 ms, TR=2920 ms, TI=200, 400, 1200, 2400 ms. The resolution was 2mm in-plane and slice thickness was 3mm.
T1 map- First we registered MP2RAGE maps to the VFA maps’ space using FSL’s FLIRT registration tool7,8. In each approach T1 and M0 were estimated using methods described before. For VFA see Mezer et al. work5 and for MP2RAGE see Marques GitHub repository6.
Calculating PD and WF maps- We followed the algorithm in Mezer et al. work2,5. In brief, we assumed that M0 = Coil Gain*PD considering a neglected T2* contribution when TE<3.34ms. We then estimated the coil gain bias and separated it from the PD contribution. For this we assumed a local linear relationship between 1/T1 and 1/PD values.
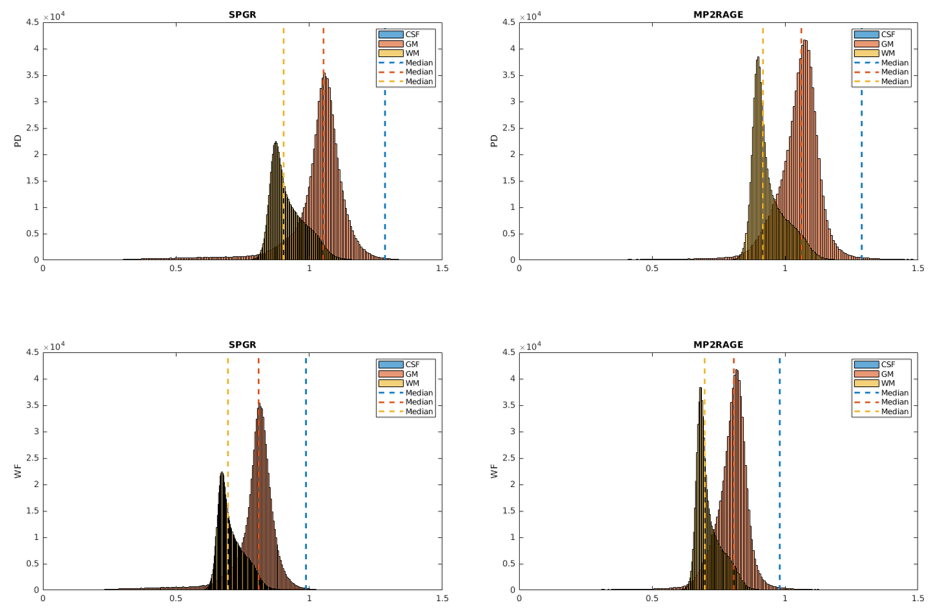
Next, we normalized the PD by the CSF values to estimate the WF map. First, we identified the CSF ROI using the FreeSurfer segmentation algorithm9 and eliminated any voxel with T1 in the range of 3.7-4.7. Then, we calculated the linear trend between 1/PD and 1/T1 in the CSF. Last, we calculated a calibration value which determines that in pure water where T1 is equal to 4.310, WF should be equal to 1. Using this value, we calibrated the entire brain map (Fig.1).
Results
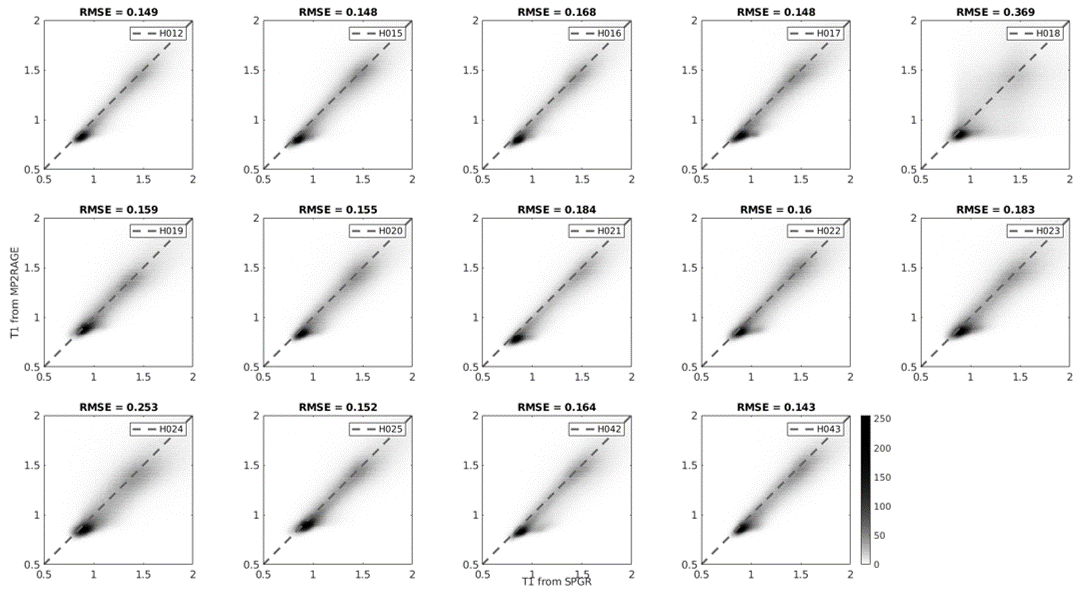
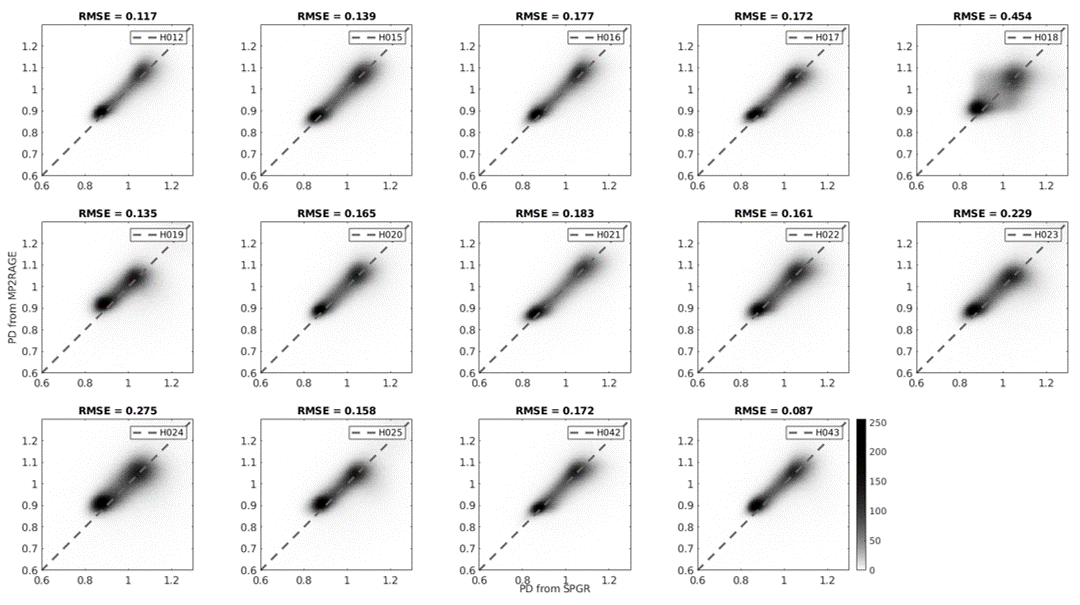
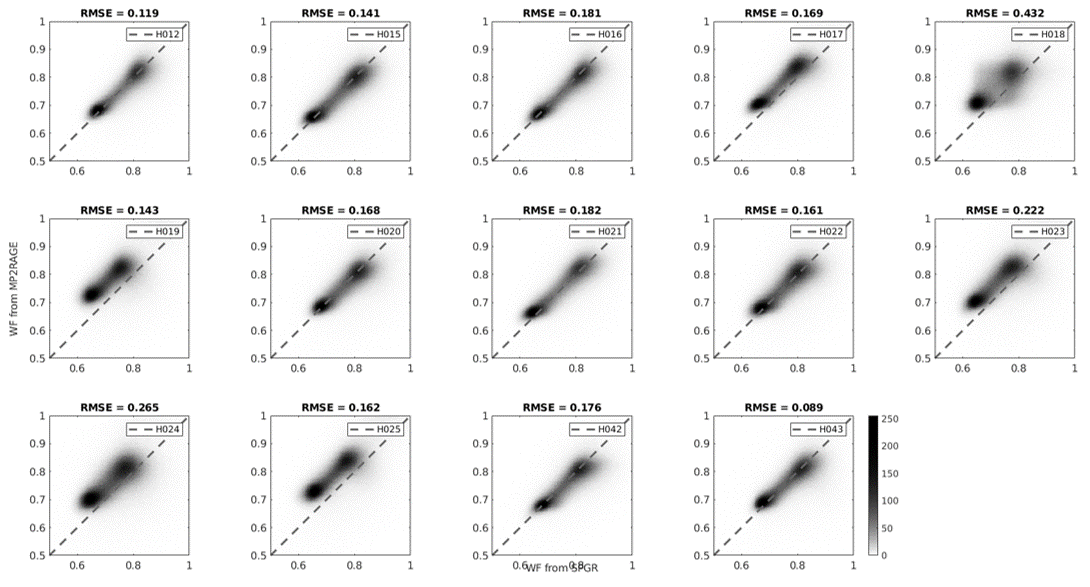
First, we tested the correlation between the T1 values of the VFA protocol and the MP2RAGE protocol. We found a strong correlation between the two maps (Fig.2). Next, we tested the correlations between PD maps. We found a similarly strong agreement in those maps (Fig.3). Normalization of PD maps to obtain WF from both protocols also showed a high correlation (Fig.4).Conclusions
Our study suggests that maps extracted from VFA and MP2RAGE protocols can both provide similar qMRI values, highlighting the agreement between the two methods. Here, we found that by using the same postprocessing algorithm a great similarity can also be obtained for the PD and WF maps. WF map is valuable because it allows for more precise tissue characterization5,11. Furthermore, a join modeling of the T1 and WF values has been proposed for calculating the tissue reflexivity12. Last, a great effort in the qMRI community is pointed to reliable values across scanner and protocol13, this work is adding an important benchmark for this research.Acknowledgements
No acknowledgement found.References
1. Mohammadi, S., Callaghan, M., Cercignani, M., Dowell, N. G., & Tofts, P. S. (2018). Quantitative MRI of the brain. In CRC Press eBooks.
2. Mezer, A., Rokem, A., Berman, S., Hastie, T., & Wandell, B. A. (2016). Evaluating quantitative proton-density-mapping methods. Human Brain Mapping, 37(10), 3623–3635.
3. Marques, J. P., Kober, T., Krueger, G., Van Der Zwaag, W., Van De Moortele, P., & Gruetter, R. (2010). MP2RAGE, a self bias-field corrected sequence for improved segmentation and T1-mapping at high field. NeuroImage, 49(2), 1271–1281.
4. Marques, J. P., & Gruetter, R. (2013). New developments and applications of the MP2RAGE sequence - Focusing the contrast and high spatial resolution R1 mapping. PLOS ONE, 8(7), e69294.
5. Mezer, A., Yeatman, J. D., Stikov, N., Kay, K., Cho, N., Dougherty, R. F., Perry, M., Parvizi, J., Hua, L. H., Butts-Pauly, K., & Wandell, B. A. (2013). Quantifying the local tissue volume and composition in individual brains with magnetic resonance imaging. Nature Medicine, 19(12), 1667–1672. (GitHub. https://github.com/mezera/mrQ).
6. JosePMarques. GitHub - JosePMarques/MP2RAGE-related-scripts: MP2RAGE Scripts - T1 map correction & Background noise removal. GitHub. https://github.com/JosePMarques/MP2RAGE-related-scripts.
7. Jenkinson, M., Bannister, P., Brady, M., & Smith, S. M. (2002). Improved optimization for the robust and accurate linear registration and motion correction of brain images. NeuroImage.
8. Jenkinson, M., & Smith, S. M. (2001). A global optimisation method for robust affine registration of brain images. Medical Image Analysis, 5(2), 143–156.
9. Fischl, B., & Dale, A. M. (2000). Measuring the thickness of the human cerebral cortex from magnetic resonance images. Proceedings of the National Academy of Sciences of the United States of America, 97(20), 11050–11055.
10. Hopkins, A. L., Yeung, H. N., & Bratton, C. B. (1986). Multiple field strengthin vivo T1 andT2 for cerebrospinal fluid protons. Magnetic Resonance in Medicine, 3(2), 303–311.
11. Neeb, H., Zilles, K., & Shah, N. J. (2006). A new method for fast quantitative mapping of absolute water content in vivo. NeuroImage, 31(3), 1156–1168.
12. Filo, S., Shtangel, O., Salamon, N., Kol, A., Weisinger, B., Shifman, S., & Mezer, A. (2019). Disentangling molecular alterations from water-content changes in the aging human brain using quantitative MRI. Nature Communications, 10(1).
13. Stikov, N., Boudreau, M., Levesque, I. R., Tardif, C., Barral, J. K., & Pike, G. B. (2014). On the accuracy of T1 mapping: Searching for common ground. Magnetic Resonance in Medicine, 73(2), 514–522.
Figures