2998
A Linear Model approach for treating partial volumes in quantitative 1H MRS of cortical grey matter – application to an osteoarthritis pain study1Molecular and Clinical Sciences Research Institute, St George's, University of London, London, United Kingdom, 2King's College London, London, United Kingdom, 3Infection & Immunity Research Institute, St George's, University of London, London, United Kingdom, 4Dept Rheumatology, St George's Hospital Foundation Trust, London, United Kingdom
Synopsis
Keywords: Data Processing, Spectroscopy
Motivation: The accuracy of absolute quantitation of metabolites by 1H MRS in grey-matter is compromised in the presence of partial volumes of CSF
Goal(s): To develop a linear model of metabolite concentration estimates as a function of partial volumes
Approach: The effects of varying tissue fractions and relaxation times on metabolite concentrations were modelled to investigate how they affected the variability in metabolite concentration estimates
Results: A general linear model with parameters relating to tissue partial volume as covariates enables statistical comparisons of absolute metabolite levels between patient sub-groups without a priori knowledge of tissue relaxation times.
Impact: A General Linear Model statistical approach enables robust comparison of cortical grey matter metabolite concentrations between patient groups, and minimises the propagation of errors that occurs when the tissue partial volume properties are inaccurately estimated.
INTRODUCTION
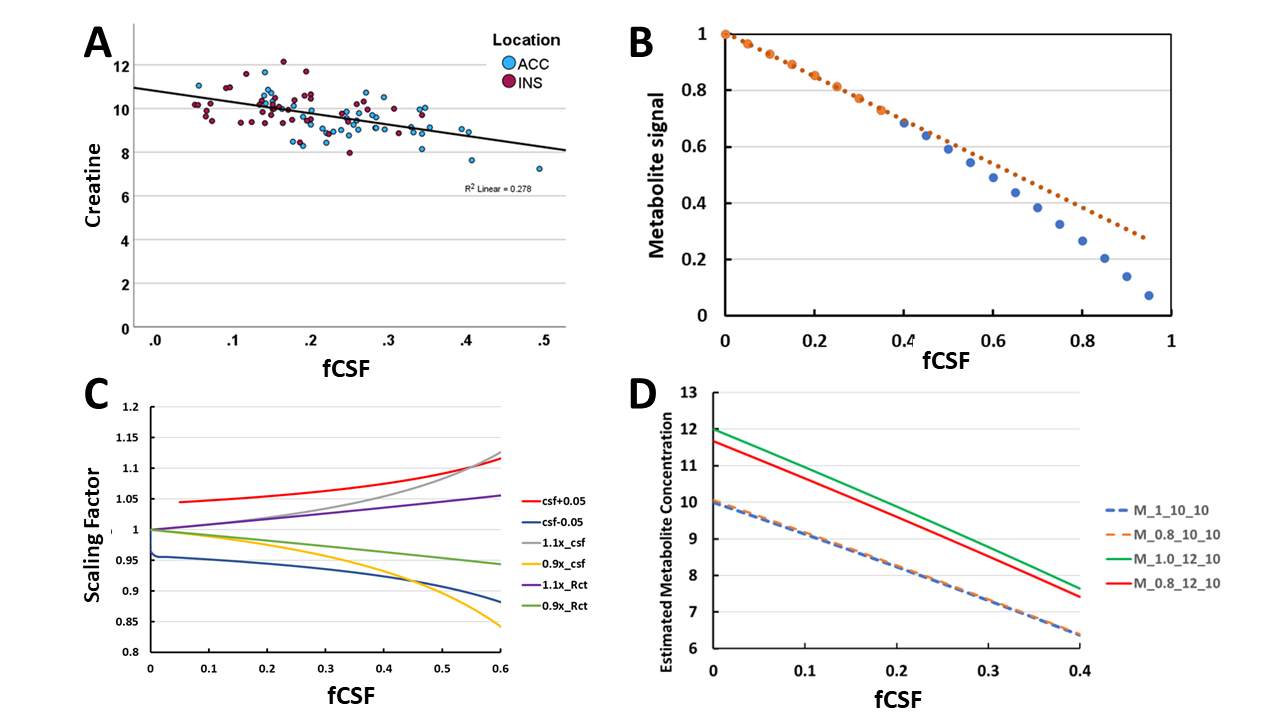
Metabolic alterations in cortical grey matter (GM) pain-processing regions are of interest for understanding mechanisms of chronic pain.1 However, 1H MRS quantitation is problematic due to variable fractional volumes of CSF (fCSF) and white matter (fWM). Metabolite ratios to minimise fCSF, suggest elevated Glx/tCr,2 but compound the effects of noise and interpretation of a ratio is ambiguous. Elevated absolute Glutamate (Glu) is reported when partial volume corrections are used.3,4 Tissue specific correction factors lead to metabolite concentration (Mest) errors unless there are accurate knowledge of tissue parameters.5,6 Such errors propagate to systematic errors in relation to GM assessments;6,7 tissue segmentation bias will also affect Mest.5 We wish to determine whether there is elevated Glu in patients with hand osteoarthritis (OA) that relates to reported pain.8 However, the uncorrected tCr decreases by only 38% for a 50% increase in fCSF (Fig 1A), suggesting a systematic error. We have investigated how errors in tissue parameters affect metabolite quantitation and whether a simple linear model approach to analysis provides a more optimum analysis strategy.METHODS
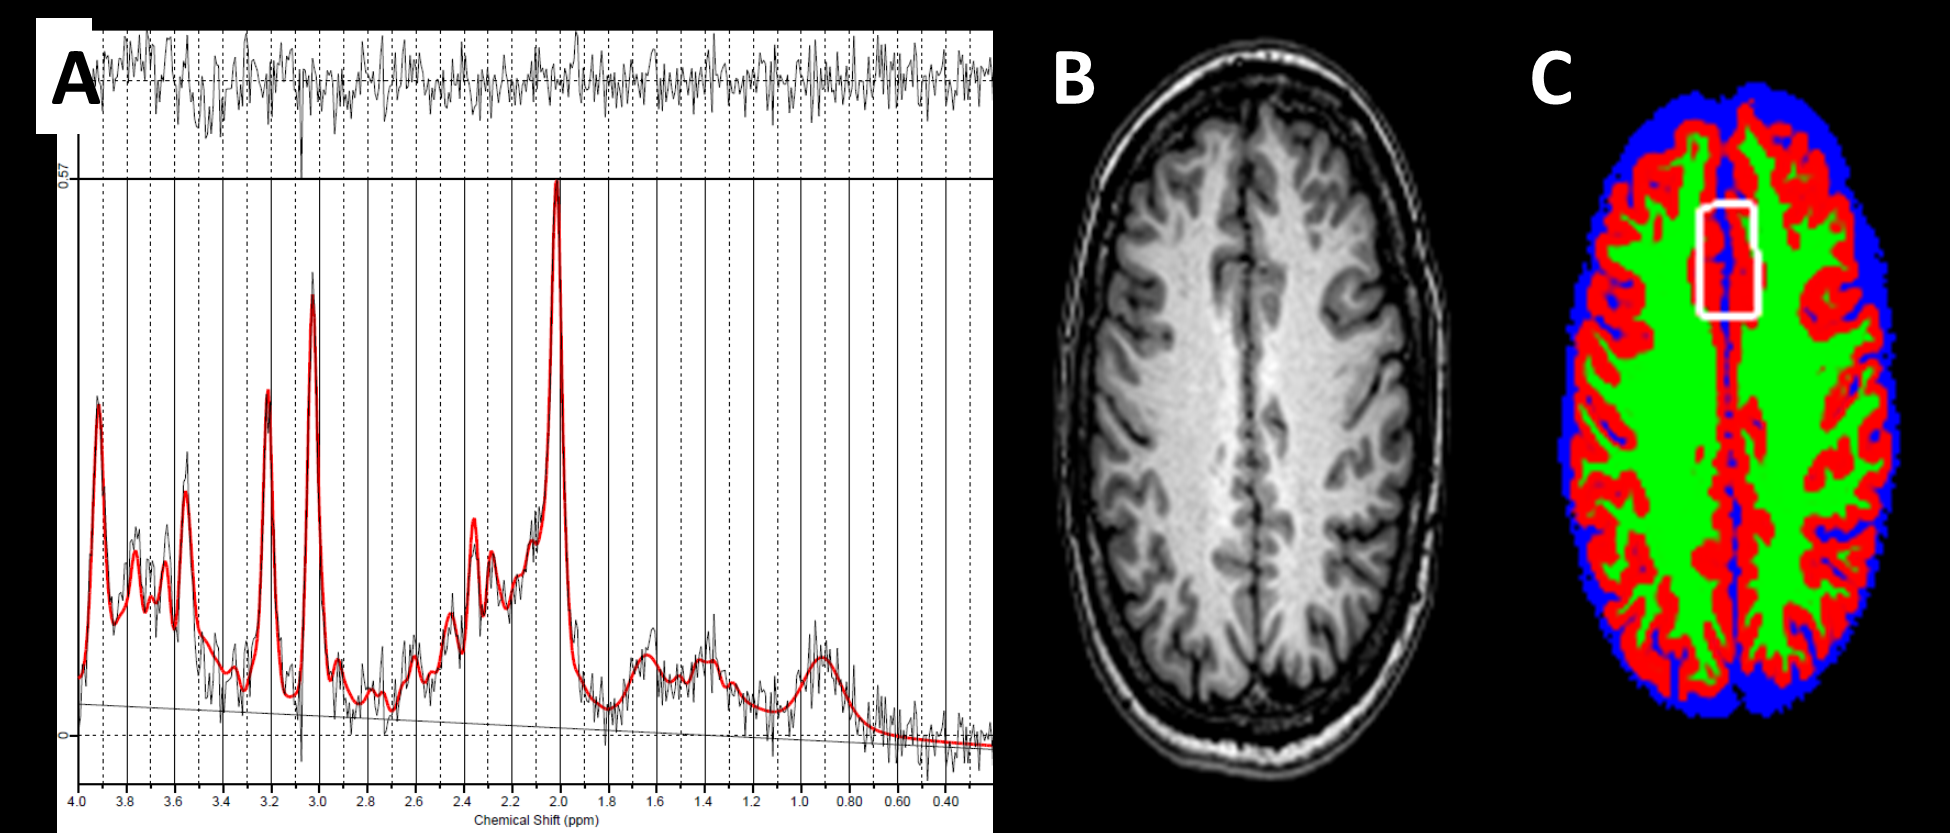
Data1H MRS was acquired from the Insular (INS) and Anterior Cingulate Cortex (ACC) in n=19 controls with no signs of OA, age range 39-71, mean 53yr; and 38 patients with hand osteoarthritis, age range 44-75, mean 63yr. Pain levels were scored with AUSCAN, mean 300, range 107-449. LCModel provided an uncorrected estimate of the metabolite concentration using tissue water signal as a reference. MRS voxels were co-registered to 3D T1w images (1x1x1mm reconstructed); maximum likelihood estimates of fGM, fWM and fCSF were created with SPM12 using a 50% threshold.
Signal Modelling
A three compartment model of Mest was used5 with separate metabolite levels, Mg and Mw in GM and WM:
Mest = Ms / Ws = (Mg fGM + Mw fWM) / (Rc fCSF + Rg fGM + Rw fWM) Eq. (1)
where Ri = PDi exp(-TE/T2i) [1- exp(-TR/T1i)] with i = c, g or w.
Estimates of the T1, T2 relaxation times and proton densities PD, were taken from the literature.
RESULTS
MRS dataSpectra with artefacts, poor water suppression, baseline roll and Glu CRLB>10% were rejected. The analysed dataset comprised 18 controls and 28 patients, with CRLB<10% for all metabolites apart from Gln: mean FWHM=0.046, range 0.02 - 0.09ppm; SNR=14.3, range 9-21; fCSF from 0.06 to 0.49; fGM/(fGM+fWM) from 0.68 to 0.97.
Signal Modelling
Mest is linear with fCSF up to 0.4, with greater subsequent curvature the lower the ratio Rct = Rc/Rg (Fig 2B). A scaling factor of the ratio of the true estimation of Mest to that when there are systematic errors is plotted in Fig 2C for: an offset error in fCSF of +/- 0.05; a systematic over or underestimation of fCSF and Rct by factors of 0.9 and 1.1. Fig 2C demonstrates that such errors can lead to an increasing or decreasing error in Mest with fCSF, and in combination they can accumulate or cancel. Over the range fCSF of 0.02 to 0.4 there is good linearity for all curves (R2>0.9). Fig 2D shows the correlation of Mest with fCSF is not dependent on the value of fGM/tGWM fraction (range 0.8 to 1), with vertical dislacement predominantly dependent on Mg and Mw.
General Linear Model (GLM)
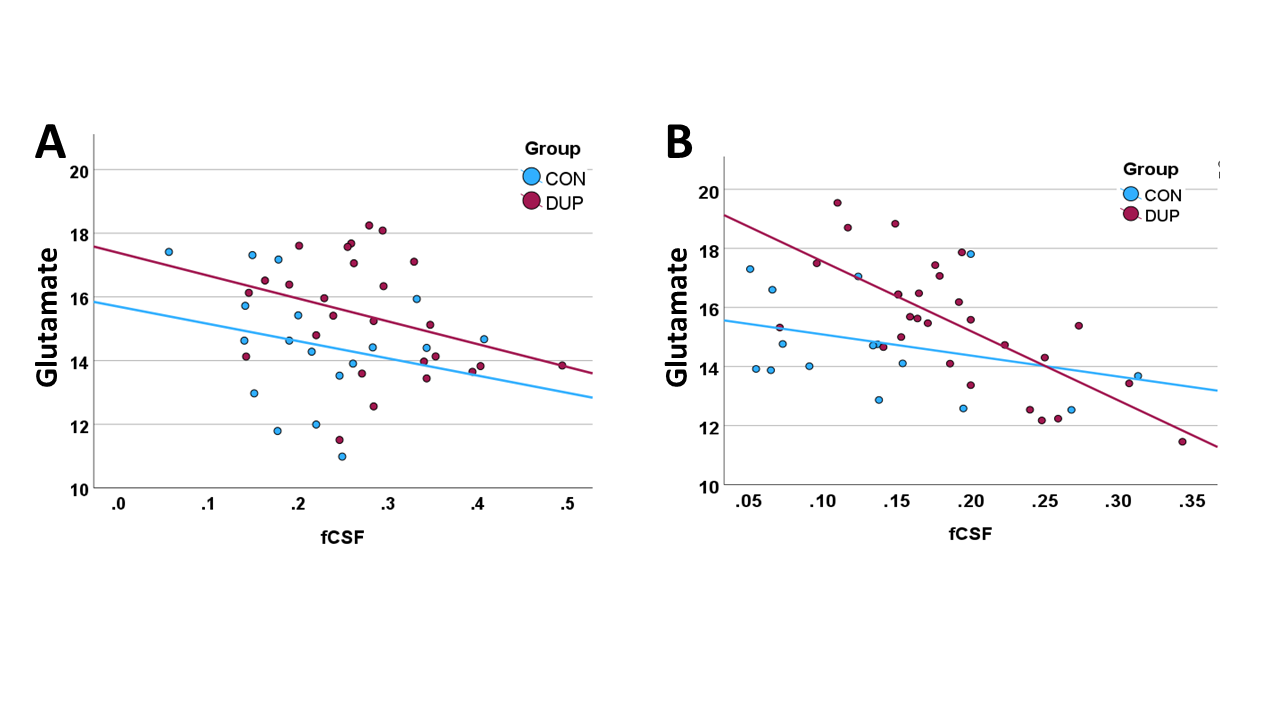
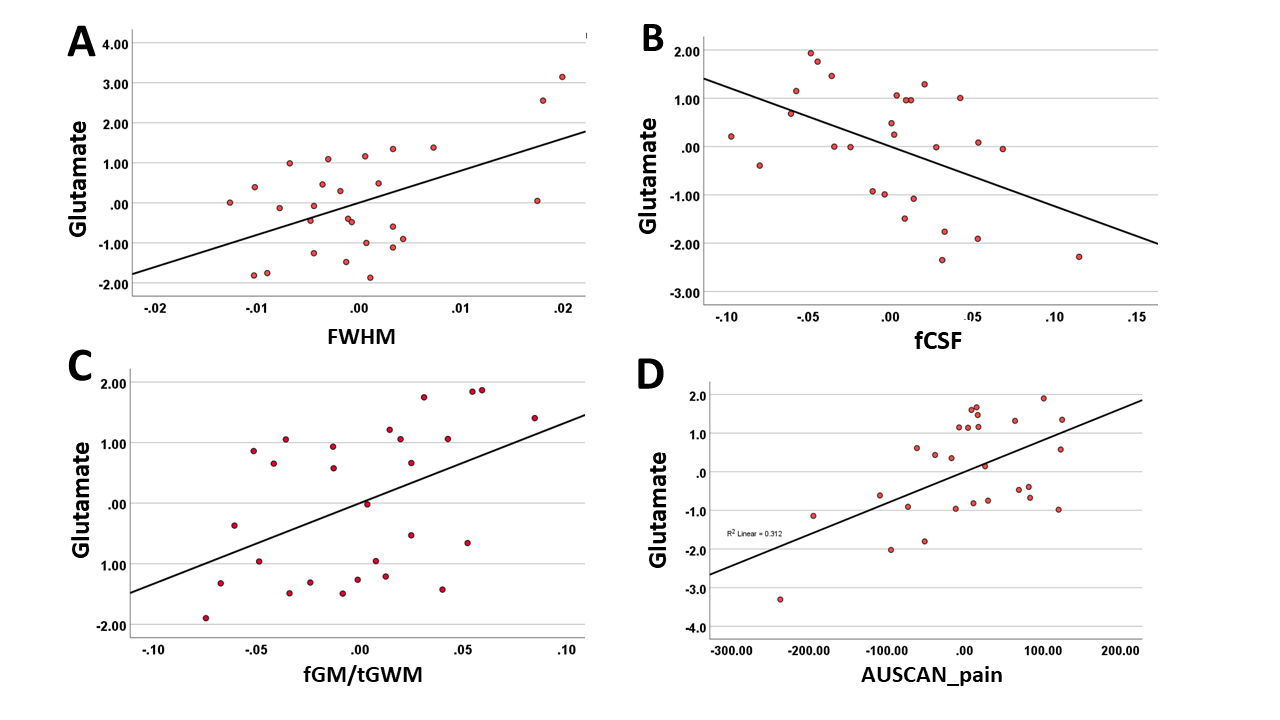
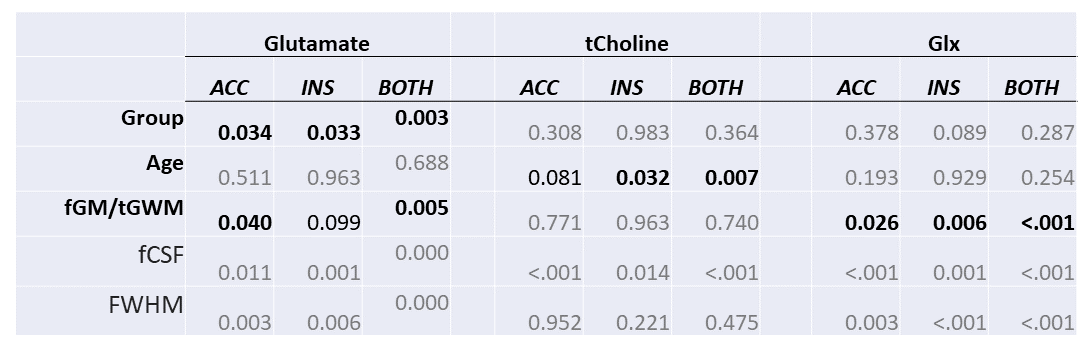
Uncorrected Glutamate levels inversely correlated with fCSF with higher levels in patients (Fig 3). GLM with covariates of FWHM, fCSF, fGM/tGWM and age was used to assess group differences (patient v. controls) of metabolites for the two regions independently and combined, key results in Table 1. GLM with AUSCAN_pain as an additional covariate showed a significant correlation to the Insular Glu, shown as a partial linear regression in Fig 4.
DISCUSSION
Although Eq 1 is non-linear, over a typical range of partial volumes and tissue characteristics our data suggests a simple linear statistical model can be used, that includes tissue fractions and experimental factors, to assess group differences of metabolites. If there are no pathological effects that significantly alter the tissue Ri between groups, this approach avoids the need for their accurate estimation, and systematic errors in fCSF are not propagated. Note that since fCSF shows an increase with age due to atrophy, a systematic fCSF error will create a scaling factor error (Fig 2C), hence the result in Fig 1A. This has potential for false correlation of metabolite with age when using Eq 1 to directly estimate a "tissue corrected" concentration.Our analysis suggest elevated Glu in both INS and ACC and correlation with pain in osteoarthritis patients, in agreement with other studies with different causes of pain.1-4
Acknowledgements
This work was supported by The Rosetrees’ Trust, grant number M11-F1, by the UK National Institute of Health (NIHR) Clinical Research NetworkReferences
1. Peak et al. Brain GABA and glutamate levels across pain conditions: A systematic literature review and meta-analysis of 1H-MRS studies using the MRS-Q quality assessment tool. NeuroImage 210 (2020) 116532.
2. Zunhammer et al. Combined glutamate and glutamine levels in pain-processing brain regions are associated with individual pain sensitivity. PAIN 157 (2016) 2248–2256
3. Gussew et al. 1H-MR spectroscopic detection of metabolic changes in pain processing brain regions in the presence of non-specific chronic low back pain. NeuroImage 54 (2011) 1315–1323.
4. Harris et al. Elevated Insular Glutamate in Fibromyalgia Is Associated With Experimental Pain. ARTHRITIS & RHEUMATISM 60 (2009) 3146-3152
5. Gasparovic et al. Use of Tissue Water as a Concentration Reference for Proton Spectroscopic Imaging. Magnetic Resonance in Medicine 55:1219 –1226 (2006)
6. Gasparovic et al. Errors in 1H‐MRS estimates of brain metabolite concentrations caused by failing to take into account tissue‐specific signal relaxation. NMR in Biomedicine. 2018;31:e3914.
7. Gogishvili et al. Quantification of the neurochemical profile of the human putamen using STEAM MRS in a cohort of elderly subjects at 3Tand 7T: Ruminations on the correction strategy for the tissue voxel composition. PLOS ONE |https://doi.or g/10.1371/journal.pone.0286633
8. Sofat et al. The effect of pregabalin or duloxetine on arthritis pain: a clinical and mechanistic study in people with hand osteoarthritis. Journal of Pain Research 2017:10 2437–2449.
Figures