2997
Investigation of Clear Cell Renal Cell Carcinoma Grades using Diffusion Relaxation Correlation Spectroscopic Imaging with Optimized Analysis1Department of Radiology, Renji Hospital, School of Medicine, Shanghai Jiao Tong University, Shanghai, China, 2MR Research Collaboration, Siemens Healthineers, City, China, Shanghai, China
Synopsis
Keywords: Segmentation, Kidney
Motivation: The evaluation of diffusion-relaxation correlation spectrum imaging (DR-CSI) without prior knowledge has not been investigated.
Goal(s): To differentiate high-grade from low-grade clear cell renal cell carcinoma using DR-CSI spectra in an equal separating analysis.
Approach: The DR-CSI spectrum was segmented into multiple equal subregions from 2*2 to 9*9 and was evaluated based on their accuracy and repeatability.
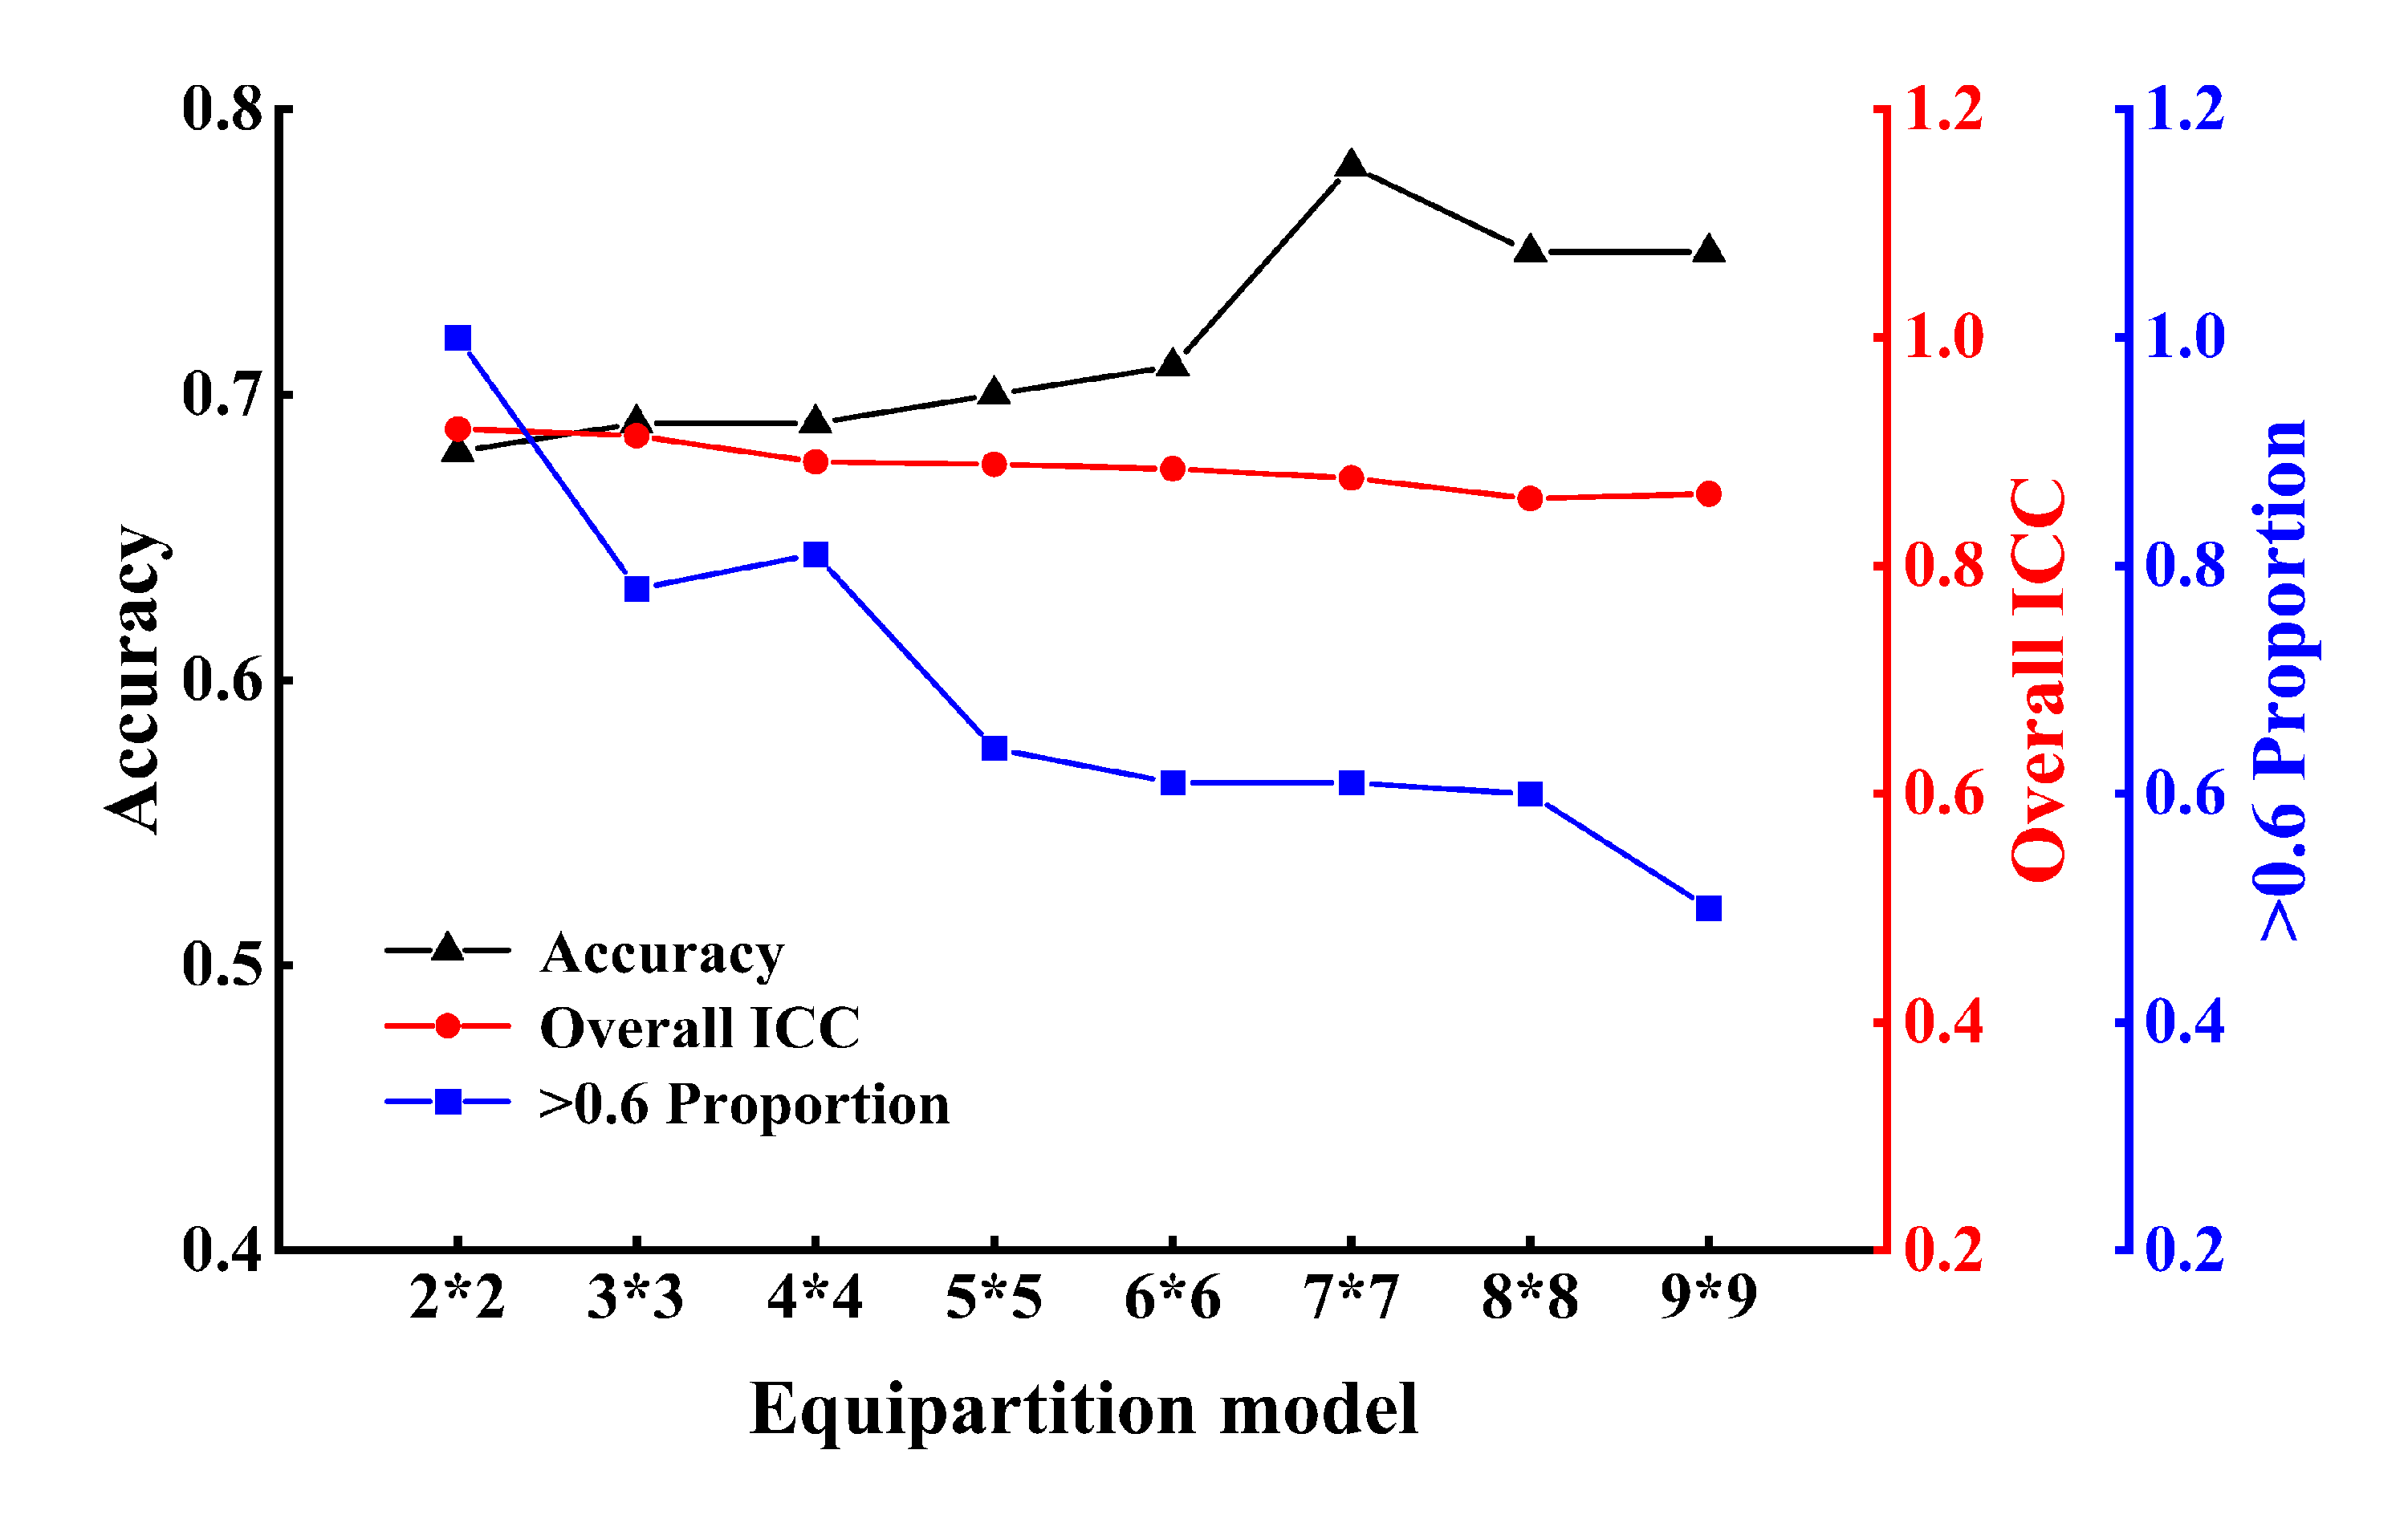
Results: Interreader agreement decreased as divisions in the equipartition model increased (from 0.859 to 0.920). Accuracy increased from 2x2 to 9x9 model (0.68 for 2x2, 0.69 for 3x3 and 4x4, 0.70 for 5x5, 0.71 for 6x6, 0.78 for 7x7, and 0.75 for 8x8 and 9x9).
Impact: This study validated an method for extracting information from DR-CSI spectra based on the differentiation of high-grade from low-grade ccRCC without prior knowledge. It provides a reference for processing DR-CSI spectra, helping this technology be applied to other clinical scenarios.
Introduction
Recently, a novel method known as diffusion-relaxation correlation spectroscopic imaging (DR-CSI), stemming from the concept of multidimensional correlated MRI, has been developed to resolve intravoxel tissue information[1]. Previous studies have observed that the segmentation methods utilized were rather rudimentary and lacked a thorough evaluation[2-4]. This necessitated the use of prior knowledge and undefined methods for distinguishing between various peaks, making the application both challenging and complex. Therefore, it is essential to establish a comprehensive process and investigate a more generalized method for optimizing DR-CSI spectrum analysis, making it applicable to a wider range of clinical applications. Theoretically, a strategy that segments the entire spectrum into multiple equal subregions holds the potential for significant benefits. This approach would allow us to evaluate the diagnostic performance of these equally partitioned models based on their accuracy and repeatability without sacrificing potentially valuable spectral information.The primary objective of this study was to investigate the feasibility of implementing a partitioning strategy for discriminating between high-grade and low-grade clear cell renal cell carcinoma (ccRCC) using DR-CSI spectra.
Methods
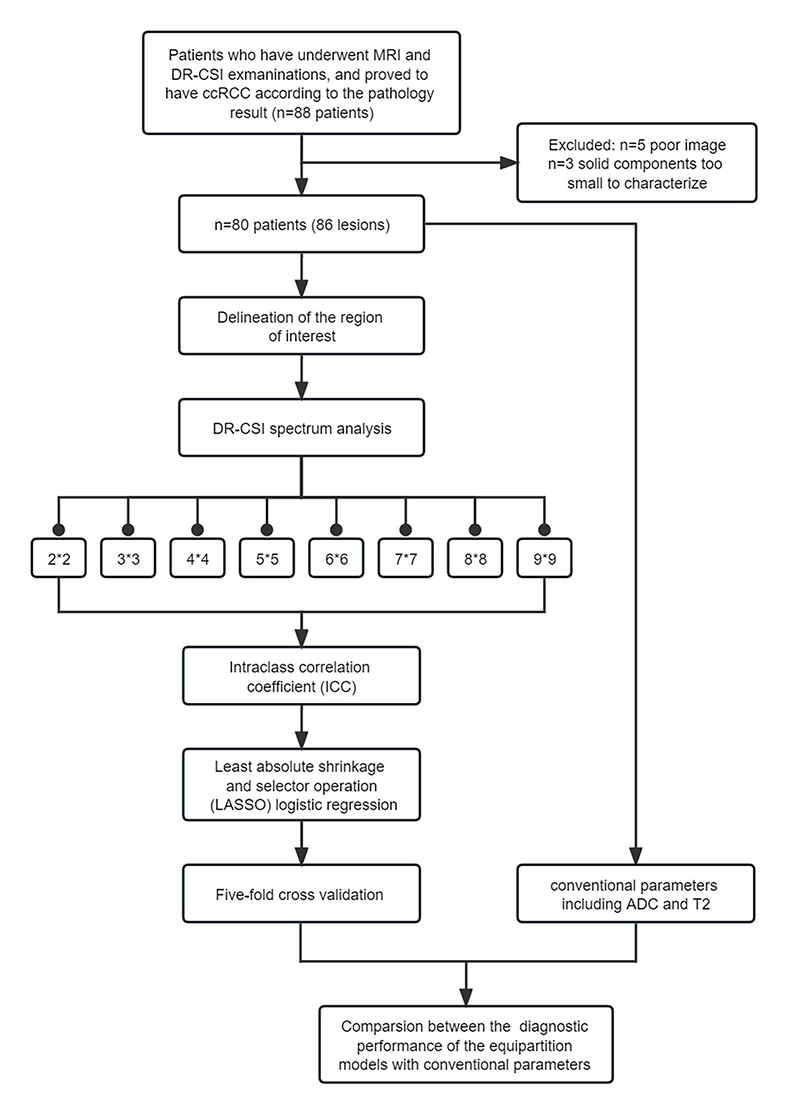
Eighty consecutive patients with 86 pathologically confirmed ccRCCs who underwent DR-CSI were enrolled in this study. Two radiologists delineated the region of interest (ROI). The spectrum was derived based on DR-CSI and was further segmented into multiple equal subregions from 2*2 to 9*9. The agreement between the two radiologists was assessed using the intraclass correlation coefficient (ICC). Logistic regression was employed to establish a regression model for differentiation, and fivefold cross-validation was used to evaluate its accuracy. McNemar’s test was conducted to compare the diagnostic performance between equipartition models and the traditional parameters, including the apparent diffusion coefficient (ADC) and T2 value (Figure 1).Results
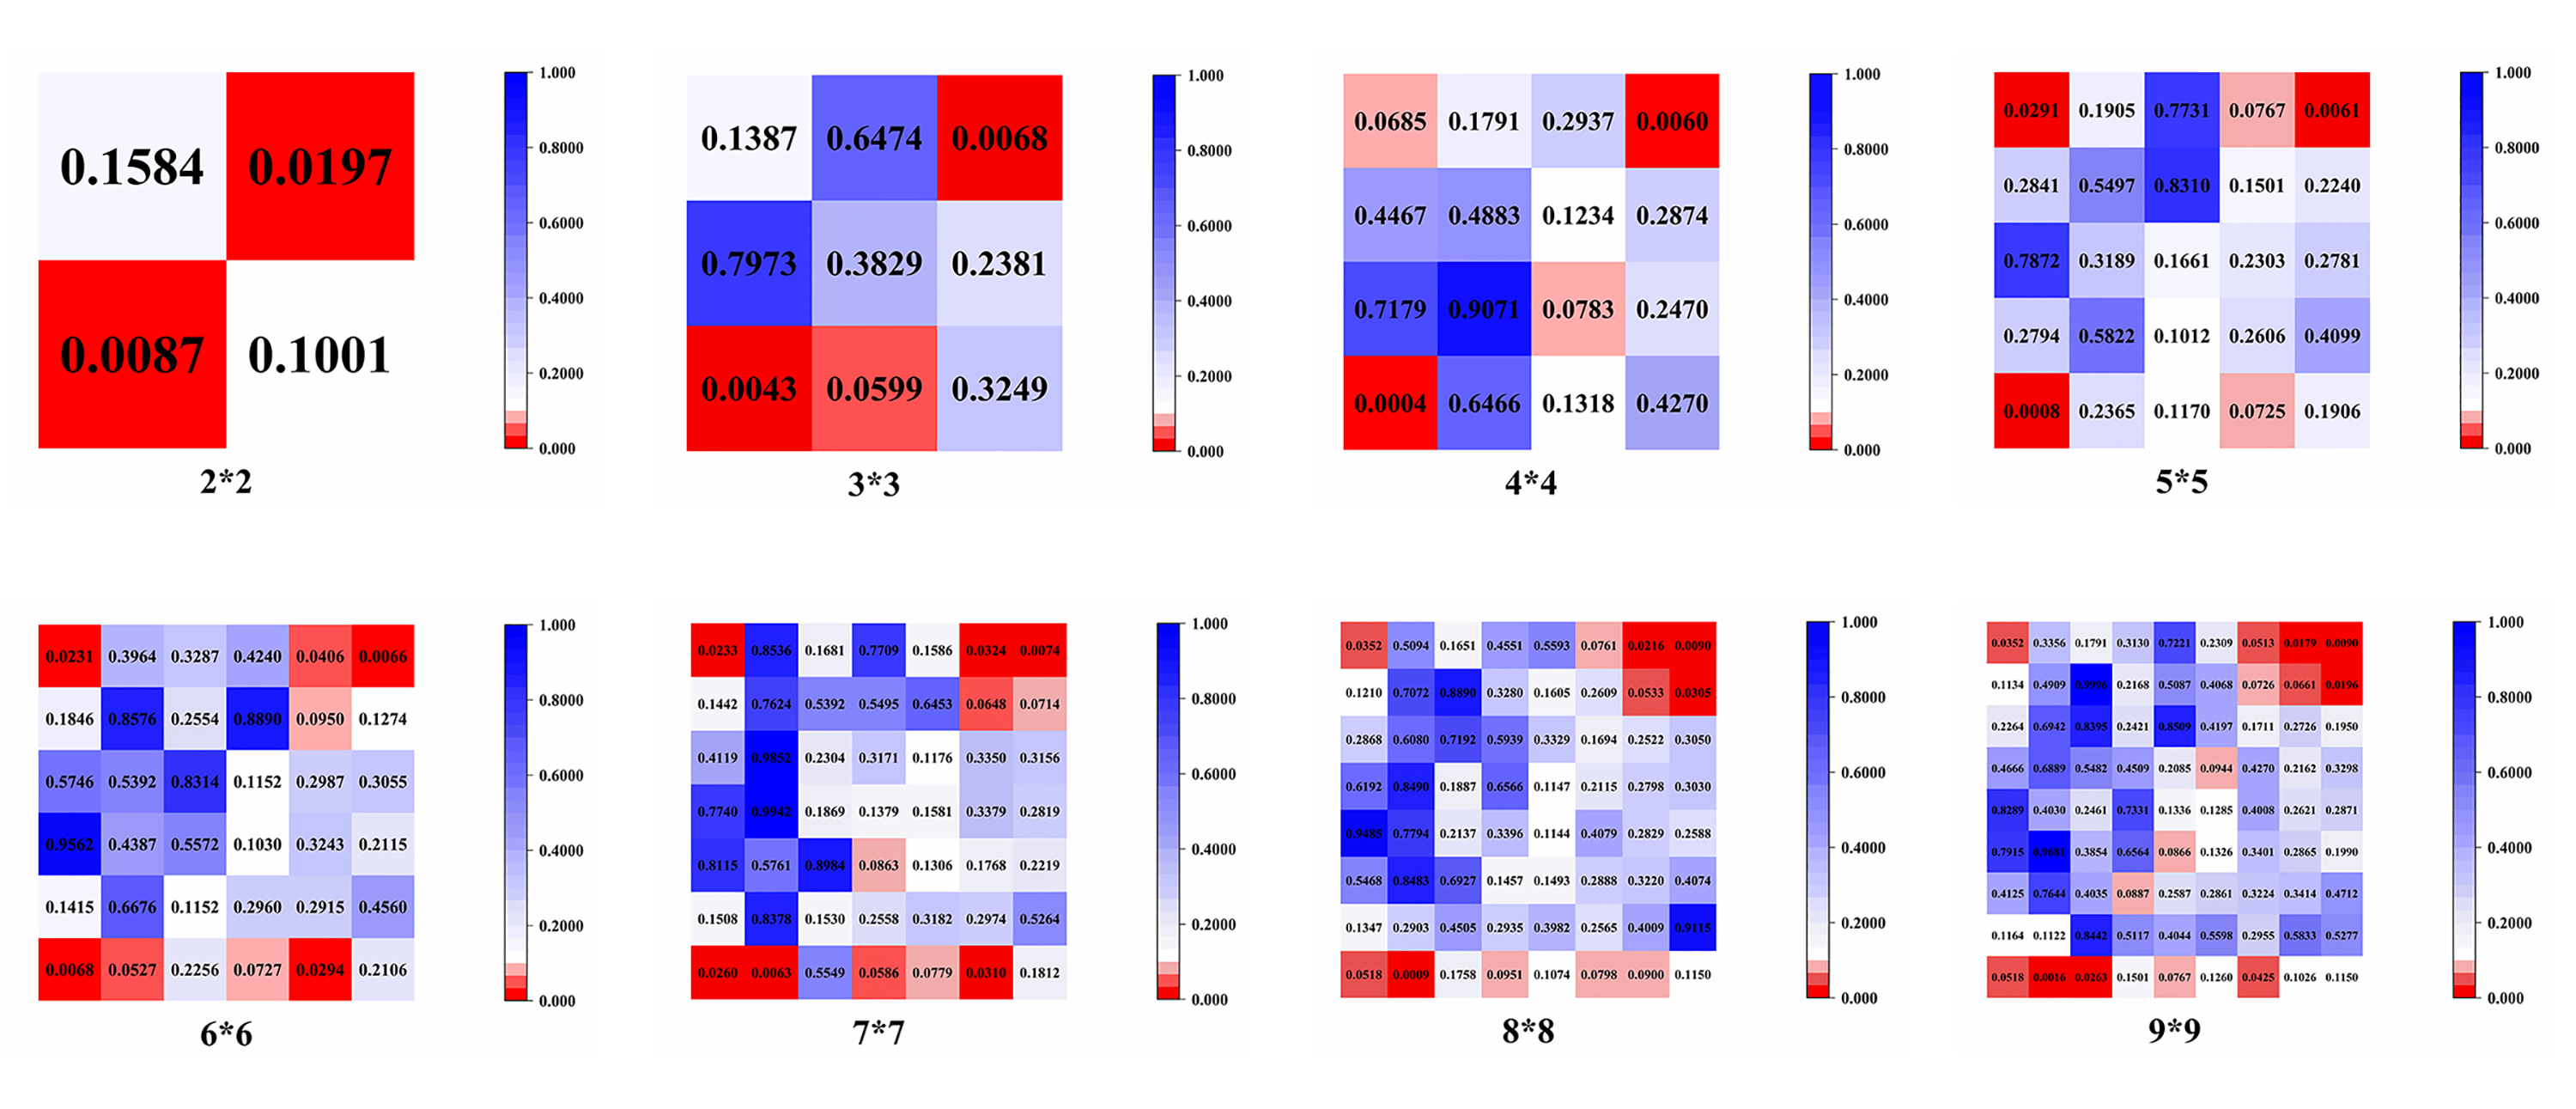
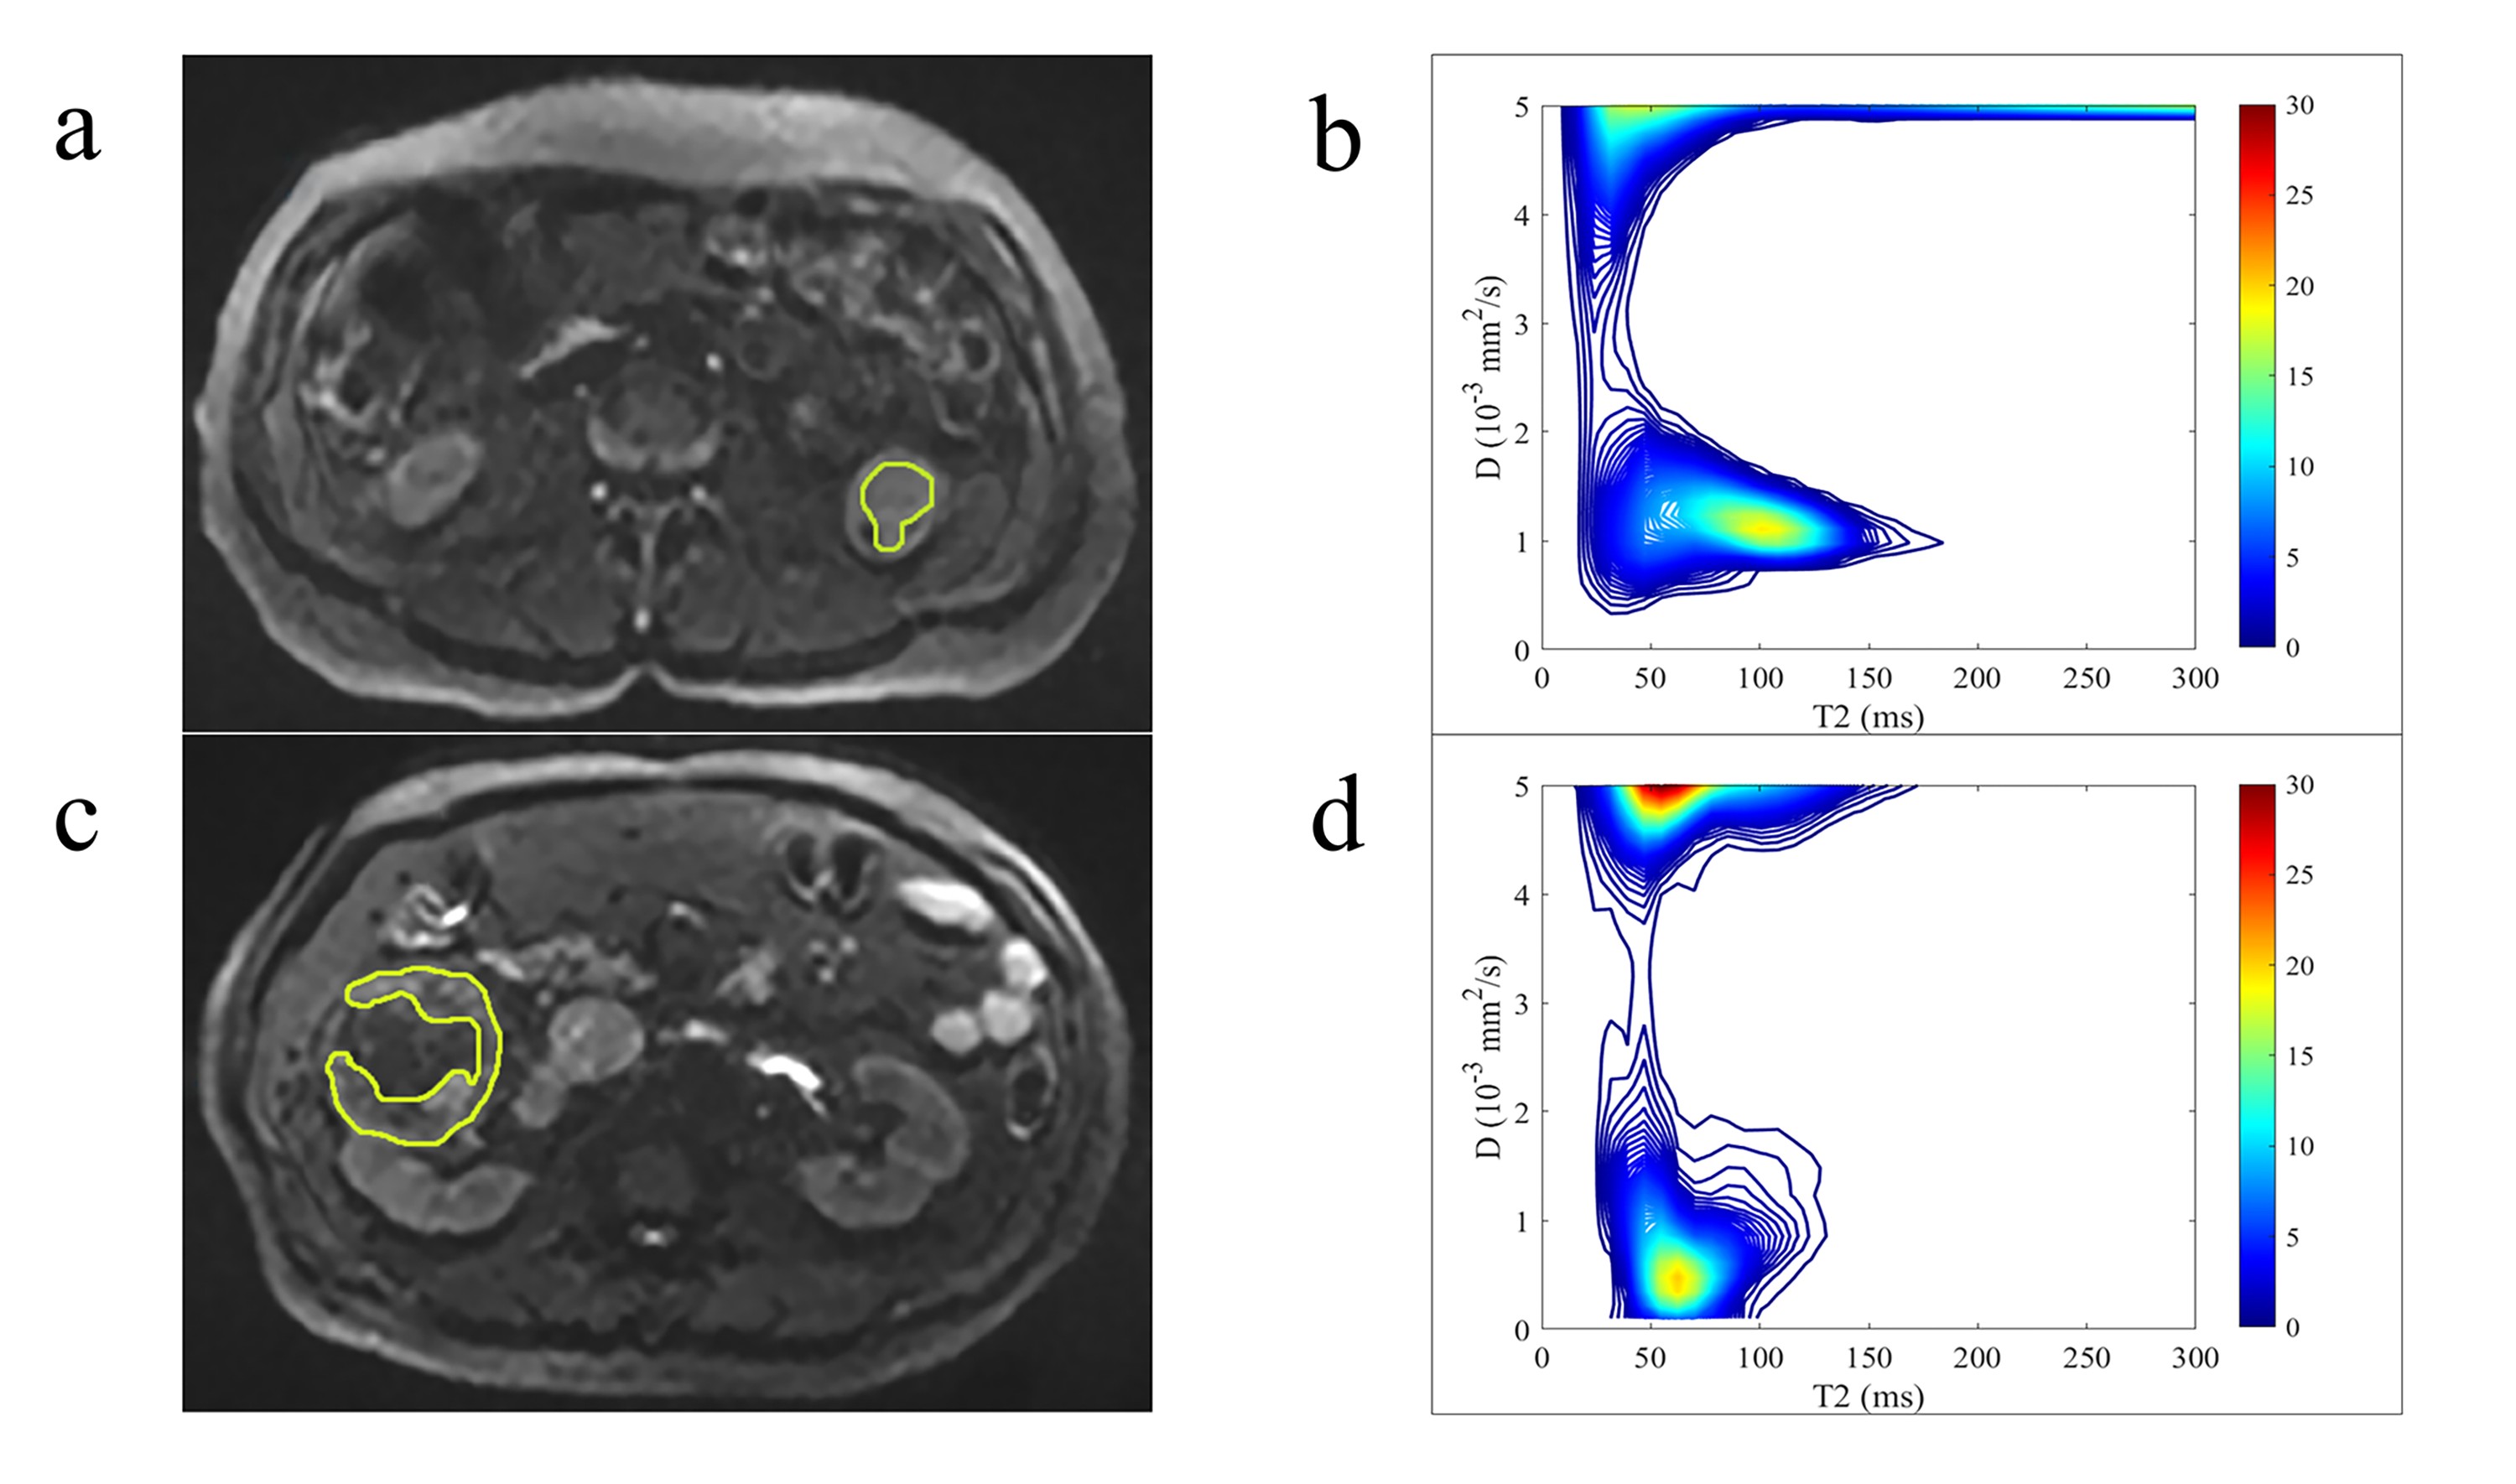
The ICCs of the equipartition models from 2x2 to 9x9 were calculated and found to decrease as the number of subregions increased. The proportions of subregions with ICC values greater than 0.6 from 2x2 to 9x9 were also decreased, 1, 0.78, 0.81, 0.64, 0.61, 0.61, 0.6 and 0.5, respectively. Five-fold cross validation showed that the accuracy of the 7x7 model was significantly higher than that of the ADC and T2 (7x7 vs. ADC, p=0.002; 7x7 vs. T2, p=0.001; 8x8 and 9x9 vs. ADC, p=0.008; 8x8 and 9x9 vs. T2, p=0.004). However, the accuracies of 2x2, 3x3, 4x4, 5x5 and 6x6 were not significantly different from ADC and T2 (2x2 vs. ADC, p=1; 2x2 vs. T2, p=0.500. 3x3 and 4x4 vs. ADC, p=0.500; 3x3 and 4x4 vs. T2, p=0.250. 5x5 vs. ADC, p=0.250; 5x5 vs. T2, p=0.125. 6x6 vs. ADC, p=0.125; 6x6 vs. T2, p=0.063). Notably, the differences in the ability of 7x7 to distinguish between high- and low-grade ccRCC were significantly superior to 2x2-6x6 (7x7 vs. 2x2-6x6, all p<0.031), but 7x7 was not significantly different from 8x8 and 9x9 (p=0.500)(Figure 2). Figure 3 shows the significance of every subregion in different equipartition models. Typical examples of high- and low-grade ccRCC DR-CSI spectra were also processed (Figure 4).Discussion
In this study, the equipartition method was employed to assess its feasibility in the application of the DR-CSI spectrum for differentiating between high-grade and low-grade ccRCC.The process of separating individual spectral peaks and assigning them to specific features of the tissue microstructure in DR-CSI spectra is a challenging task. In our regression model, we identified features that were consistent across all equipartition models. This indicates that our equipartition method is capable of identifying features that have clinical relevance. The extracted features in the 7x7 image serve as an illustrative example for the interpretation of DR-CSI spectrum. These subregions can provide practical information that is in line with previous imaging and histopathologic findings.
Some limitations should be acknowledged. Firstly, while we combined specific b and TE values in our study, the optimal combination of parameters is yet to be determined. Secondly, the long acquisition time of DR-CSI could lead to motion artifacts and increase processing cost, which may limit its generalizability. Further research is necessary to explore this topic.
Conclusion
In conclusion, the equipartition method has the potential to analyze the DR-CSI spectrum and discriminate between high-grade and low-grade ccRCC without prior knowledge. This study provides a separating method as a reference template for processing DR-CSI spectra, which could make this technology widely applicable in other clinical scenarios and feasible.Acknowledgements
NoneReferences
1. Kim D, Doyle EK, Wisnowski JL, Kim JH, Haldar JP. Diffusion-relaxation correlation spectroscopic imaging: A multidimensional approach for probing microstructure. Magn Reson Med. 2017;78:2236-49.
2. Zhang Z, Wu HH, Priester A, Magyar C, Afshari Mirak S, Shakeri S, et al. Prostate Microstructure in Prostate Cancer Using 3-T MRI with Diffusion-Relaxation Correlation Spectrum Imaging: Validation with Whole-Mount Digital Histopathology. Radiology. 2020;296:348-55.
3. Wei X, Zhu L, Zeng Y, Xue K, Dai Y, Xu J, et al. Detection of prostate cancer using diffusion-relaxation correlation spectrum imaging with support vector machine model - a feasibility study. Cancer imaging : the official publication of the International Cancer Imaging Society. 2022;22:77.
4. Liu F, Hu W, Sun Y, Shen Y, Zhou W, Dai Y, et al. Exploration of Interstitial Fibrosis in Chronic Kidney Disease by Diffusion-Relaxation Correlation Spectrum MR Imaging: A Preliminary Study. Journal of magnetic resonance imaging : JMRI. 2022.
Figures