2995
MP-PCA denoising of kinetic 13C-MR spectra of human liver: performance analysis for synthetic and in vivo data1Magnetic Resonance Methodology, Institute of Diagnostic and Interventional Neuroradiology, University of Bern, Bern, Switzerland, Bern, Switzerland, 2Translational Imaging Center, Sitem-insel, Bern, Switzerland, Bern, Switzerland, 3CIBM Center for Biomedical Imaging, Switzerland, Lausanne, Switzerland, 4Animal Imaging and Technology, EPFL, Lausanne, Switzerland, Lausanne, Switzerland, 5Insel Hospital, University Hospital Bern, Department of Diabetes, Endocrinology, Nutritional Medicine and Metabolism UDEM, Bern, Switzerland, Bern, Switzerland
Synopsis
Keywords: Data Processing, Sparse & Low-Rank Models, liver, 13C-MRS, denoising, MP-PCA, 7T, human, metabolism
Motivation: Need to improve determination of kinetics for low-concentration metabolites using X-nuclear MRS.
Goal(s): Investigate potential benefits of denoising by Marchenko-Pastur Principal Component Analysis (MP-PCA) for extracting natural-abundance glycogen kinetics from 13C-MRS data.
Approach: MP-PCA applied on synthetic and human in-vivo hepatic 13C-MRS time-course datasets.
Results: MP-PCA substantially improves apparent SNR and reduces mean linear regression residuals, without introducing bias in slope estimates. MP-PCA is shown to be valuable for the determination of unknown physiologic time-courses of low-concentrated glycogen signals; here, specifically enabling use of lower D-glucose loads in combined deuterium metabolic imaging and 13C-MRS evaluations of hepatic glucose metabolism.
Impact: Our findings on MP-PCA's efficacy in enhancing the determination of glycogen kinetics by 13C-MRS broaden the understanding of denoising techniques in MR spectroscopy and ultimately impact researchers and clinicians who develop, assess, or apply MR techniques suffering from low SNR.
Introduction
13C-MRS is a well-established method for quantification of natural abundance glycogen concentrations in skeletal muscle and liver. The measurement of the variation in glycogen content and its determinants is of major interest in health1,2 and disease3–5. Monitoring of glucose (Glc) and glycogen levels after oral administration of D-Glc allows to dynamically assess hepatic Glc metabolism using interleaved deuterium metabolic imaging and 13C-MRS6,7. 13C-MRS is strongly limited by SNR and observation of physiologic changes of glycogen content is challenging, especially for modest Glc loads.Marchenko-Pastur Principal Component Analysis (MP-PCA)8 is a data-driven denoising technique that benefits from an objective rank selection. MP-PCA leverages the multidimensional structure of MRS data to separate redundant and correlated contributions across spectra from Gaussian noise. It has been applied to various MR settings9–13, all characterized by high redundancy and constant noise. Though both requirements are met for series of 13C-MR spectra, a thorough investigation is required of whether relevant signal information might be discarded with the noise-attributed principal components (PCs) or spurious features introduced. Our aim is to assess the potential benefit of MP-PCA denoising for extraction of glycogen kinetics from 13C-MRS time series.
Methods
MR setting: 7T system (Terra, Siemens) with triple-tuned surface coil (Rapid Biomedical).In-vivo data: acquisition with a 13C pulse-and-acquire sequence (adiabatic excitation, TR 600ms, 256 acquisitions, NOE but no decoupling 1H-irradiation, acquisition time 2:34min) to capture 26 time-points until 150 minutes after D-Glc administration. Data processing and fitting with jMRUI14 and Fitaid15. In a IRB-approved study, ten healthy subjects received oral Glc loads of 60g (~0.75g/kg), and three subjects ingested lower amounts of 20g (0.25 g/kg) or 10g (0.15 g/kg).
Synthetic data: glycogen signal fitted and removed from a set of 26 in-vivo 13C-MR spectra. A scaled glycogen signal (obtained from the averaged fitted glycogen) was then reintroduced into the kinetic dataset to create a well-defined artificial linear glycogen increase or decrease (±0.5%,±1.0%,±2.5%,±5.0%,±10%,±25% of the original averaged glycogen signal) with spectra equally-spaced over time.
MP-PCA: for each dataset, complex-valued FIDs were Fourier-transformed and structured into a matrix. The first dimension of the matrix corresponds to the concatenation of the temporal course of real and imaginary spectral points and the second dimension is the spectral ppm-scale; resulting in a 52x1200 matrix, which was centered column-wise before MP-PCA. Statistical analysis included linear timecourse regression and t-tests between original and denoised data.
Results and Discussion
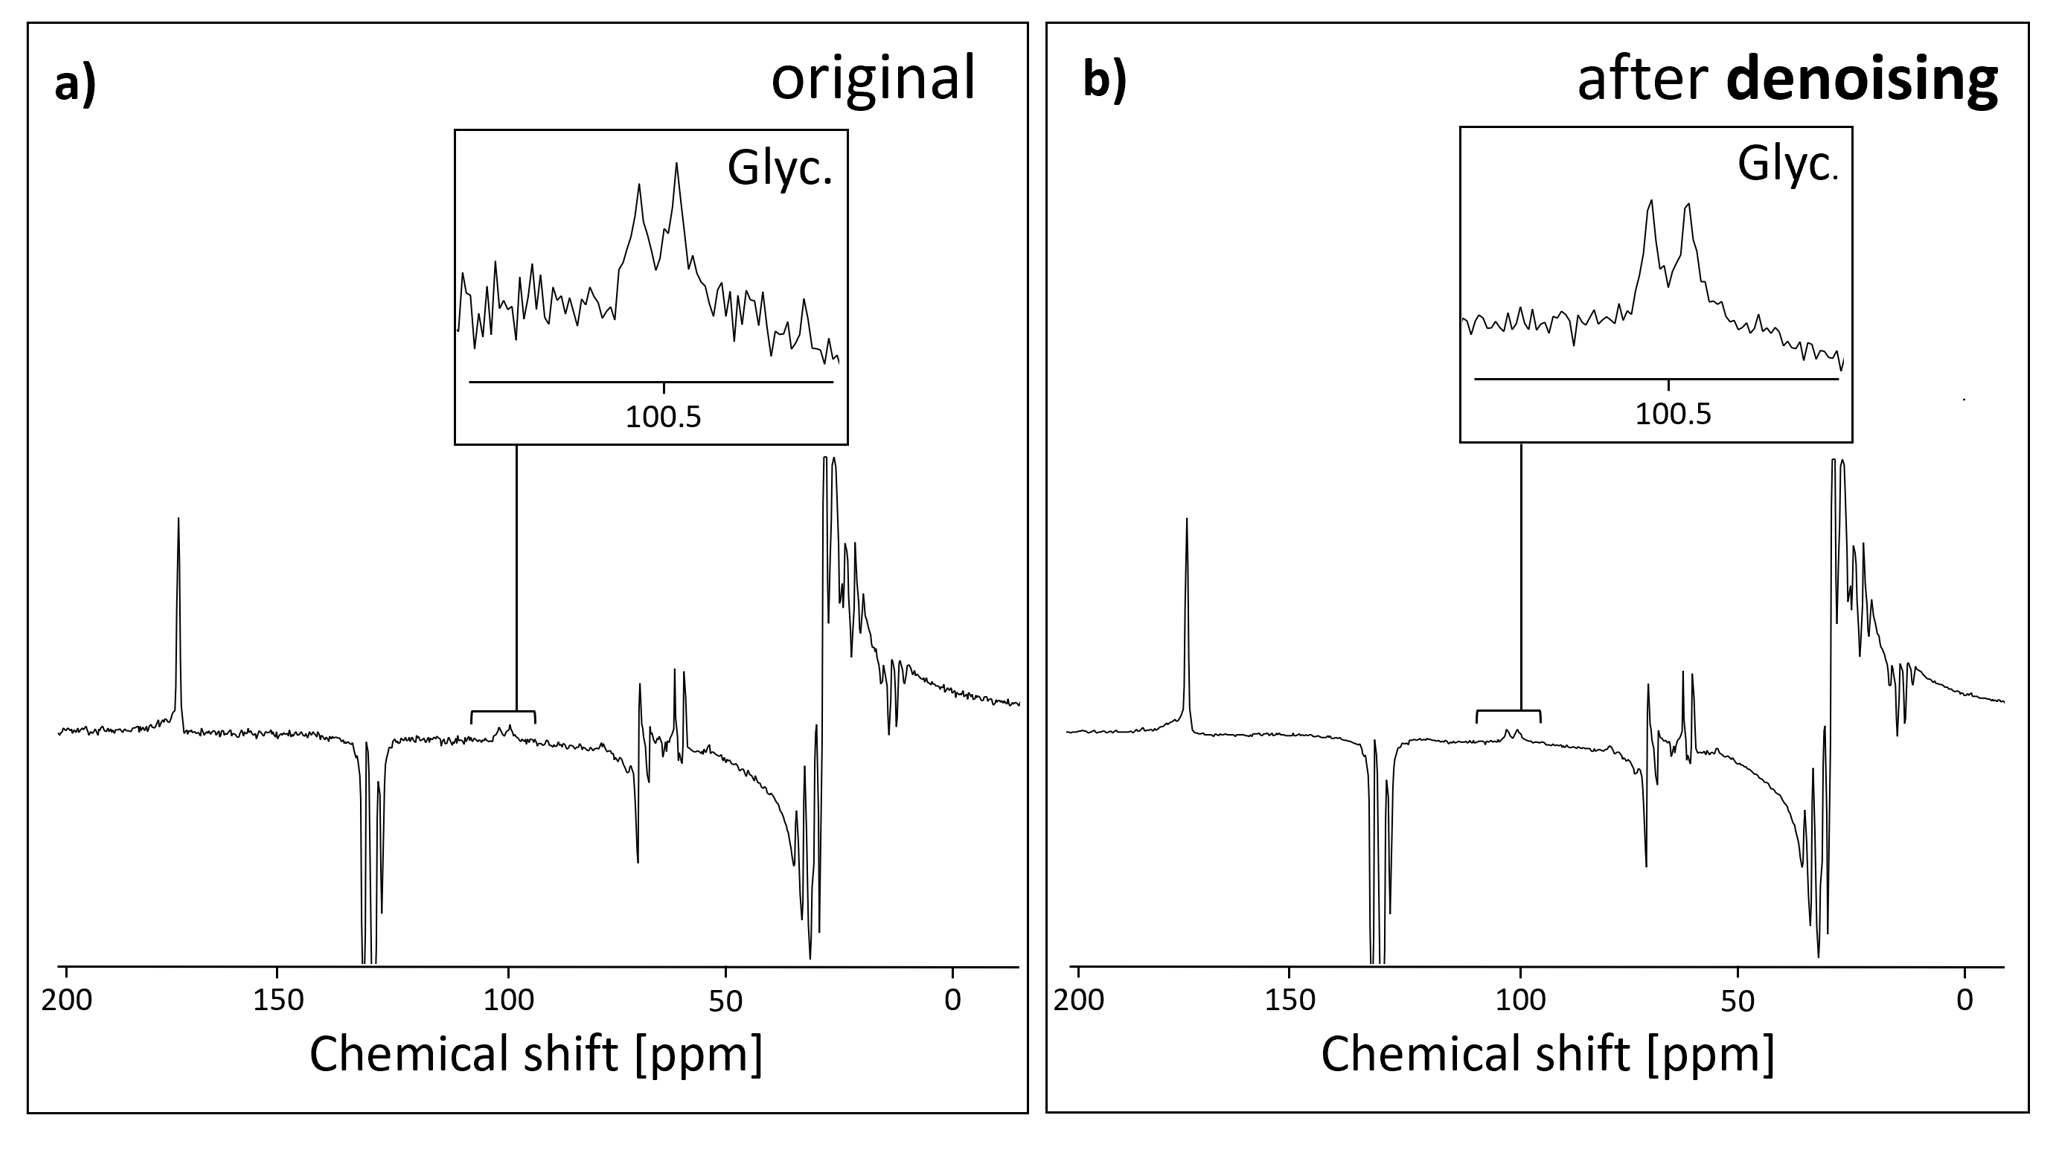
Fig-1 shows sample spectra. Averaged apparent glycogen SNR in frequency domain is 7.0±0.4 for original and 11.1±1.0 for denoised spectra. The doublet can be well fitted using prior knowledge of a doublet with predefined splitting, each line consisting of two Lorentzian components (60 and 150Hz width).MP-PCA found 7 PCs for the synthetic datasets, 10±4 for the in-vivo spectra with 60g-intake, and 6±4 for the low-dose cases.
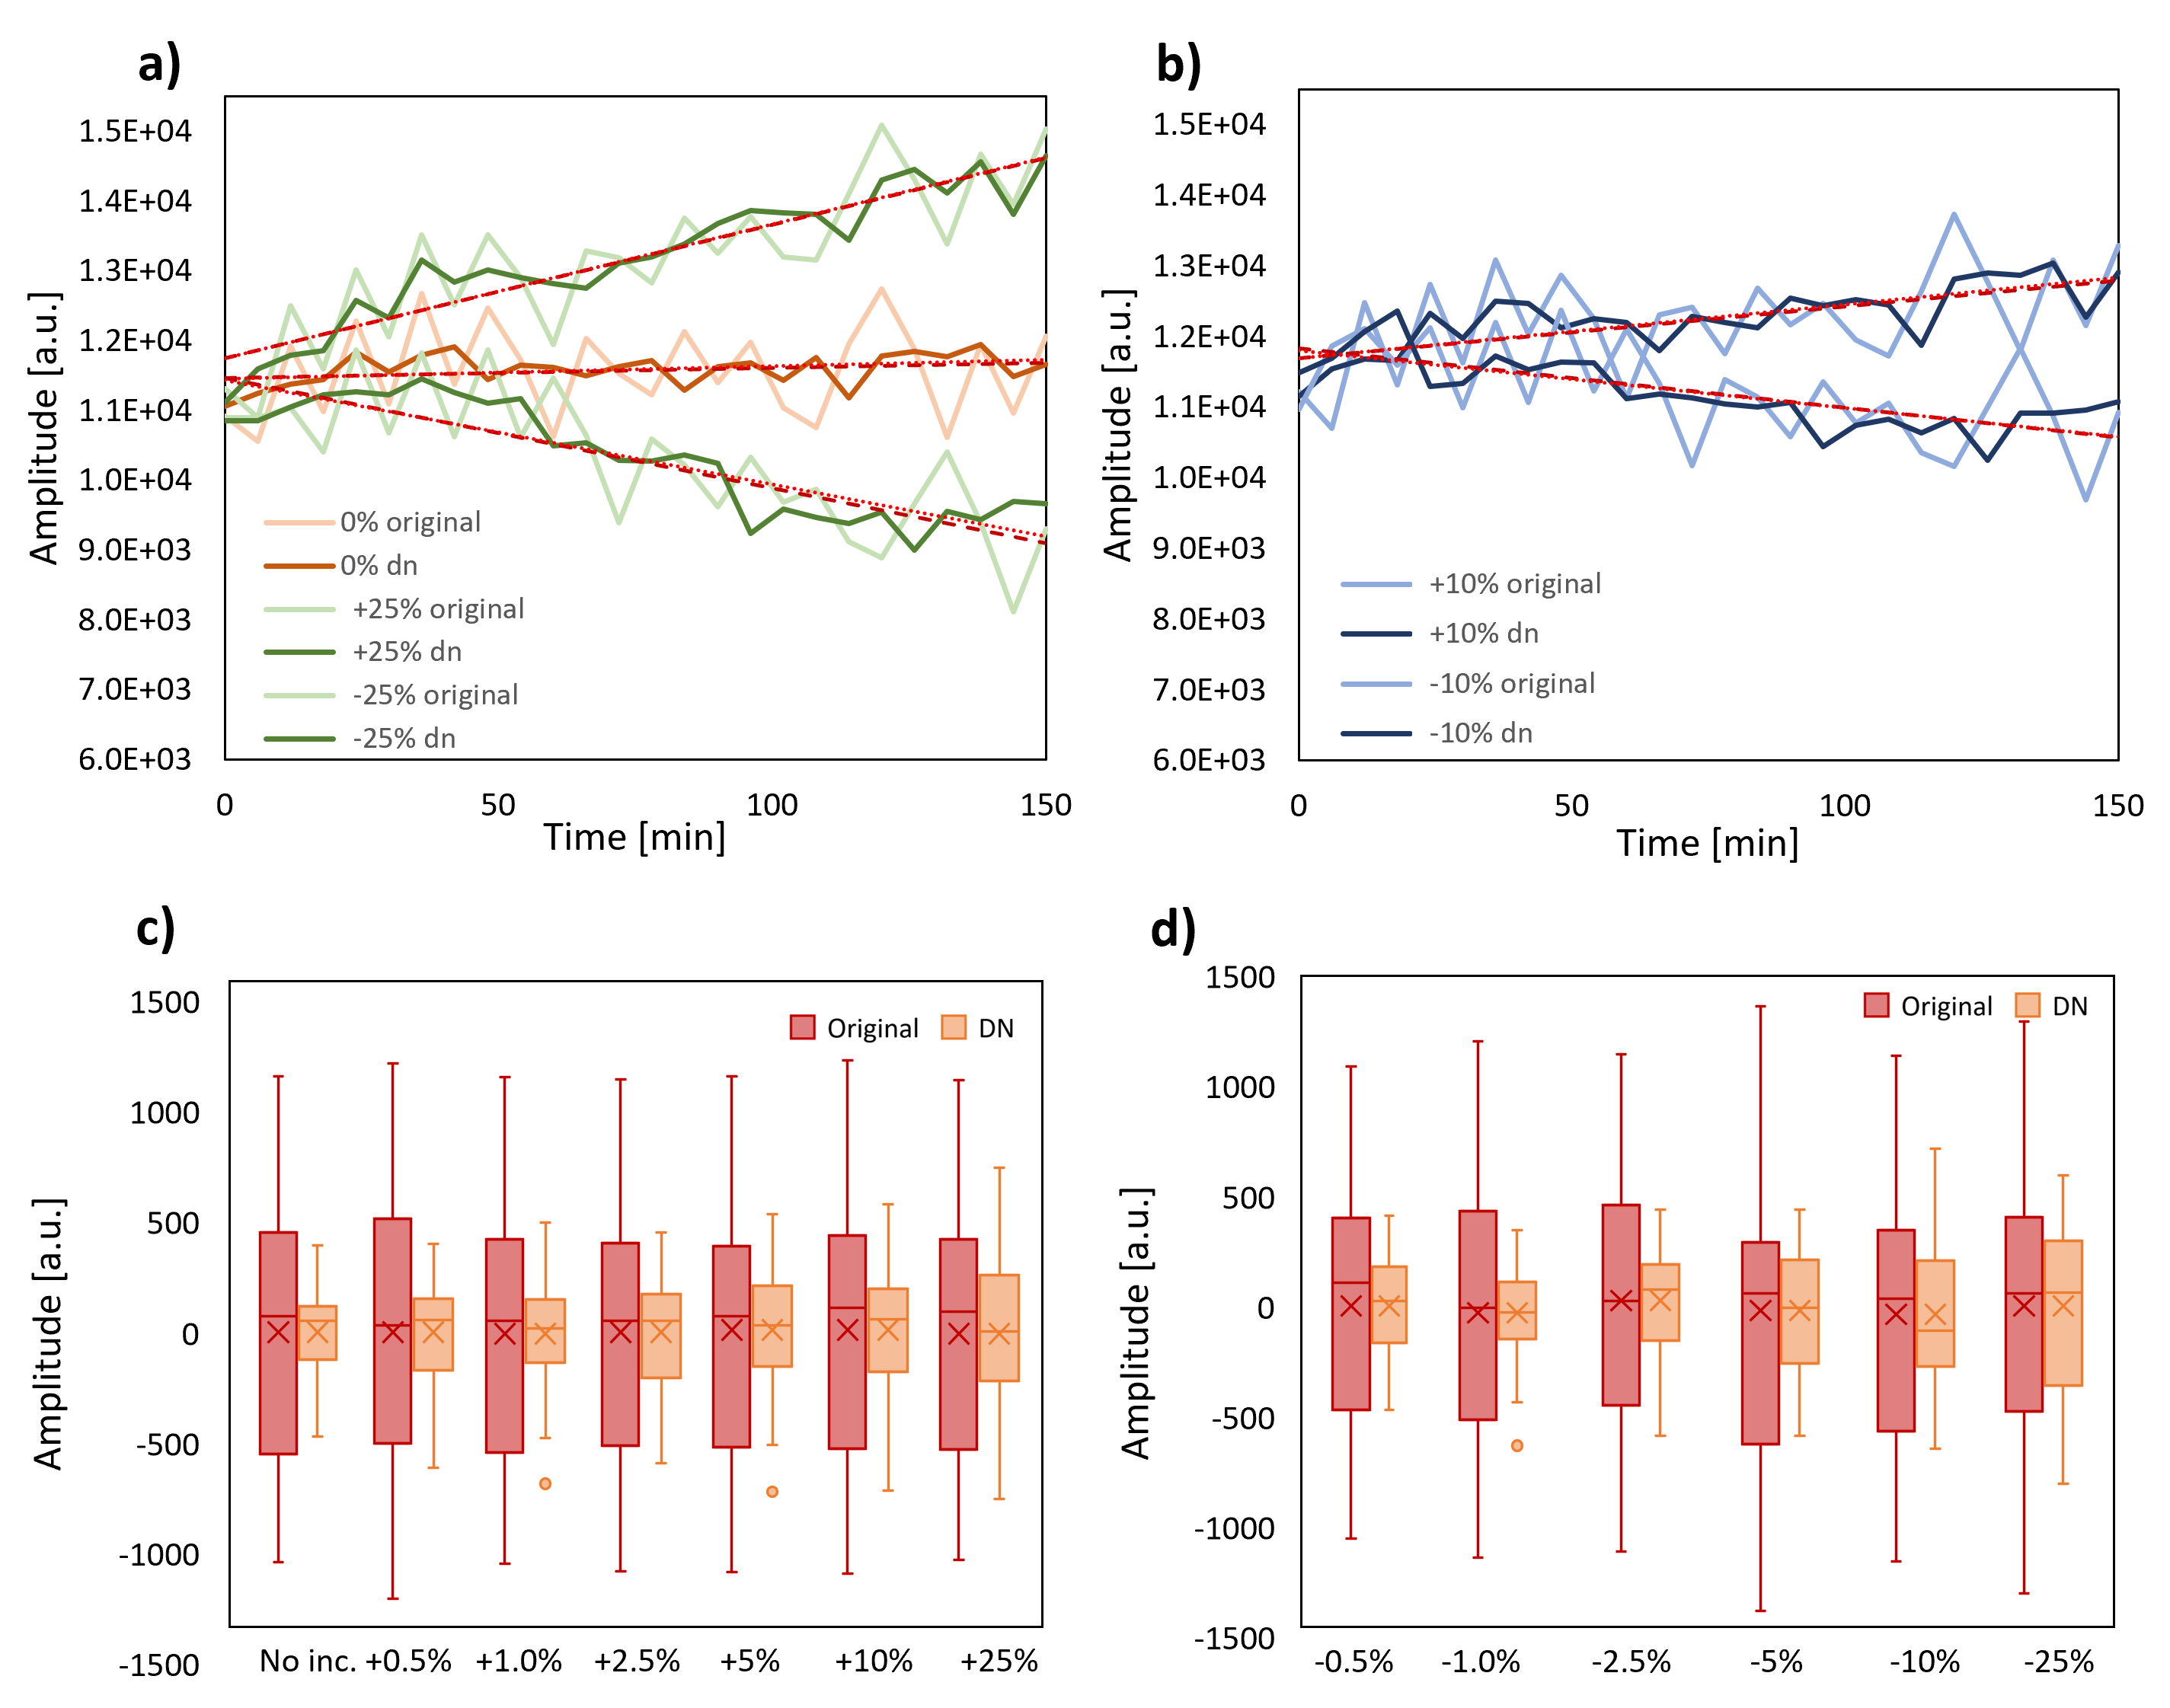
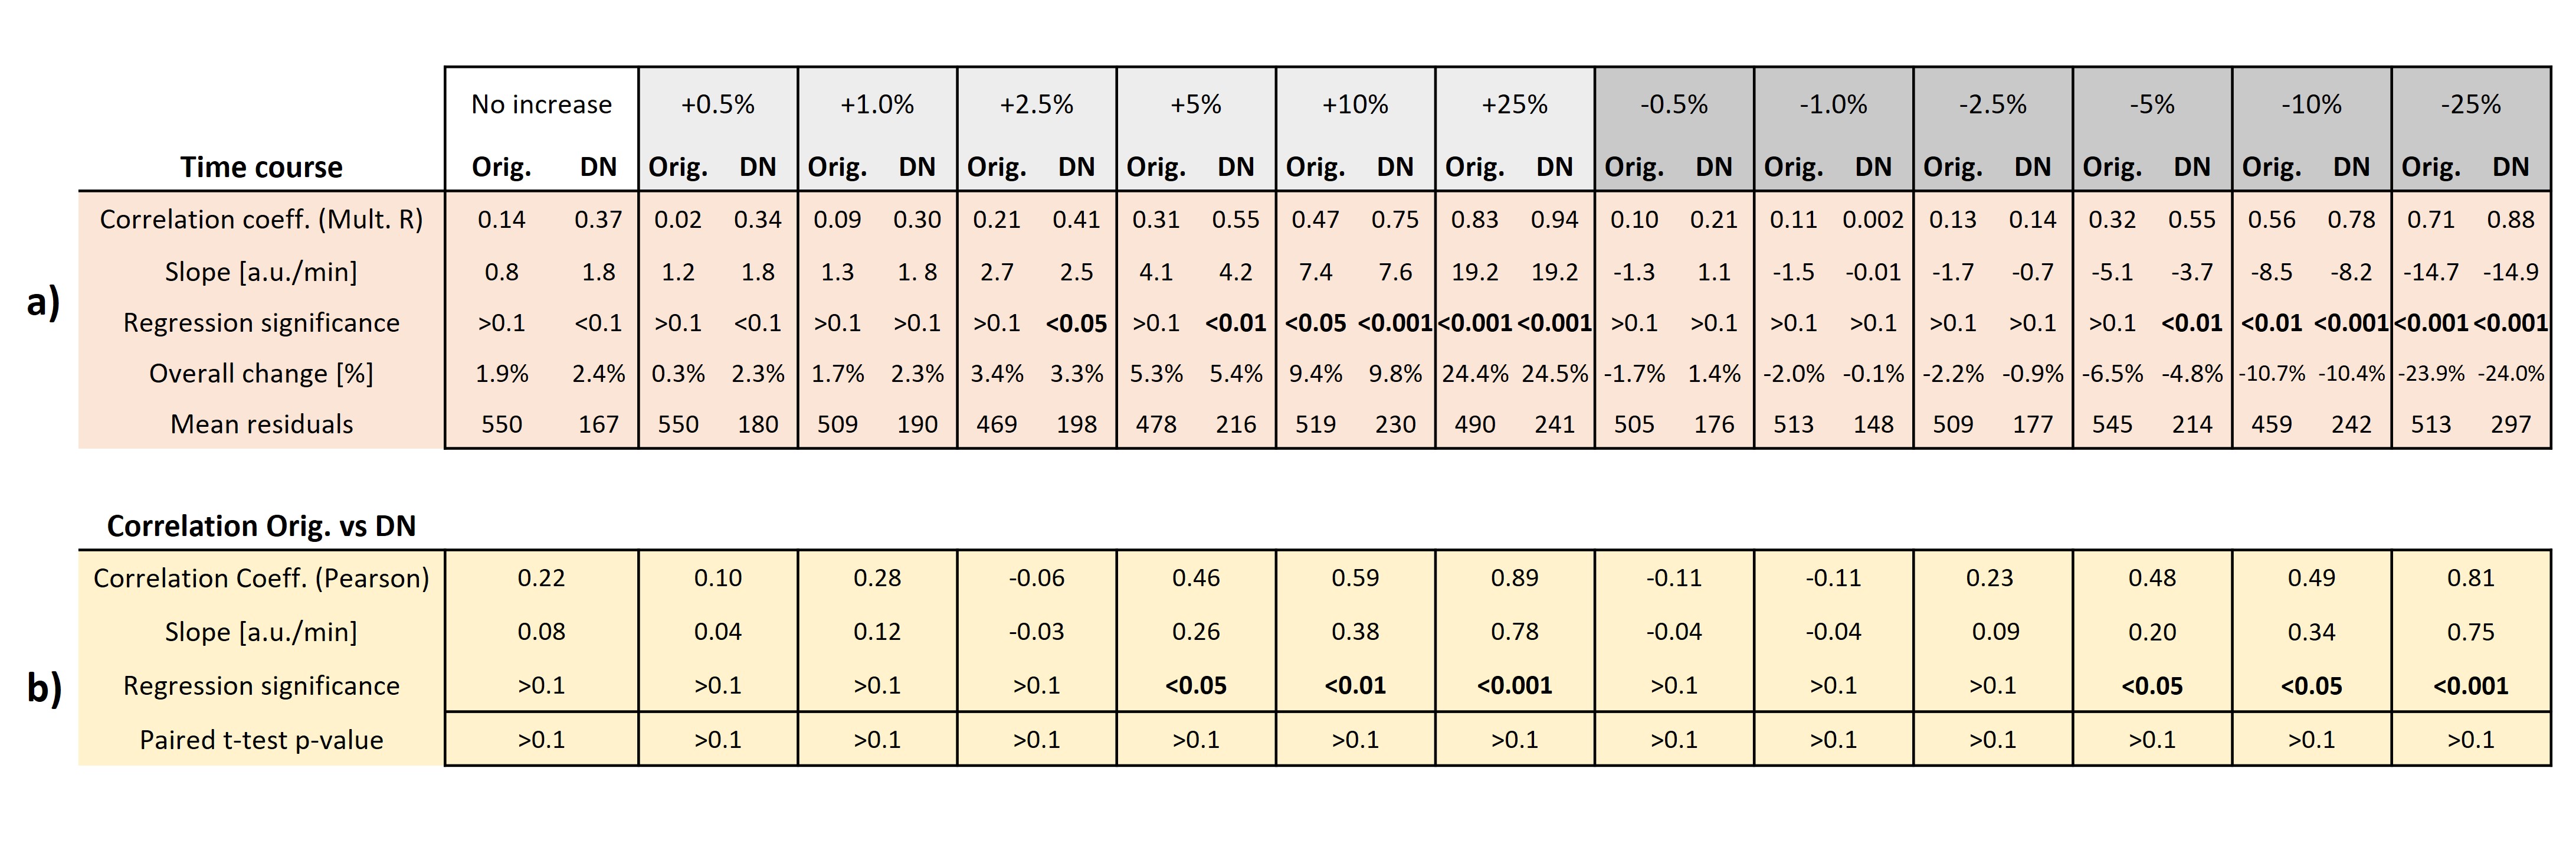
Fig-2 displays sample outcomes for synthetic data. Denoised datasets exhibit reduced variance with respect to the corresponding linear regression lines, while reproducing the imposed increases/decreases. Boxplots of residuals demonstrate the denoising efficiency. Table-1 summarizes statistical findings for synthetic data. Linear regression slopes are found to be significantly different from 0 for smaller imposed changes with denoising than without (significance for effects above 10% without denoising, but already >+2.5% and <-5% with denoising). The regression residuals decrease consistently with denoising. Paired t-tests reject the introduction of significant bias.
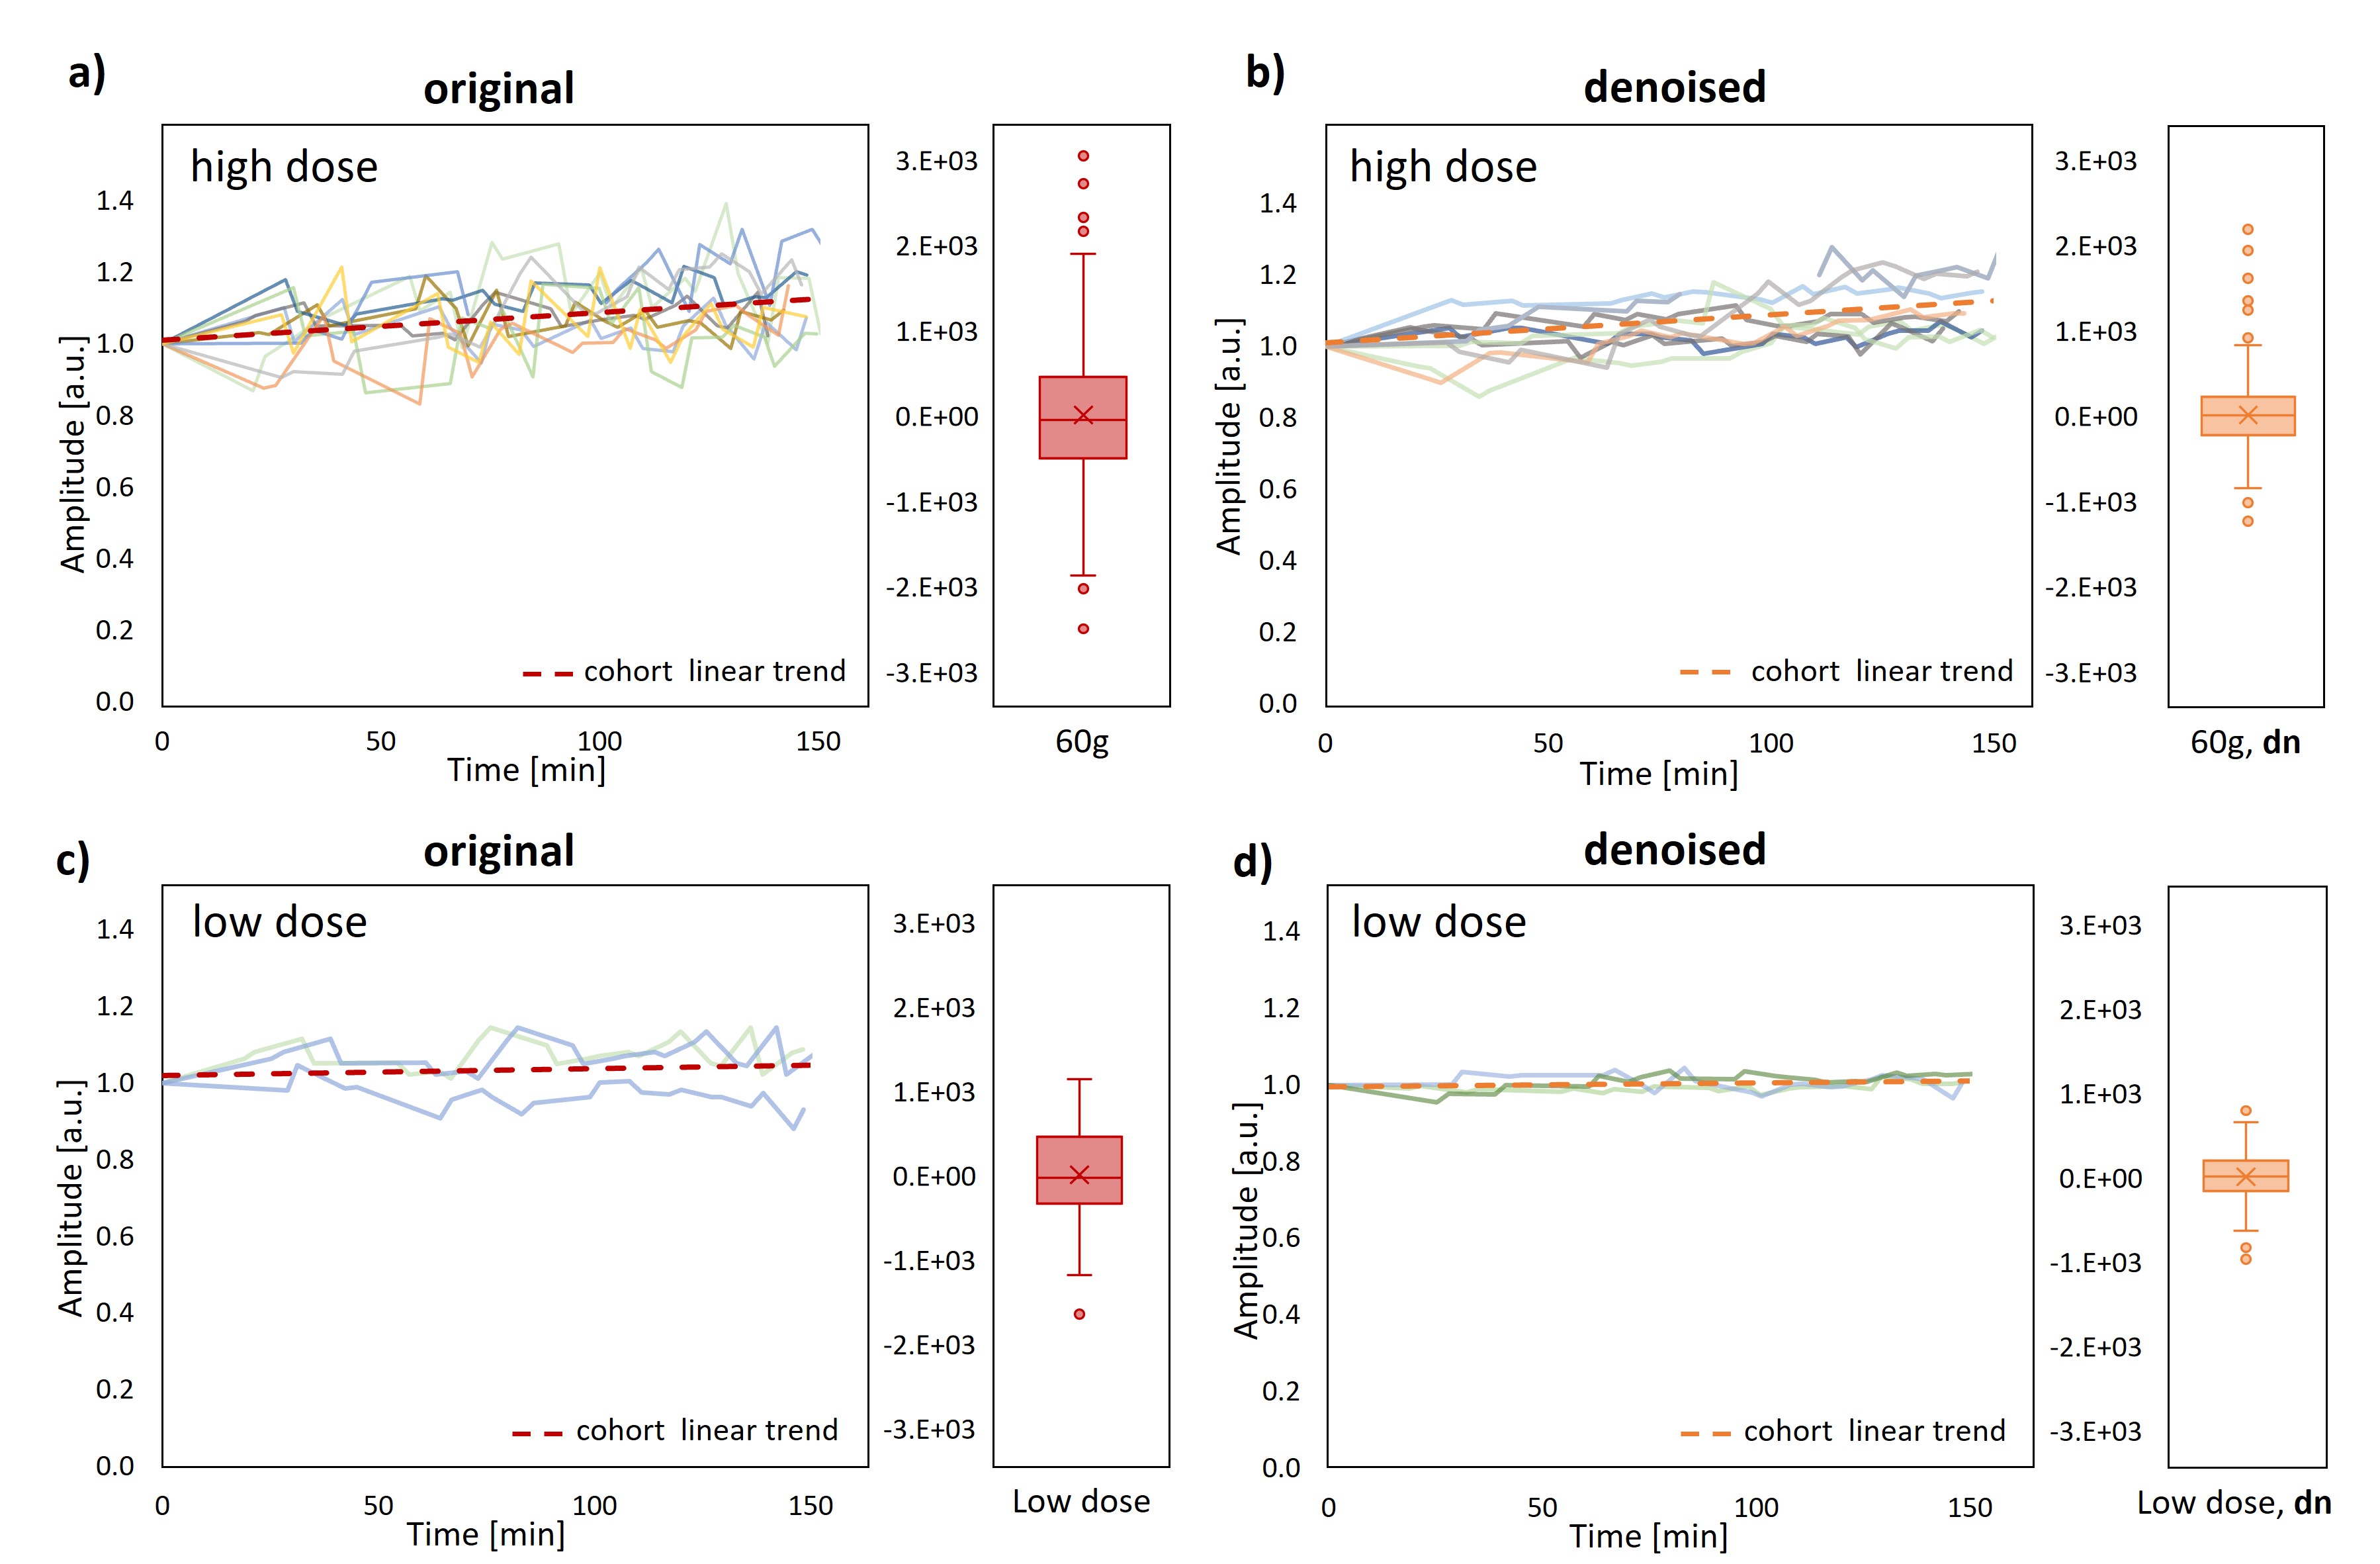
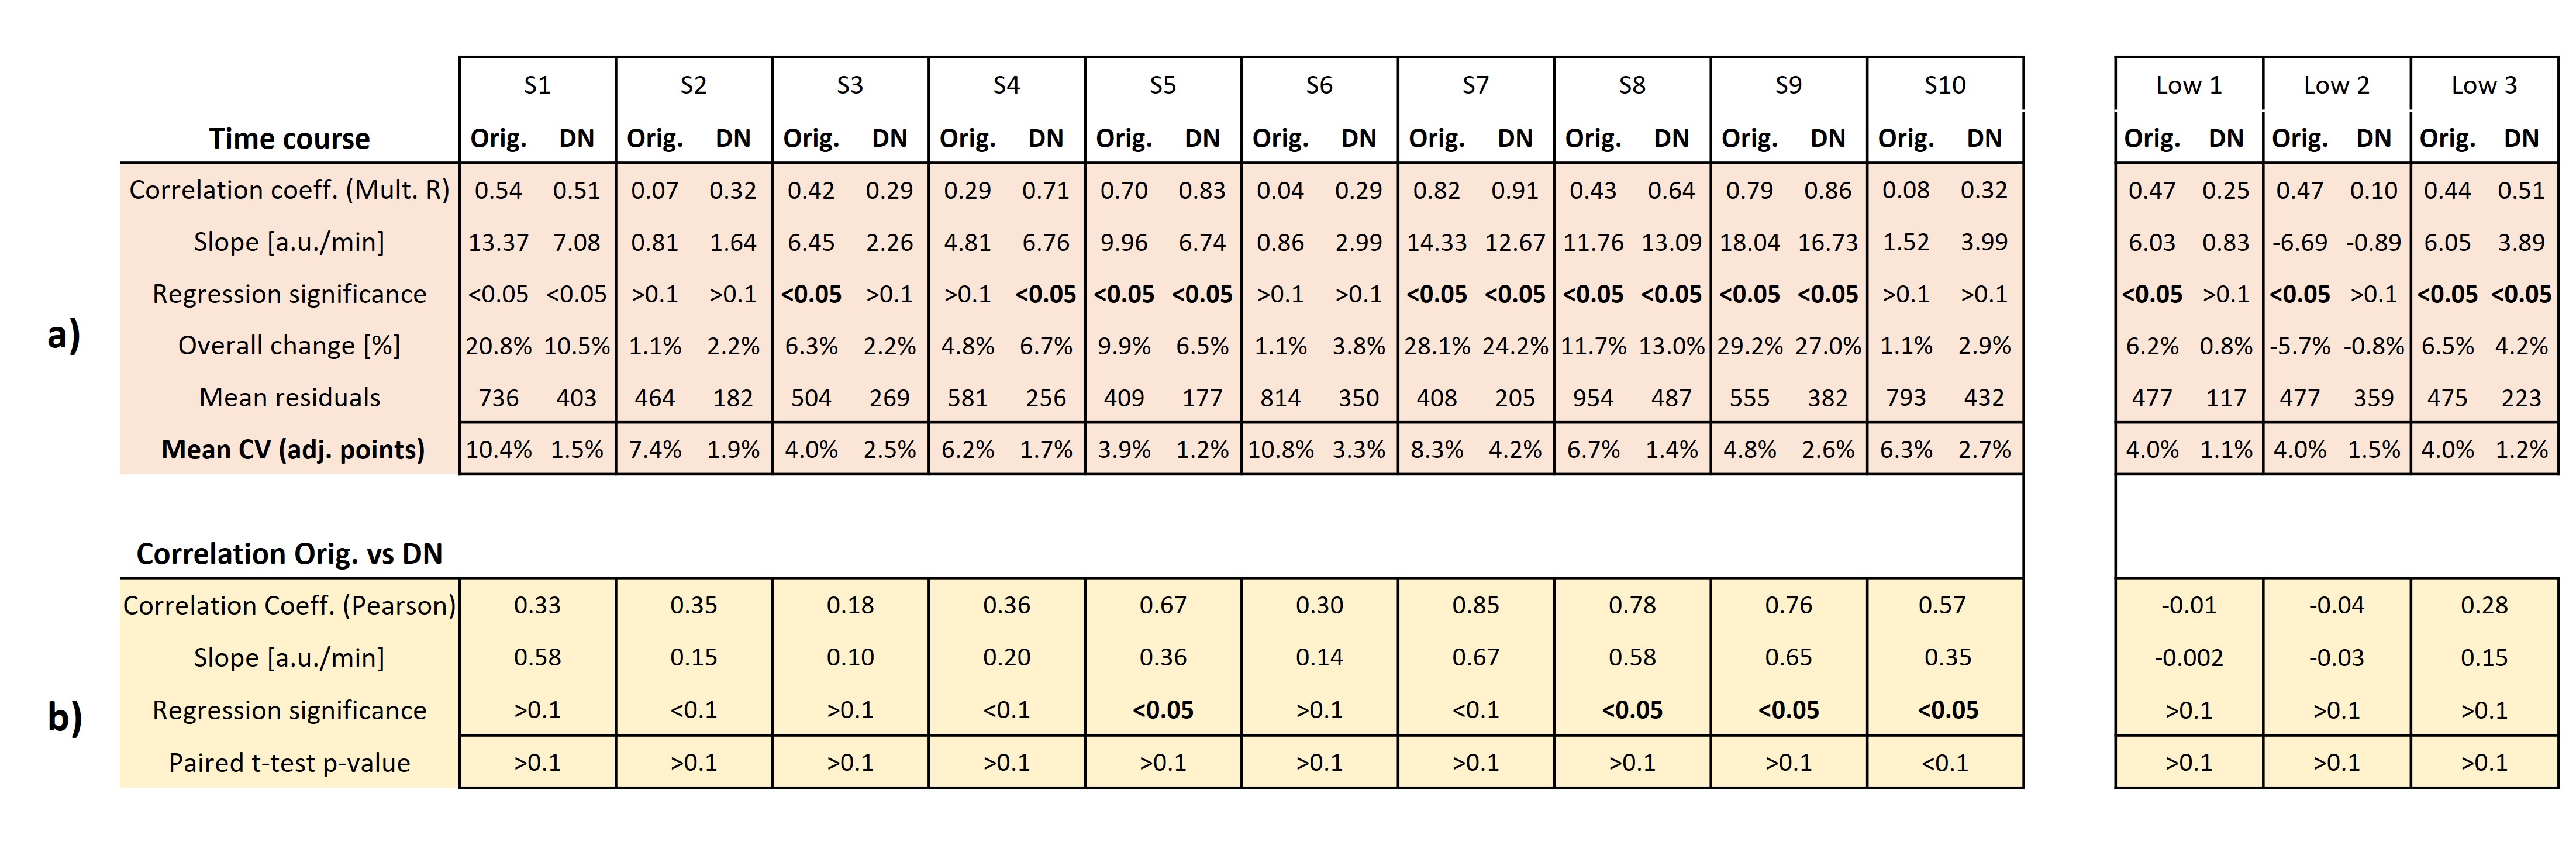
Fig-3 and Table-2 report in-vivo results. As above, regression residuals are reduced after denoising. Reduction of data variance is proven independently of the linear-regression analysis (which may be questioned since the time course is probably nonlinear in-vivo) by the consistent reduction of variance between glycogen levels from adjacent time points, where no physiological change is expected (repeat spectra within 5min). In most datasets, significance for linear change remains the same with and without denoising. Where significance is lost with denoising (especially so for low-dose cases), it can be concluded that it is likely an artifactual finding for the original data. Conversely, when regression becomes significant after denoising, it suggests the presence of a previously undetectable slope (as for synthetic data).
Conclusions
- MP-PCA appears to be a valid instrument for improving evaluation statistics for the detection of temporal changes in hepatic glycogen content.
- In particular, denoising may serve as a secondary validation to confirm the presence or absence of a linear increase of glycogen content in noisy in vivo 13C MRS time series, allowing the use of lower Glc loads in studies focusing on postprandial Glc metabolism.
- The use of MP-PCA must be validated on simulated datasets for each use case.
Acknowledgements
This project is supported by the Swiss National Science Foundation (PCEGP3_186978) and Diabetes Center Bern and by the European Union's Horizon 2020 research and innovation program under the Marie Sklodowska-Curie grant agreement No 813120 (INSPiRE-MED).References
[1] Iwayama K, Onishi T, Maruyama K, Takahashi H. Diurnal variation in the glycogen content of the human liver using 13 C MRS. NMR Biomed. 2020;33(6):e4289.
[2] Jones JG. Non-invasive analysis of human liver metabolism by magnetic resonance spectroscopy. Metabolites. 2021;11(11):751.
[3] Buehler T, Bally L, Dokumaci AS, et al. Methodological and physiological test–retest reliability of 13C-MRS glycogen measurements in liver and in skeletal muscle of patients with type 1 diabetes and matched healthy controls. NMR in Biomedicine. 2016;29(6):796-805.
[4] Matyka K, Dixon RM, Mohn A, et al. Daytime liver glycogen accumulation, measured by 13C magnetic resonance spectroscopy, in young children with Type 1 diabetes mellitus. Diabetic Medicine. 2001;18(8):659-662.
[5] Miller CO, Cao J, Zhu H, et al. 13C MRS studies of the control of hepatic glycogen metabolism at high magnetic fields. Frontiers in Physics. 2017;5.
[6] Poli S, Emara AF, Ballabani E, et al. Interleaved 1H-MRI, 2H-MRSI and 13C-MRS for time-resolved in vivo elucidation of glucose metabolism in human liver at 7 T. In Proceedings of ISMRM 2022, #628.
[7] Poli S, Emara AF, Ballabani E, et al. Real-time observation of postprandial hepatic glucose metabolism with interleaved 2H Metabolic Imaging and 13C-MRS at 7 T. In Proceedings of ISMRM 2022, #064
[8] Veraart J, Novikov DS, Christiaens D, et al. Denoising of diffusion MRI using random matrix theory. NeuroImage. 2016;142:394-406.
[9] Francischello R, Geppi M, Flori A, et al. Application of low-rank approximation using truncated singular value decomposition for noise reduction in hyperpolarized 13 C NMR spectroscopy. NMR Biomed. 2021;34(5):e4285.
[10] Froeling M, Prompers JJ, Klomp DWJ, van der Velden TA. PCA denoising and Wiener deconvolution of 31P 3D CSI data to enhance effective SNR and improve point spread function. Magnetic Resonance in Medicine. 2021;85(6):2992-3009.
[11] Mosso J, Simicic D, Şimşek K, et al. MP-PCA denoising for diffusion MRS data: promises and pitfalls. NeuroImage. 2022;263:119634.
[12] Christensen NV, Vaeggemose M, Bøgh N, et al. A user independent denoising method for x-nuclei MRI and MRS. Magnetic Resonance in Medicine. 2023;90(6):2539-2556.
[13] Simicic D, Lê T, van Heeswijk R, et al. The impact of Marchenko-Pastur PCA denoising on high resolution MRSI in the rat brain at 9.4 T. Proc Intl Soc Mag Reson Med. 2021;29.
[14] Naressi A, Couturier C, Devos JM, et al. Java-based graphical user interface for the MRUI quantitation package. MAGMA. 2001;12(2-3):141-152.
[15] Chong DGQ, Kreis R, Bolliger CS, et al. Two-dimensional linear-combination model fitting of magnetic resonance spectra to define the macromolecule baseline using FiTAID, a Fitting Tool for Arrays of Interrelated Datasets. Magn Reson Mater Phy. 2011;24(3):147-164.
Figures