2994
Saturated T2 Curves for Relaxation-Based Compartmental Analysis in PRESS Localized 1H MRS1Radiology, Children's Healthcare of Atlanta, Atlanta, GA, United States, 2Psychology, The University of Texas at Austin, Austin, TX, United States
Synopsis
Keywords: Segmentation, Spectroscopy, Point Resolved Spectroscopy, PRESS
Motivation: Rapid Relaxometry through Acquisition of Multiple Saturated T2 Curves (RRAMSC) is a time-efficient STEAM compartmental analysis method. While it has been theorized that the technique can also be used in PRESS localization, it has not yet been demonstrated.
Goal(s): Our goal is to examine RRAMSC for separating the tissue water and CSF when using PRESS localized spectroscopy.
Approach: To our knowledge, this is the first study to demonstrate the applicability of RRAMSC for PRESS in vivo.
Results: Results show excellent agreement between theoretical and actual differences for a PRESS-based RRAMSC, showing negligible differences and a mean error of less than 2%
Impact: This study extends the rapid relaxometry through acquistion of multiple saturated T2 curves, a time-efficient relaxometry technique for water compartmentalization, to the more commonly used point resolved spectroscopy localization technique.
Introduction
MR relaxometry has long been considered to be the best method for separating water compartments in MR imaging and spectroscopy (1-3). However, because relaxometry studies are time consuming, the method is rarely used in in vivo brain spectroscopy. Rapid Relaxometry through Acquisition of Multiple Saturated T2 Curves (RRAMSC) uses multiple relaxation curves for simultaneous calculation of T1, T2, and separation of the tissue water and cerebral spinal fluid water signal contributions (4). RRAMSC was originally designed to take advantage of the well-defined T1 saturation effects in a stimulated-echo sequence to provide a time-efficient method for collecting data for water compartmental analysis in a localized single-voxel, in vivo (5-7). Theoretical analyses and modeling suggested that RRAMSC could also be employed for point-resolved spectroscopy (PRESS) localization (8). In this study, we demonstrate for the first time, the use of RRAMSC to separate water compartments in a PRESS localized voxel.Theory
Under ideal conditions, signal T1 saturation for PRESS is given by$$\tag{1} 1- 2\; exp \left[-\; \frac{(TR - 3\; TE/4)}{T_1} \right]+ 2\; exp \left[-\; \frac{(TR - TE/4)}{T_1} \right] - exp \left[-\; \frac{TR}{T_1} \right]$$
but in theory can be reduced to
$$\tag{2}≈1-2\; exp \left[-\; \frac{(TR - TE)}{T_1} \right]$$
This approximation allows the RRAMSC approach as the degree of T1 signal saturation can be controlled by one time interval, a delay time TD, defined as TR-TE (8).
Methods
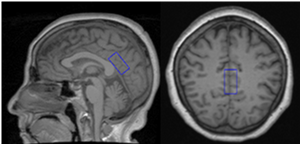
The study was approved by The University of Texas at Austin IRB and performed on a Siemens 3T MRI system using a 20-channel phased-array head-neck coil. Unsuppressed RRAMSC water spectra were acquired from 9 participants (8/1 female/male, age range: 40-61 yrs, mean: 50.8±6.5 yrs) using a commercial PRESS sequence (occipito-parietal junction, Fig 1, 6.75 mL, 2500 Hz SW, 2048 pts) for eight TEs: 30, 40, 70, 110, 180, 290, 470, and 750-ms; and three TDs: 970, 1970, and 2970-ms. In one participant, two 3 mL voxels were also acquired, one in purely white matter and one in a gray matter dominated region. An 8-averaged water reference (TE/TR = 30/4750 ms) was also acquired for model verification with each RRAMSC study. The RRAMSC was fit with Eqs. (1) and (2) to compare the validity of the approximation. Acquisition parameters for water references were used in the resulting models to examine the accuracy of both models.Results
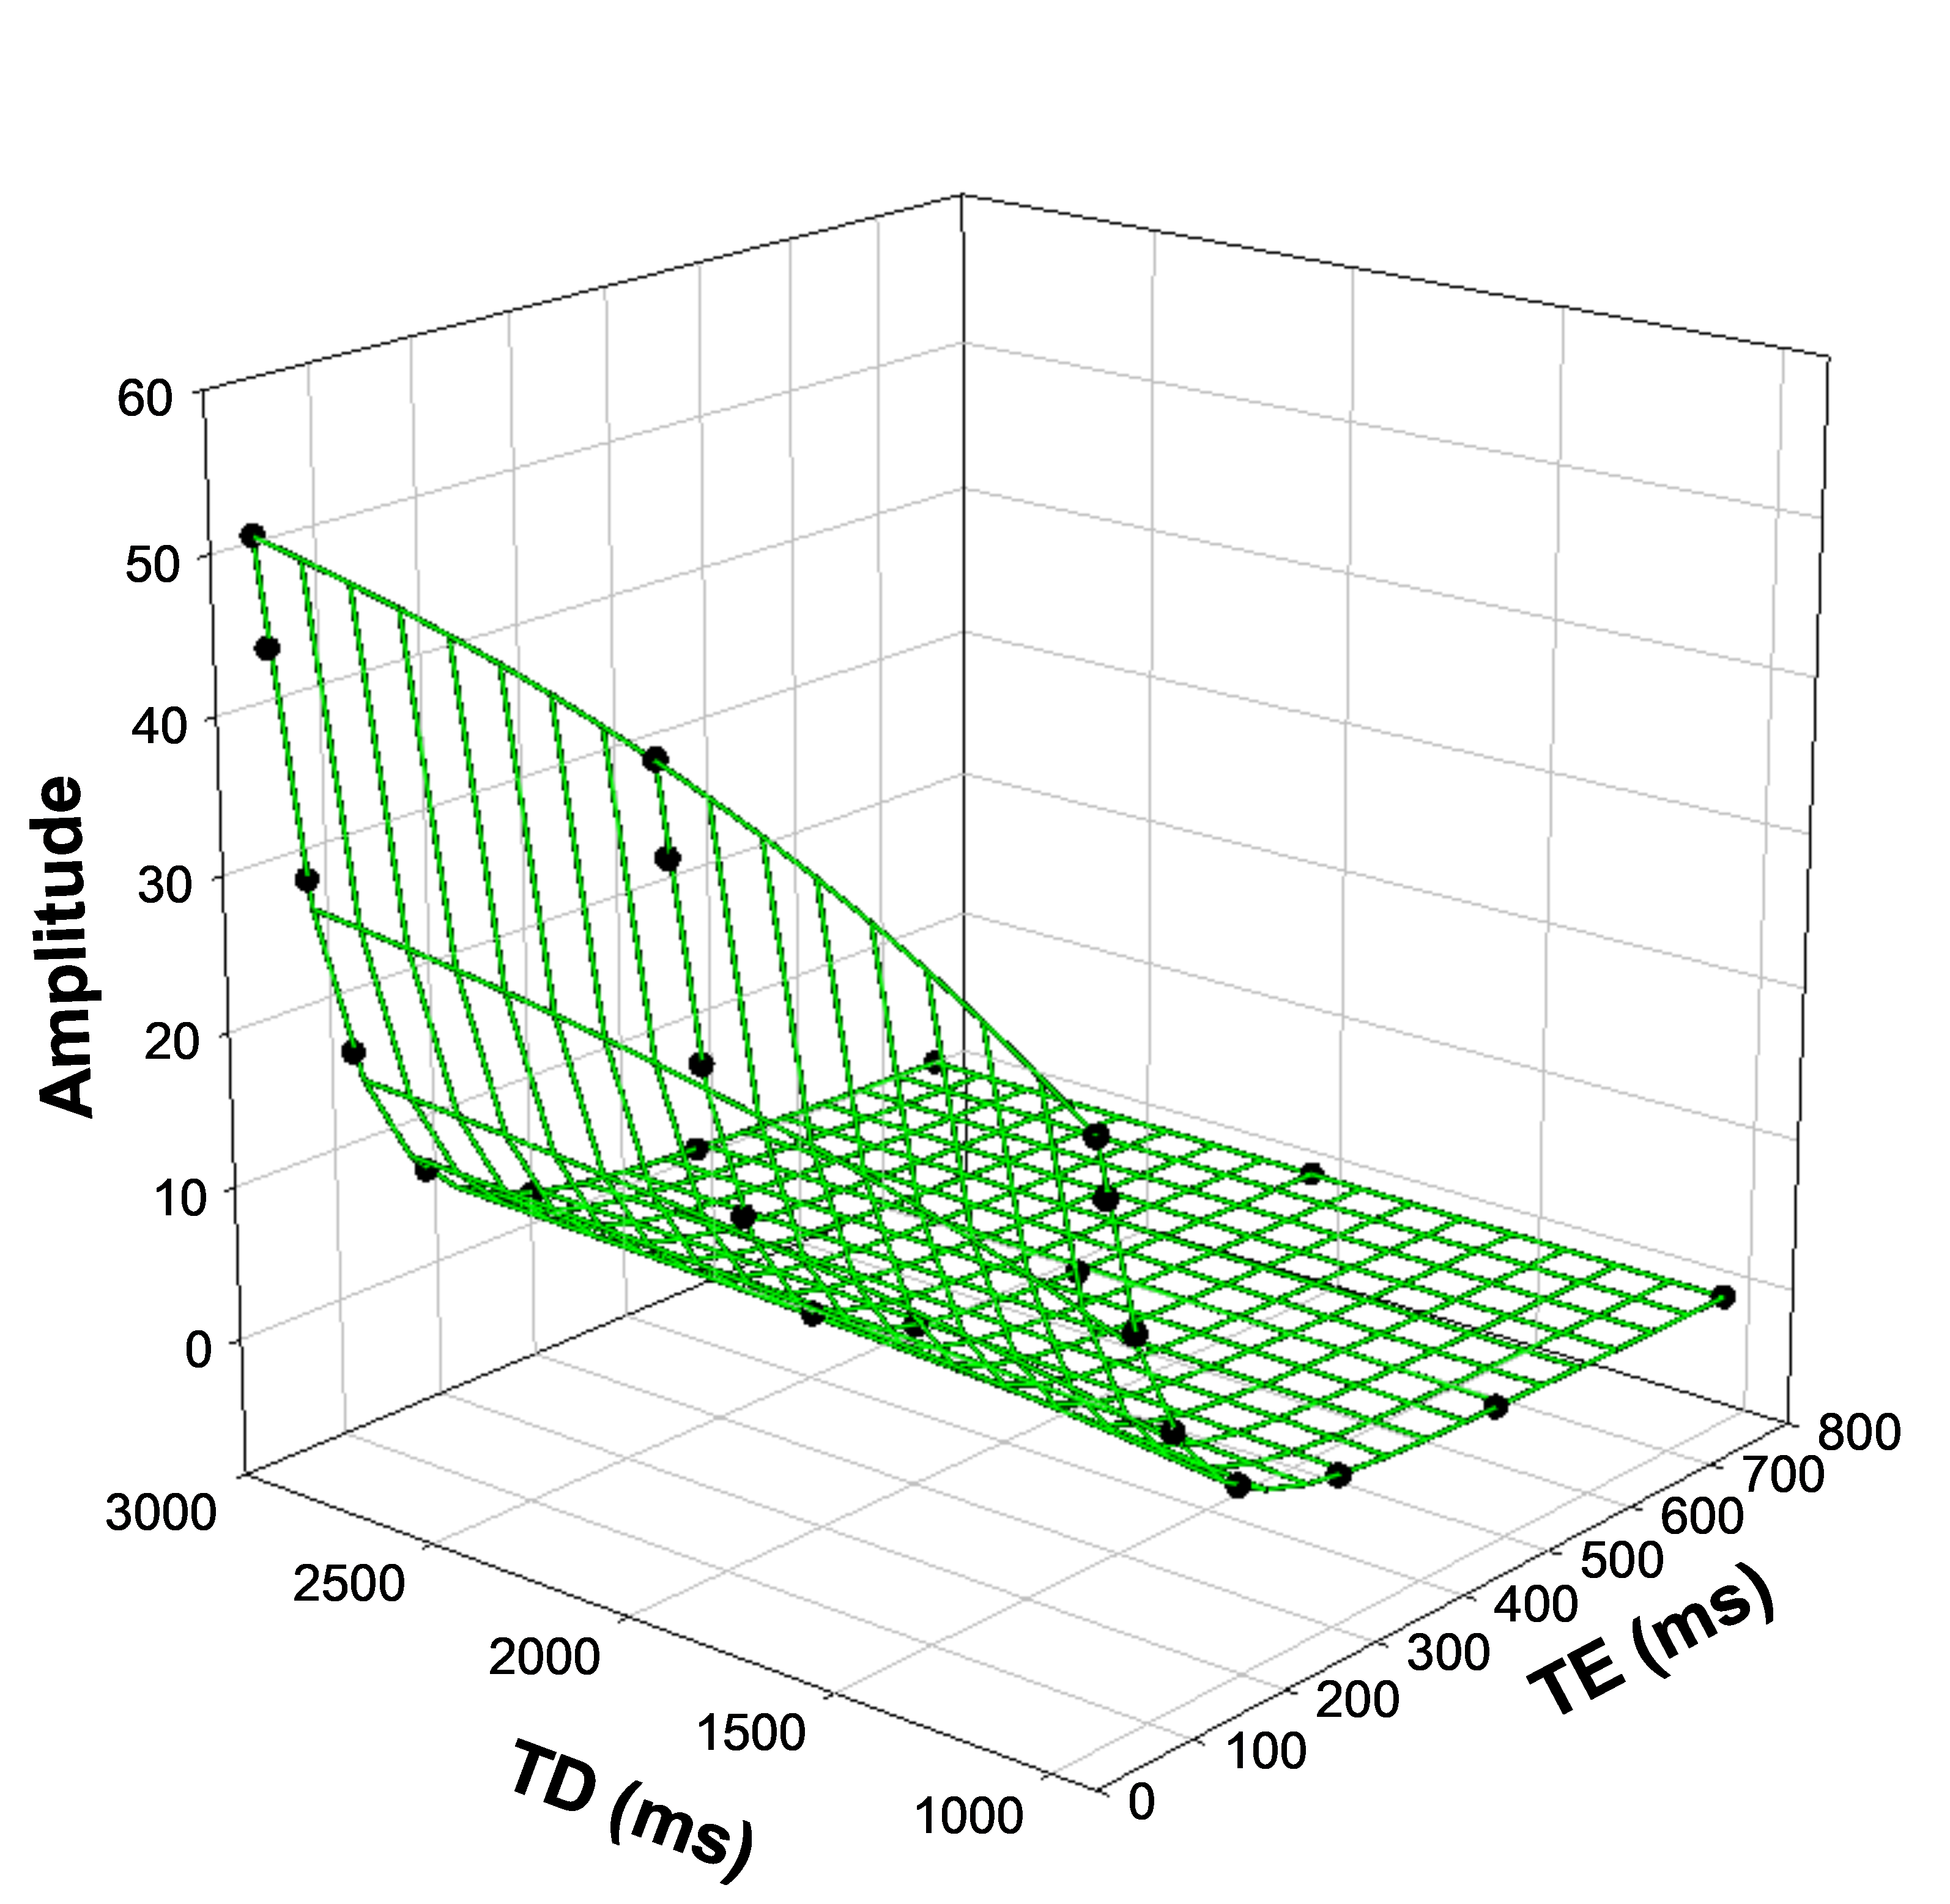
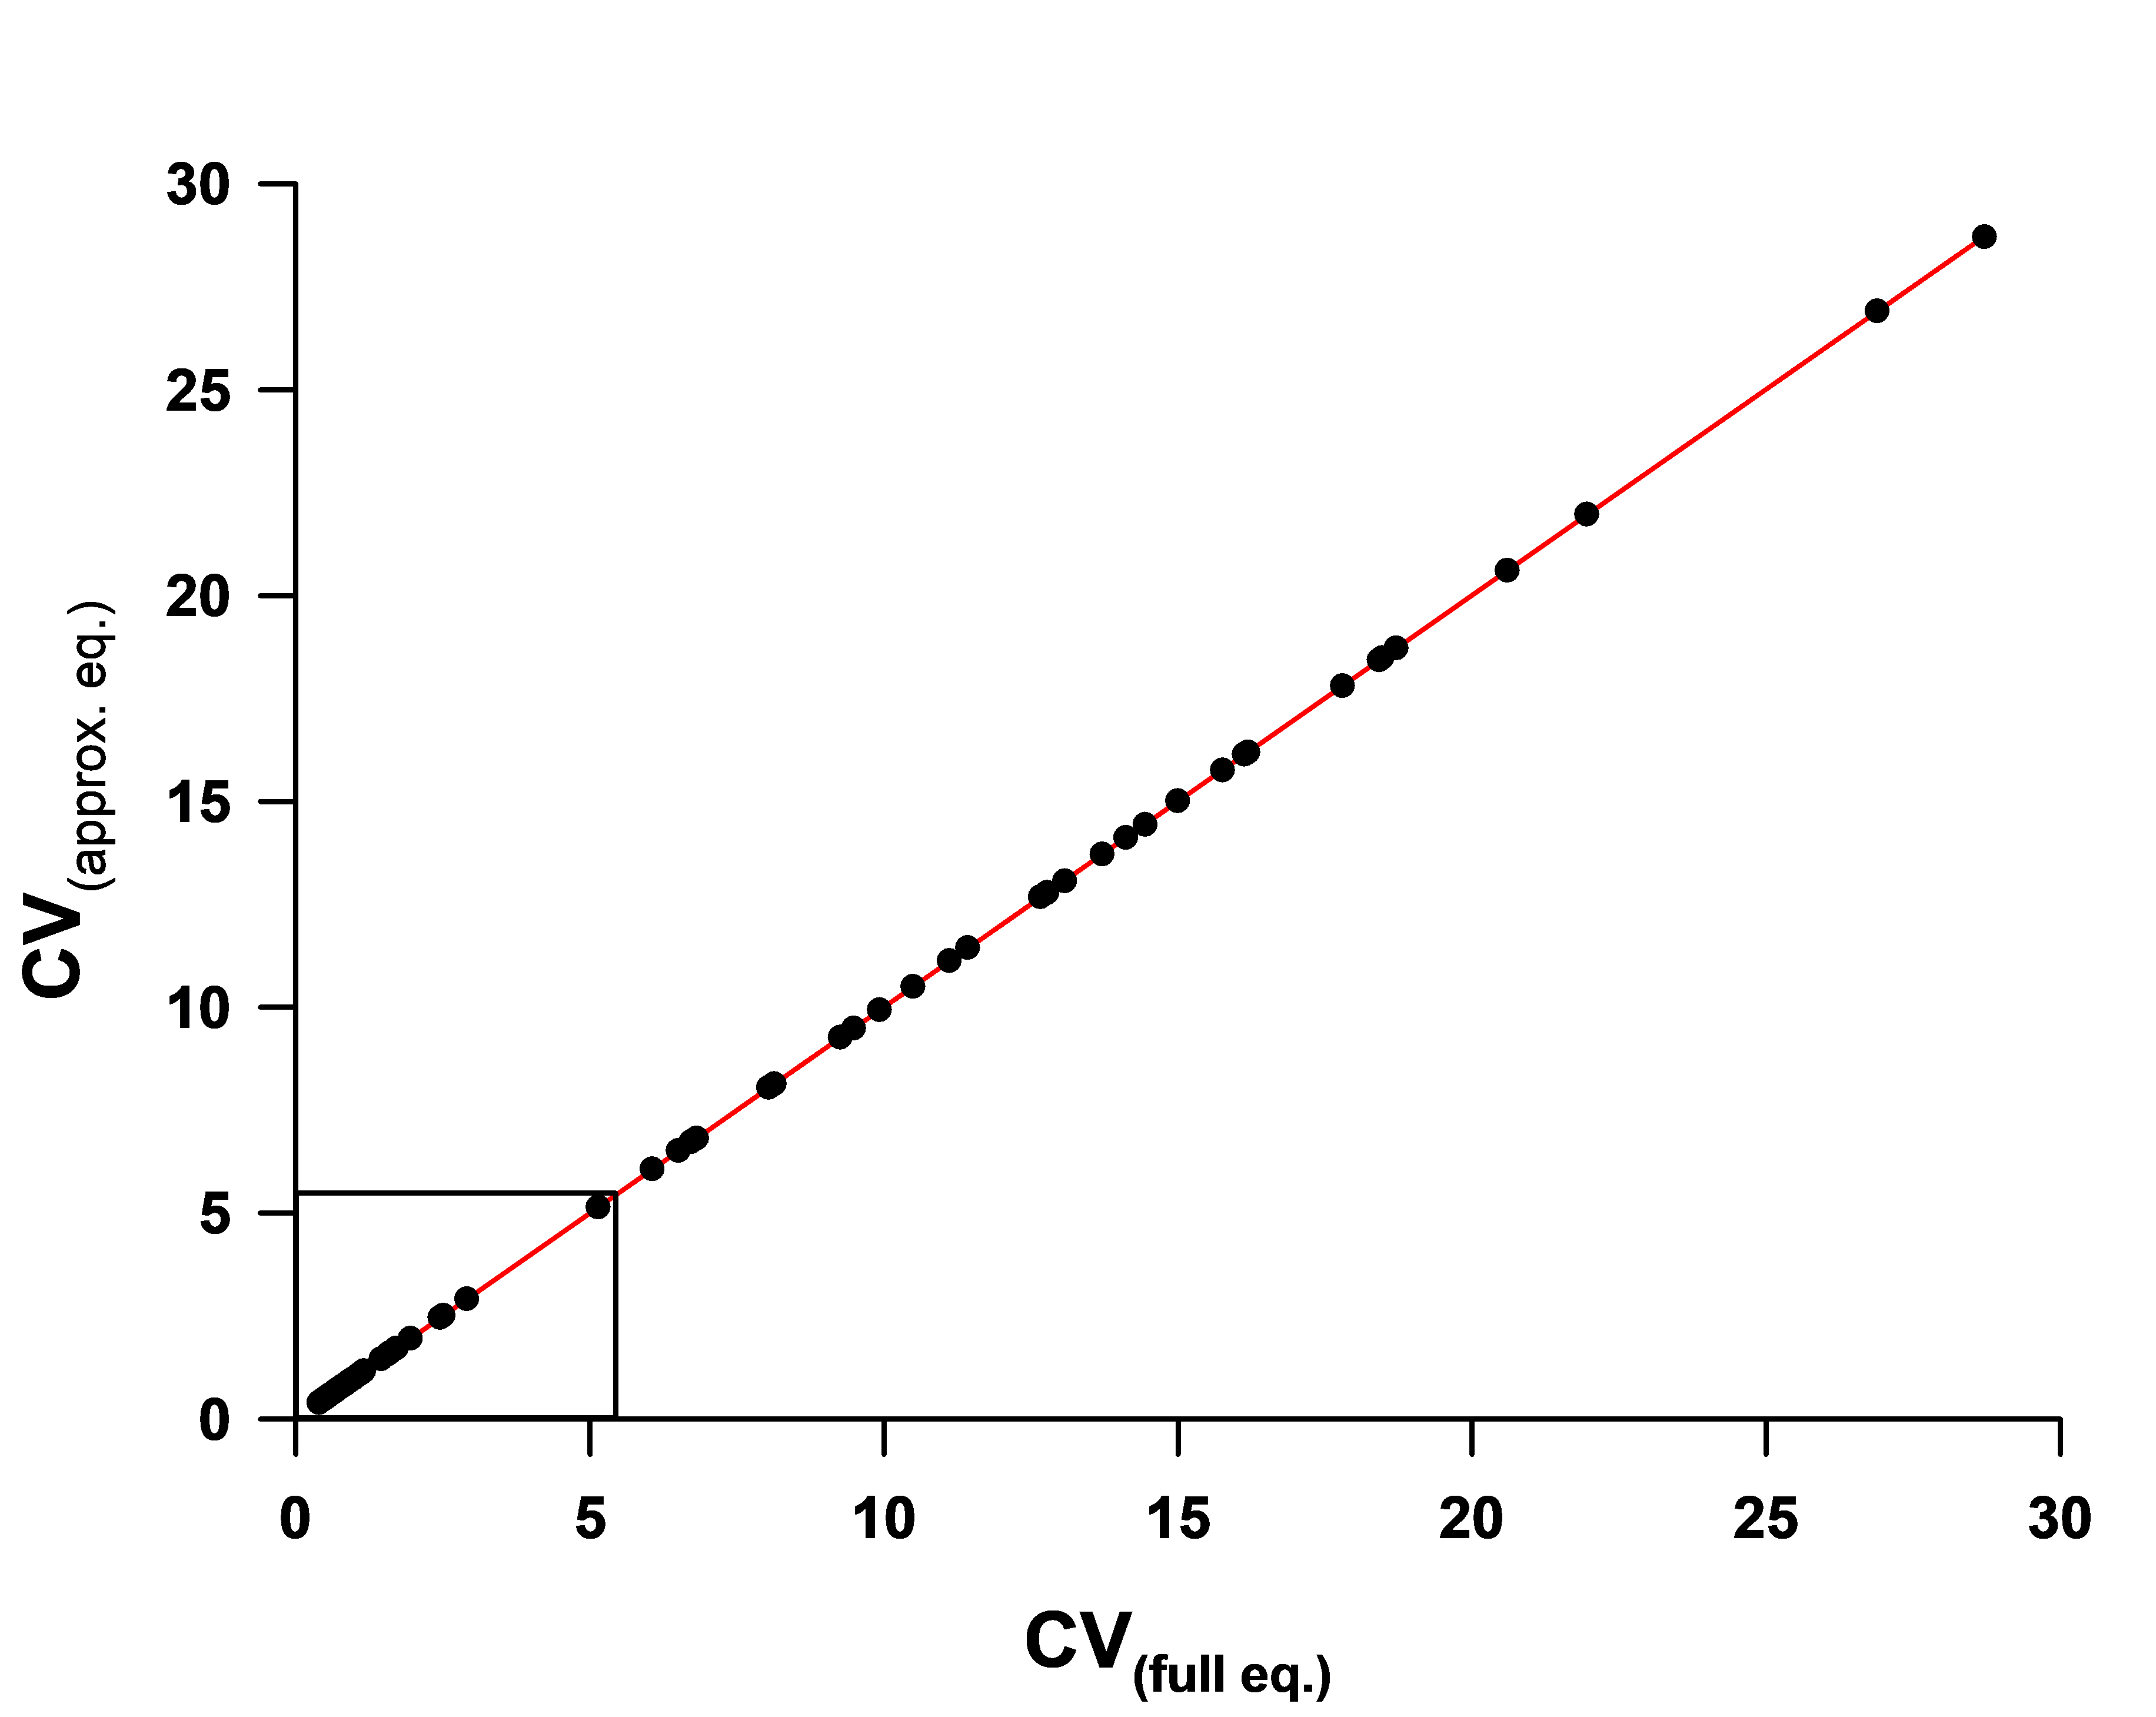
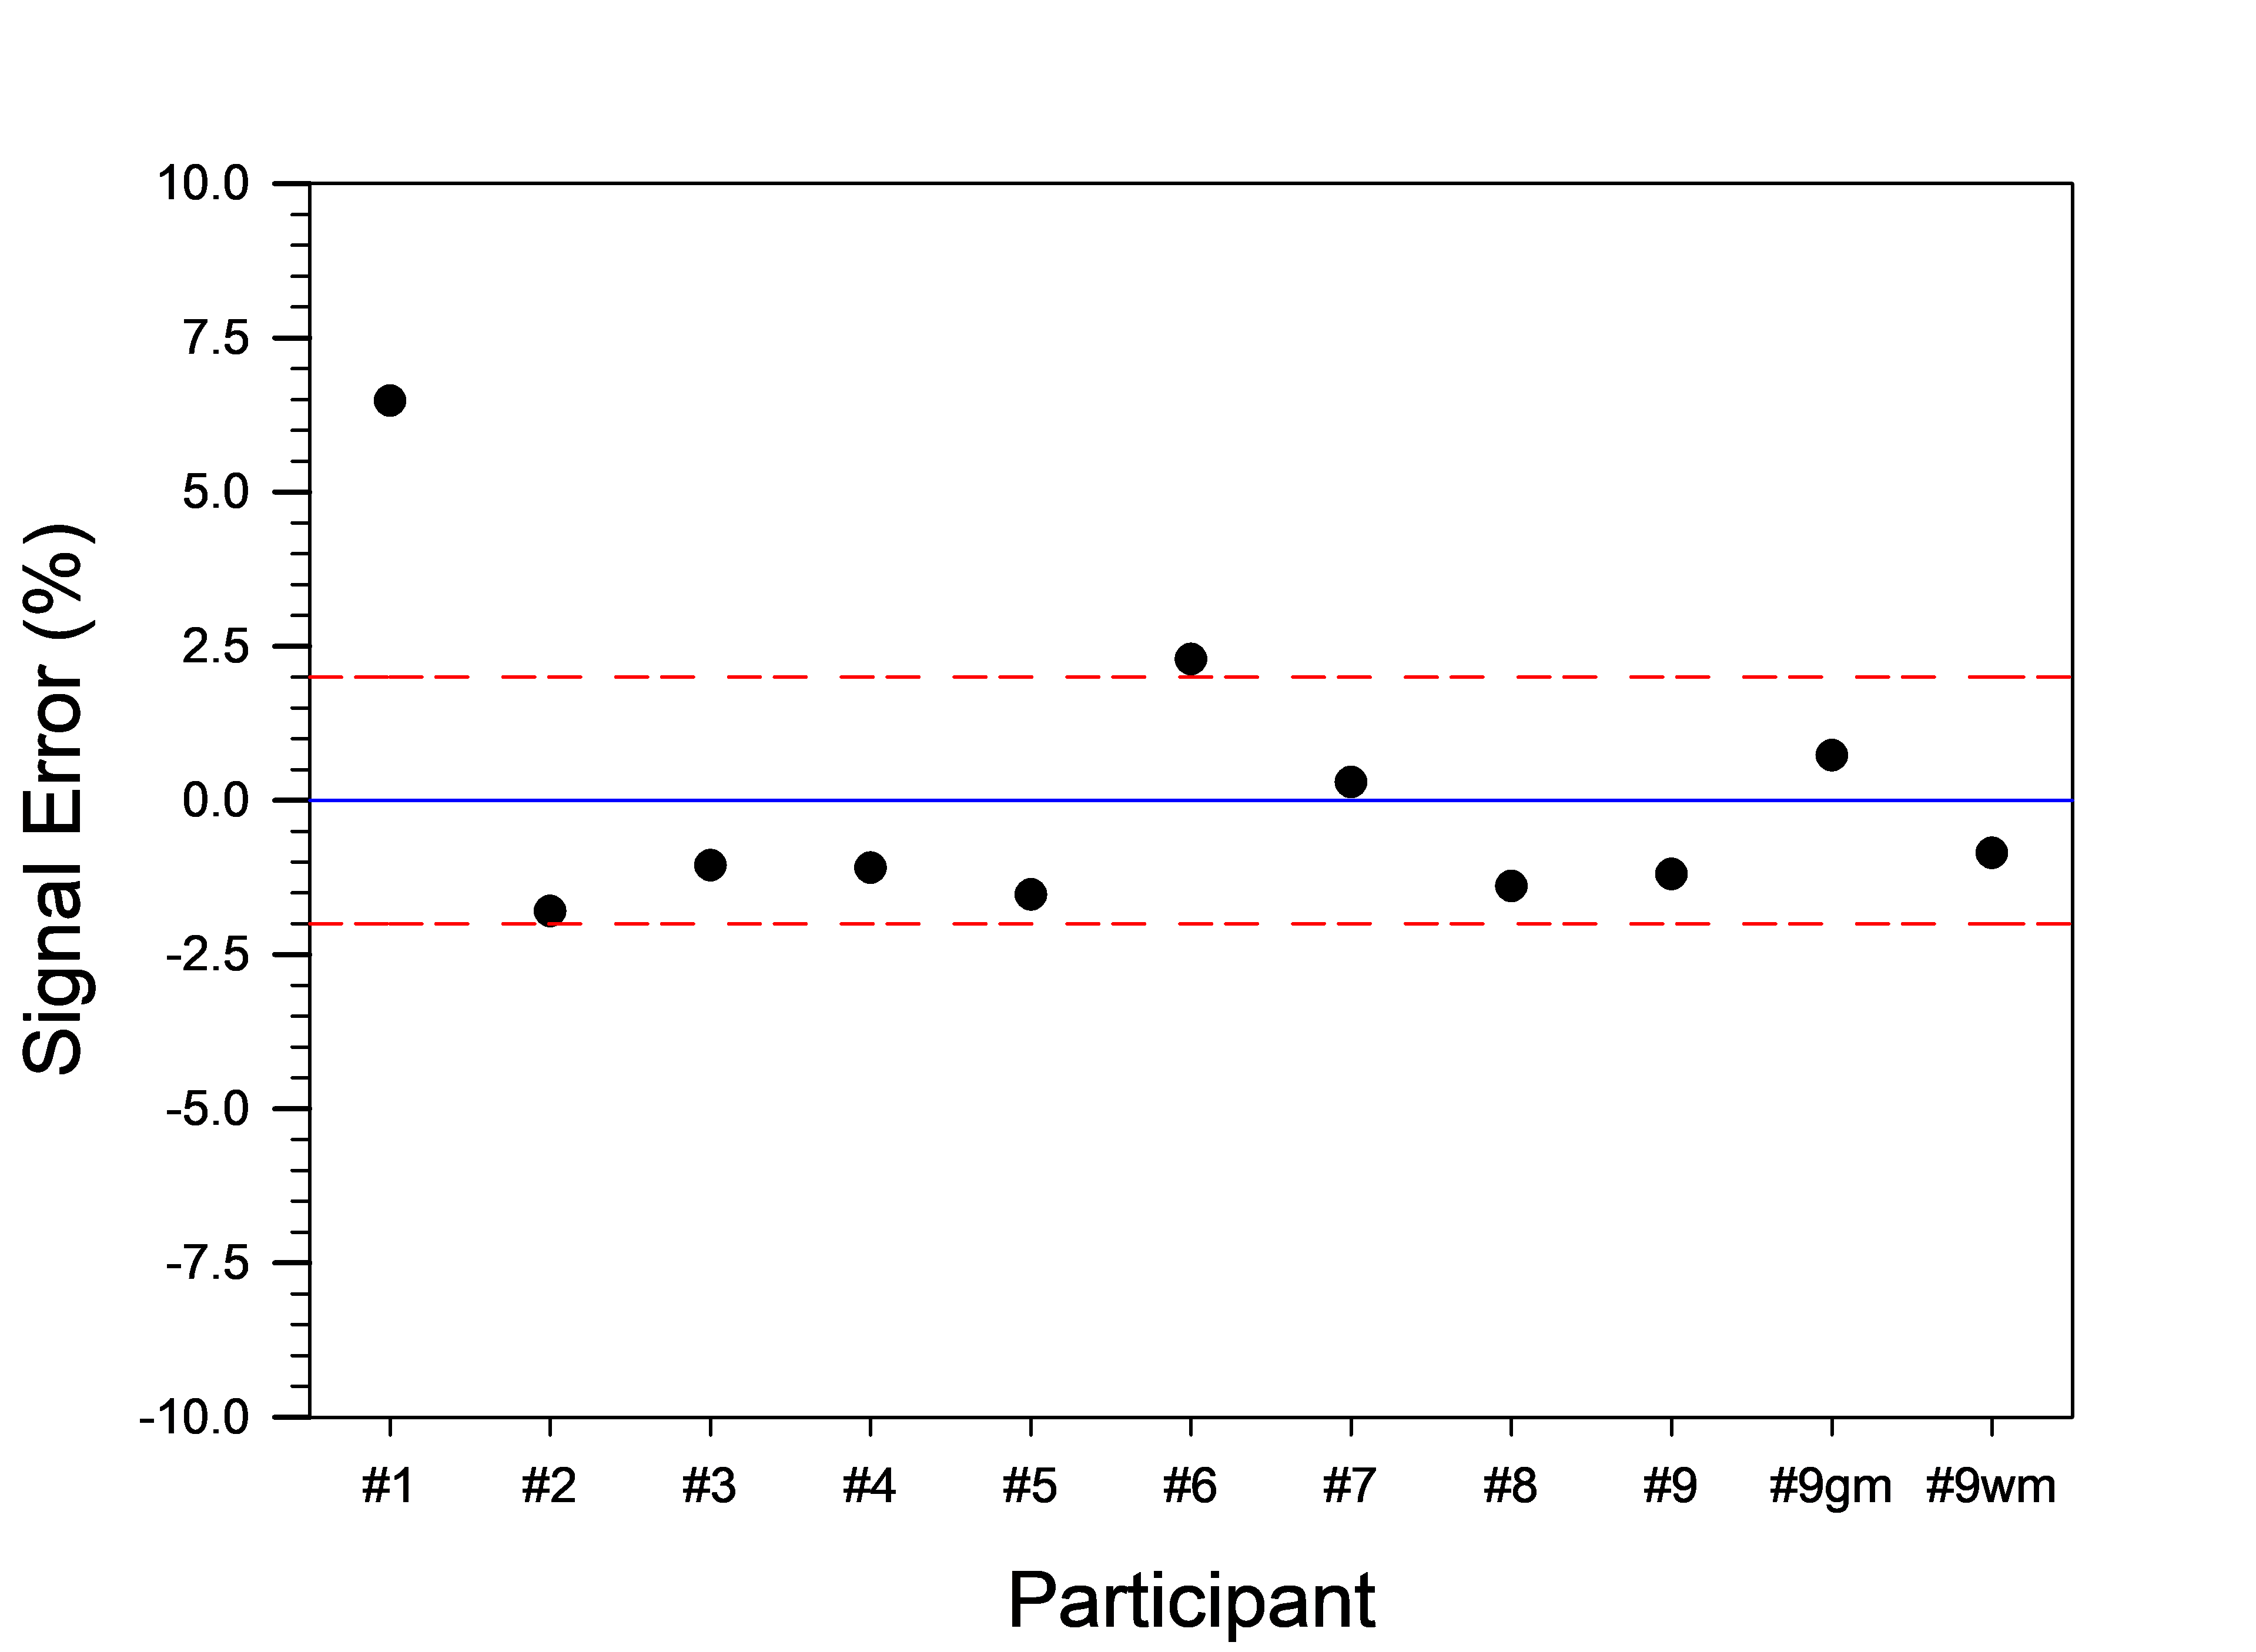
Figure 2 shows the data and fit for a typical RRAMSC study. Fits to RRAMSC data results in T1, T2, and the equilibrium signal for both CSF and brain tissue, totaling six parameters (or three when the voxel is located solely in tissue). Differences between fits from the two equations, 63 total values, in this study were all less than 0.1%, with an average of 0.025% and a maximum value of 0.097%. Comparison of the results from fits with Eqs. (1) and(2) is shown through a linear fit of the coefficient of variation of all parameters (Fig 3). This yields y = 1.0005x + 0.0004, where CVs for tissue parameter were all less than 6% (shown by smaller box in Fig 3), while CVs for CSF parameters were expectedly greater. Comparisons of the predicted water signal from the model and the acquired water signal are shown in Fig 4 as percentage error, $$$\left|100 × \left(\frac{S_{model} - S_{ref}}{S_{ref}}\right)\right|$$$. Absolute differences are on average about 2%, even with an outlier at ~ 6.5%.Discussion
As previously described (8), T1 saturation effects in the PRESS sequence can be reduced to a simple model that lends itself to the application of RRAMSC for efficient compartmental analysis. While we have a brute-forced implementation of a PRESS-based RRAMSC, thus requiring over 3 minutes of data acquisition, a dedicated-sequence would require only 70 to 80 sec. RRAMSC designed with a stimulated-echo sequence was similarly originally initiated with about a 3 min acquisition, before being optimized to only one minute (5-7). The tissue water signal loss in a commercial PRESS sequence is nearly 50% at the shortest available TE, 30-ms. Therefore, three saturated T2 curves were utilized to stabilize the acquisition, in contrast to the two curves employed in STEAM-based RRAMSC (5-6). Previous theoretical analysis suggested modeling differences between the two equations would be less than one-tenth of a percent, and these results are in excellent agreement with that assessment. Parameters obtained from modeling with these equations are nearly identical. Verification of RRAMSC by comparing the water reference signal and water signal modeled with the RRAMSC parameters yields an average absolute error of less than 2%. The single outlier suggests that one participant repositioned themselves during the data acquisition.Conclusion
RRAMSC is applicable for water compartmental analysis with PRESS localization.Acknowledgements
Funding for this study was provided by The University of Texas at Austin Aging Initiative.References
- Whittall KP, MacKay AL, Graeb DA, Nugent RA, Li DKB, Paty DW. In vivo measurement of T2 distributions and water contents in normal human brain. Magn Reson Med 1997; 37:34–43.
- Ernst T, Kreis R, Ross BD. Absolute quantification of water and metabolites in the human brain. I. Compartments and water. J Magn Reson B 1993; 102:1–8.
- Kreis R, Ernst T, Ross BD. Absolute quantitation of water and metabolites in the human brain. II. Metabolite concentrations. J Magn Reson B 1993; 102:9–19
- Knight-Scott J. Saturated T2 curves for relaxometry-based compartmental analysis in localized 1H MRS. Proc. ISMRM 15th Scientific Meeting and Exhibition, (Berlin, Germany, 2007) p 202.
- Knight-Scott J, Dunham SA, Shanbhag DD. Increasing the speed of relaxometry-based compartmental analysis experiments in STEAM spectroscopy. J Magn Reson 2005; 173:169-174.
- Knight-Scott J, Palasis S, Johnson KC. A 1-minute relaxometry acquisition for water referencing in quantitative spectroscopy. OHBM 19th Annual Meeting, June 16-20 (Seattle, WA, USA, 2013).
- Knight-Scott J. Absolute quantitative spectroscopy through internal water referencing with a one-minute RRAMSC.” Proc ISMRM, Joint Annual Meeting ISMRM-ESMRMB May 10-16, (Milan, Italy, 2014) p 3737.
- Knight-Scott J. Analysis of saturated T2 curves for rapid relaxometry measurements in PRESS localization.” Proc ISMRM 19th Scientific Meeting and Exhibition, (Montreal, Canada, 2011) p 1454.
Figures