2992
Using synMARSS, a novel platform for simulating in vivo synthetic spectra, to investigate 14N heteronuclear coupling effects1Regeneron Pharmaceuticals, Inc, Tarrytown, NY, United States, 2Massachusetts General Hospital, Boston, MA, United States, 3École polytechnique fédérale de Lausanne, Lausanne, Switzerland, 4Columbia University, New York City, NY, United States, 5University of Bern, Bern, Switzerland
Synopsis
Keywords: Software Tools, Spectroscopy
Motivation: Synthetic spectra can be used to investigate modeling assumptions, optimize sequence parameters and for machine learning training data
Goal(s): To develop a platform that can produce synthetic spectra, and to use it to investigate the effects of 14N coupling on 1H quantification
Approach: MARSS was extended to be able to create synthetic spectra, and accommodate spin 1 nuclei
Results: Using synthetic spectra it was shown that approximating 14N heteronuclear coupling as weak homonuclear coupling results in small effects on quantification of the prominent metabolites at short echo time for PRESS, however, these effects increase with echo time.
Impact: MARSS was extended to simulate non-1H in vivo synthetic magnetic resonance spectra. Synthetic spectra can be used to bolster experimental evidence, or to investigate questions which are impossible or infeasible experimentally.
Introduction
Synthetic spectra are used for three main purposes in in vivo magnetic resonance spectroscopy (MRS): 1) Testing modeling assumptions1; 2) Optimizing sequence parameters2,3; 3) Providing training data for machine learning algorithms4–6. The reliability of results from synthetic data will invariably be tied to how closely the synthetic data matches experimental data. Currently, no end-to-end platform exists that can generate experimentally realistic synthetic spectra from MRS, sequence and tissue parameters. The purpose of this work is to extend MARSS7 to be able to generate synthetic spectra from basis sets. We refer to synMARSS as the new portion of MARSS which converts basis sets to synthetic spectra, in order to differentiate from the previously-released portion of MARSS which only simulates basis sets. Despite this distinction, synMARSS is fully implemented into MARSS and is run automatically if the required parameter file is provided.Methods
synMARSS converts a basis set (as generated by MARSS) into realistic in vivo synthetic spectra via using the following user-specified parameters, specified per individual metabolite (or moiety): concentration, T1 and T2 relaxation times, frequency shift, Lorentzian/Gaussian broadening and arbitrary line-shape convolution. Additionally, global parameters are included such as noise or other baselines to account for unparameterized signals (e.g., various molecules below quantification threshold, macromolecular baseline) and zeroth/first order phase. For each set of synthetic parameters, the input basis set signal for each metabolite or moiety is appropriately transformed, and all transformed signals are summed to produce the final synthetic spectra. synMARSS can produce multiple synthetic spectra from a single basis set by providing sets of synthetic parameters, proving useful in generating training data for the development machine learning tools.Many popular in vivo MRS basis set simulation packages, including the previous version of MARSS7, FSL-MRS8 and FID-A9 accommodate only spin ½ nuclei simulations. In experiments, certain metabolites (e.g., phosphoryl choline, glycerophosphorylcholine, choline, ethanolamine and phosphorylethanolamine10,11) have 1H nuclei coupled to 14N (spin 1). Packages that only accomodate spin ½ nuclei approximate heteronuclear coupling with homonuclear weak coupling. Here, we extend MARSS to include spin 1 nuclei and utilize synMARSS to systematically investigate the implications of this approximation. The new version of MARSS (available12) is now capable of simulating basis sets with spin systems including spin 1 nuclei (e.g. 14N, 2H), as well as other spin ½ nuclei (e.g. 31P and 13C).
Synthetic spectra were generated using 18 metabolites13 and one macromolecule signal consisting of 10 individual macromolecule resonances14. Metabolites with coupling to 14N were simulated using both the spin ½ weak homonuclear coupling approximation, and the actual heteronuclear coupling to spin 1 nuclei for the GE implementation of PRESS for TE = 30/144/288 ms and with 1283 spatial points, number of time-domain points/receiver bandwidth/field strength = 2048/2500 Hz/3 T. The synthetic spectra simulated with heteronuclear coupling were then fit to a basis set using homonuclear approximation to test the effect of this assumption on resulting concentration estimates. Linear-combination model (LCM) fitting was performed using INSPECTOR15 with a fit range of 0.0 to 4.2 ppm. Relative errors to the true input concentrations for the 19 molecules were then calculated.
Results
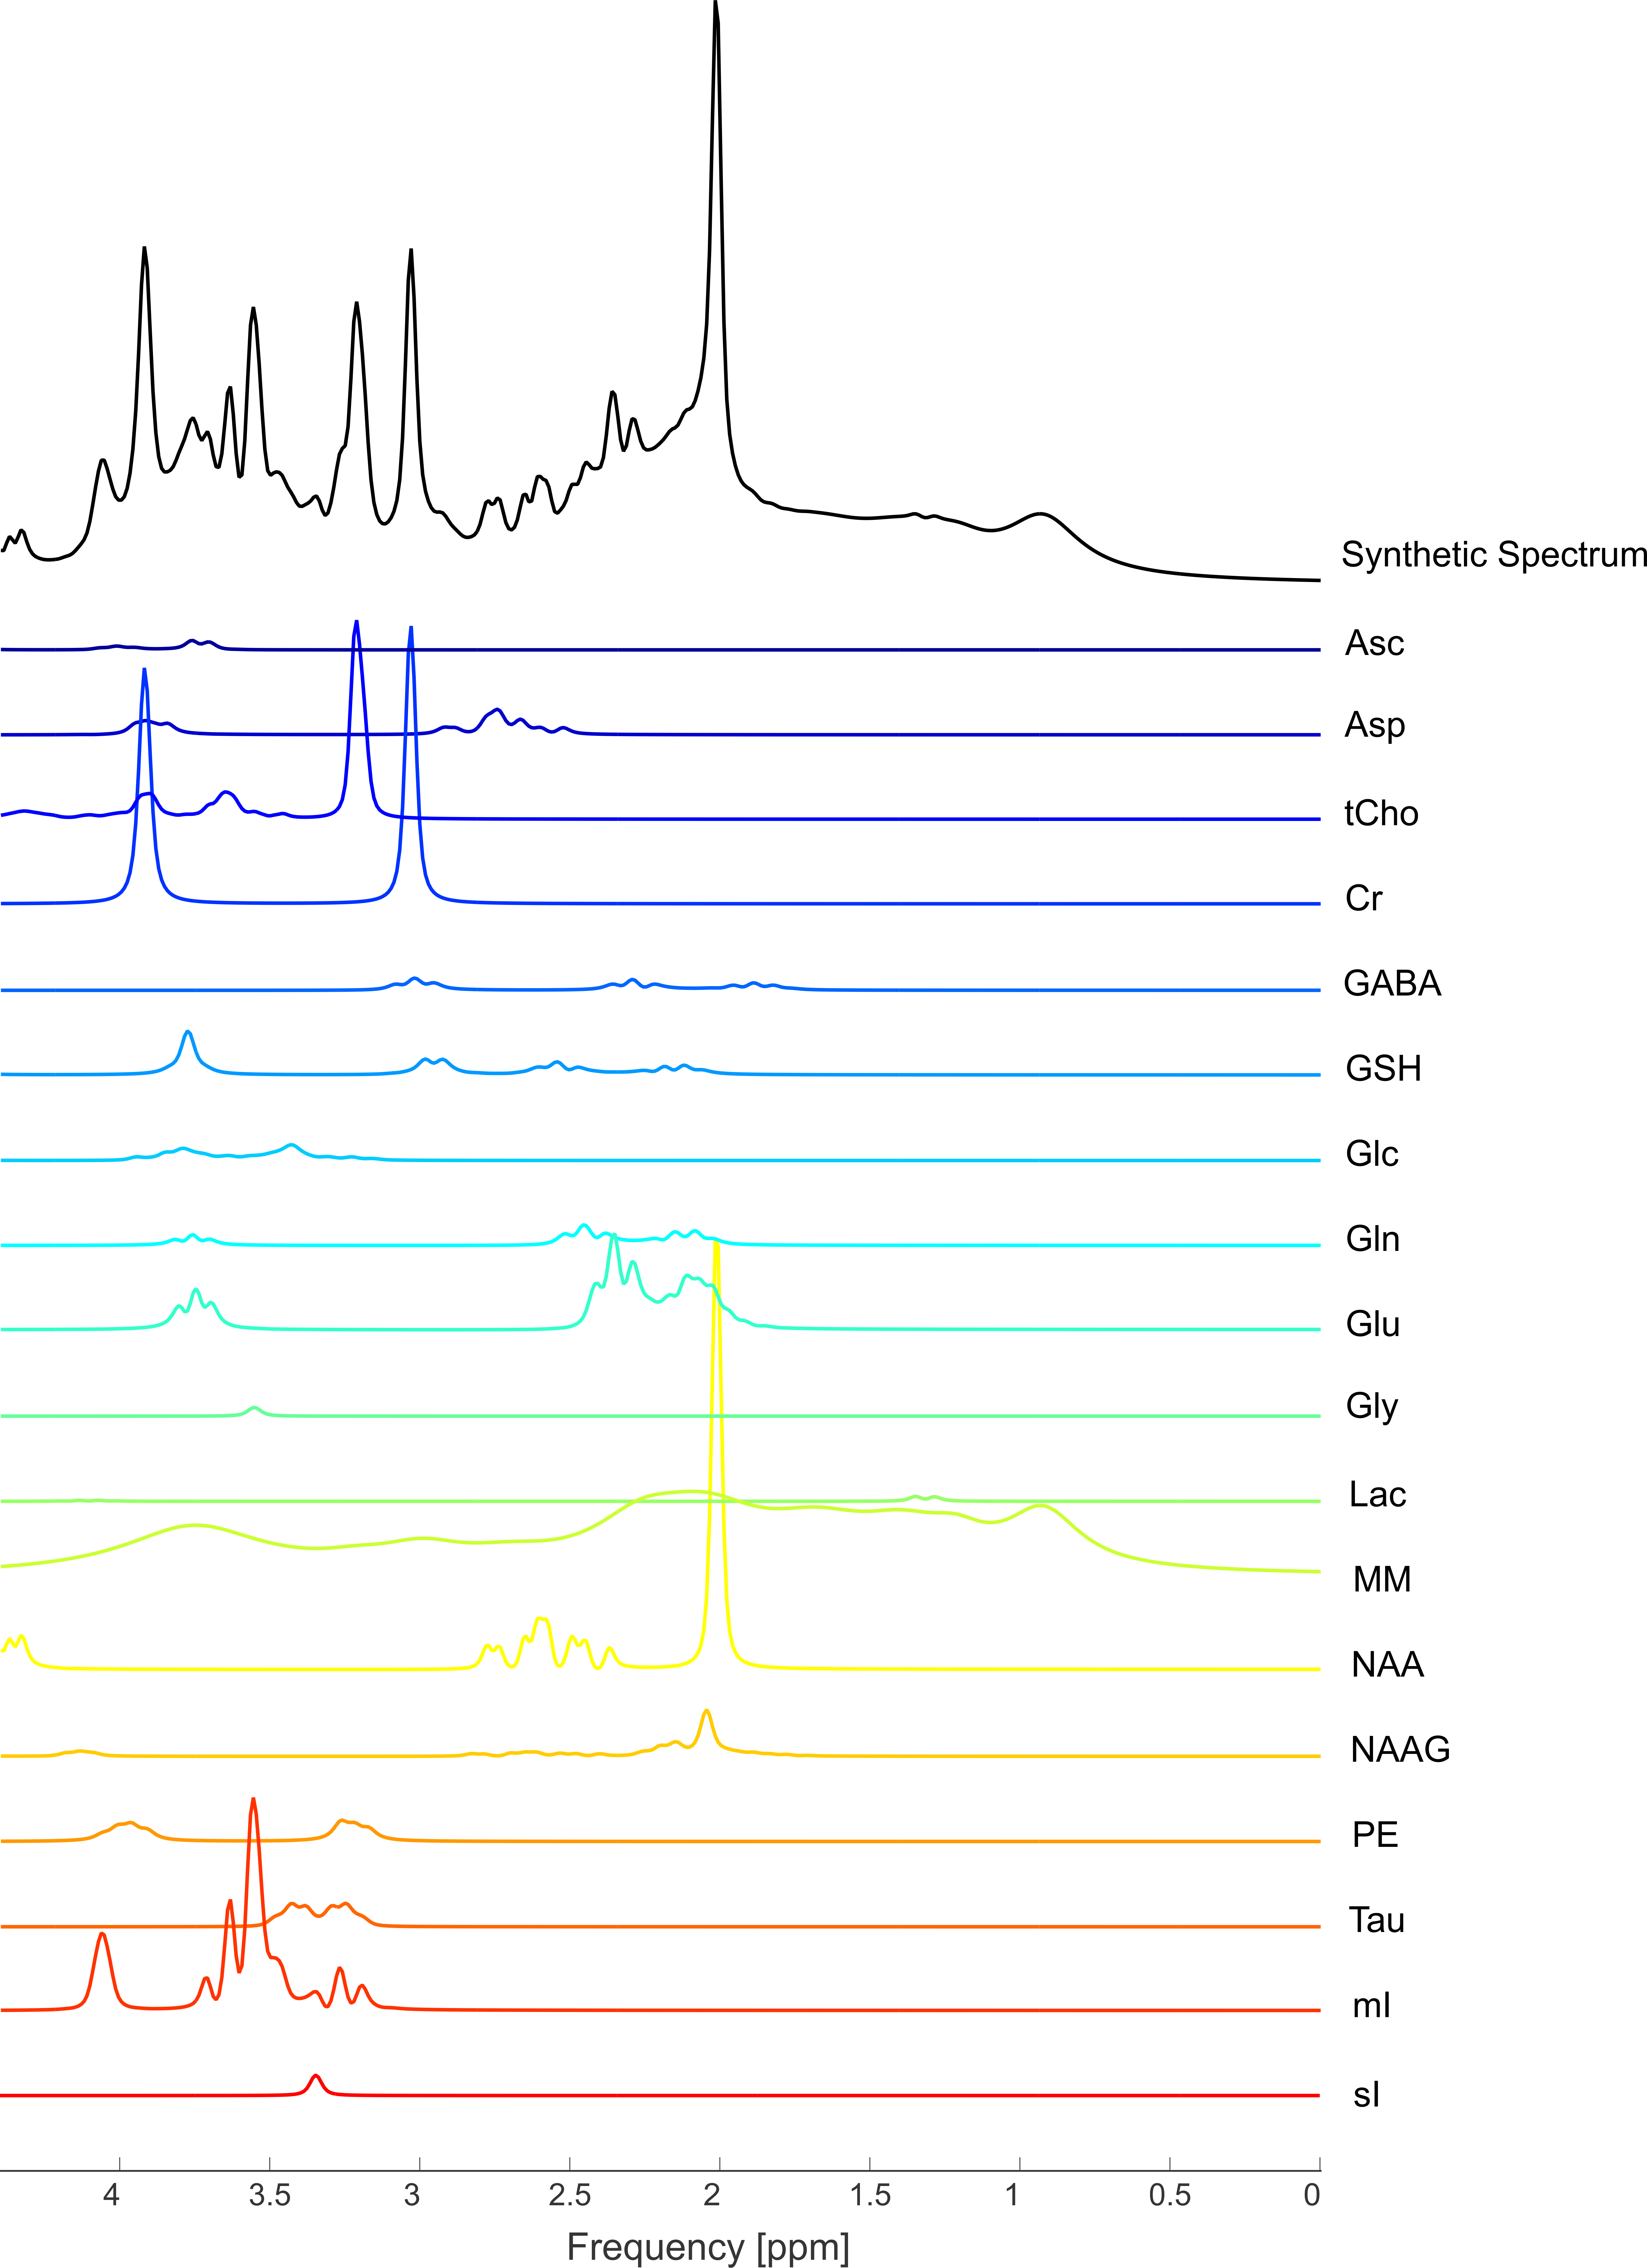
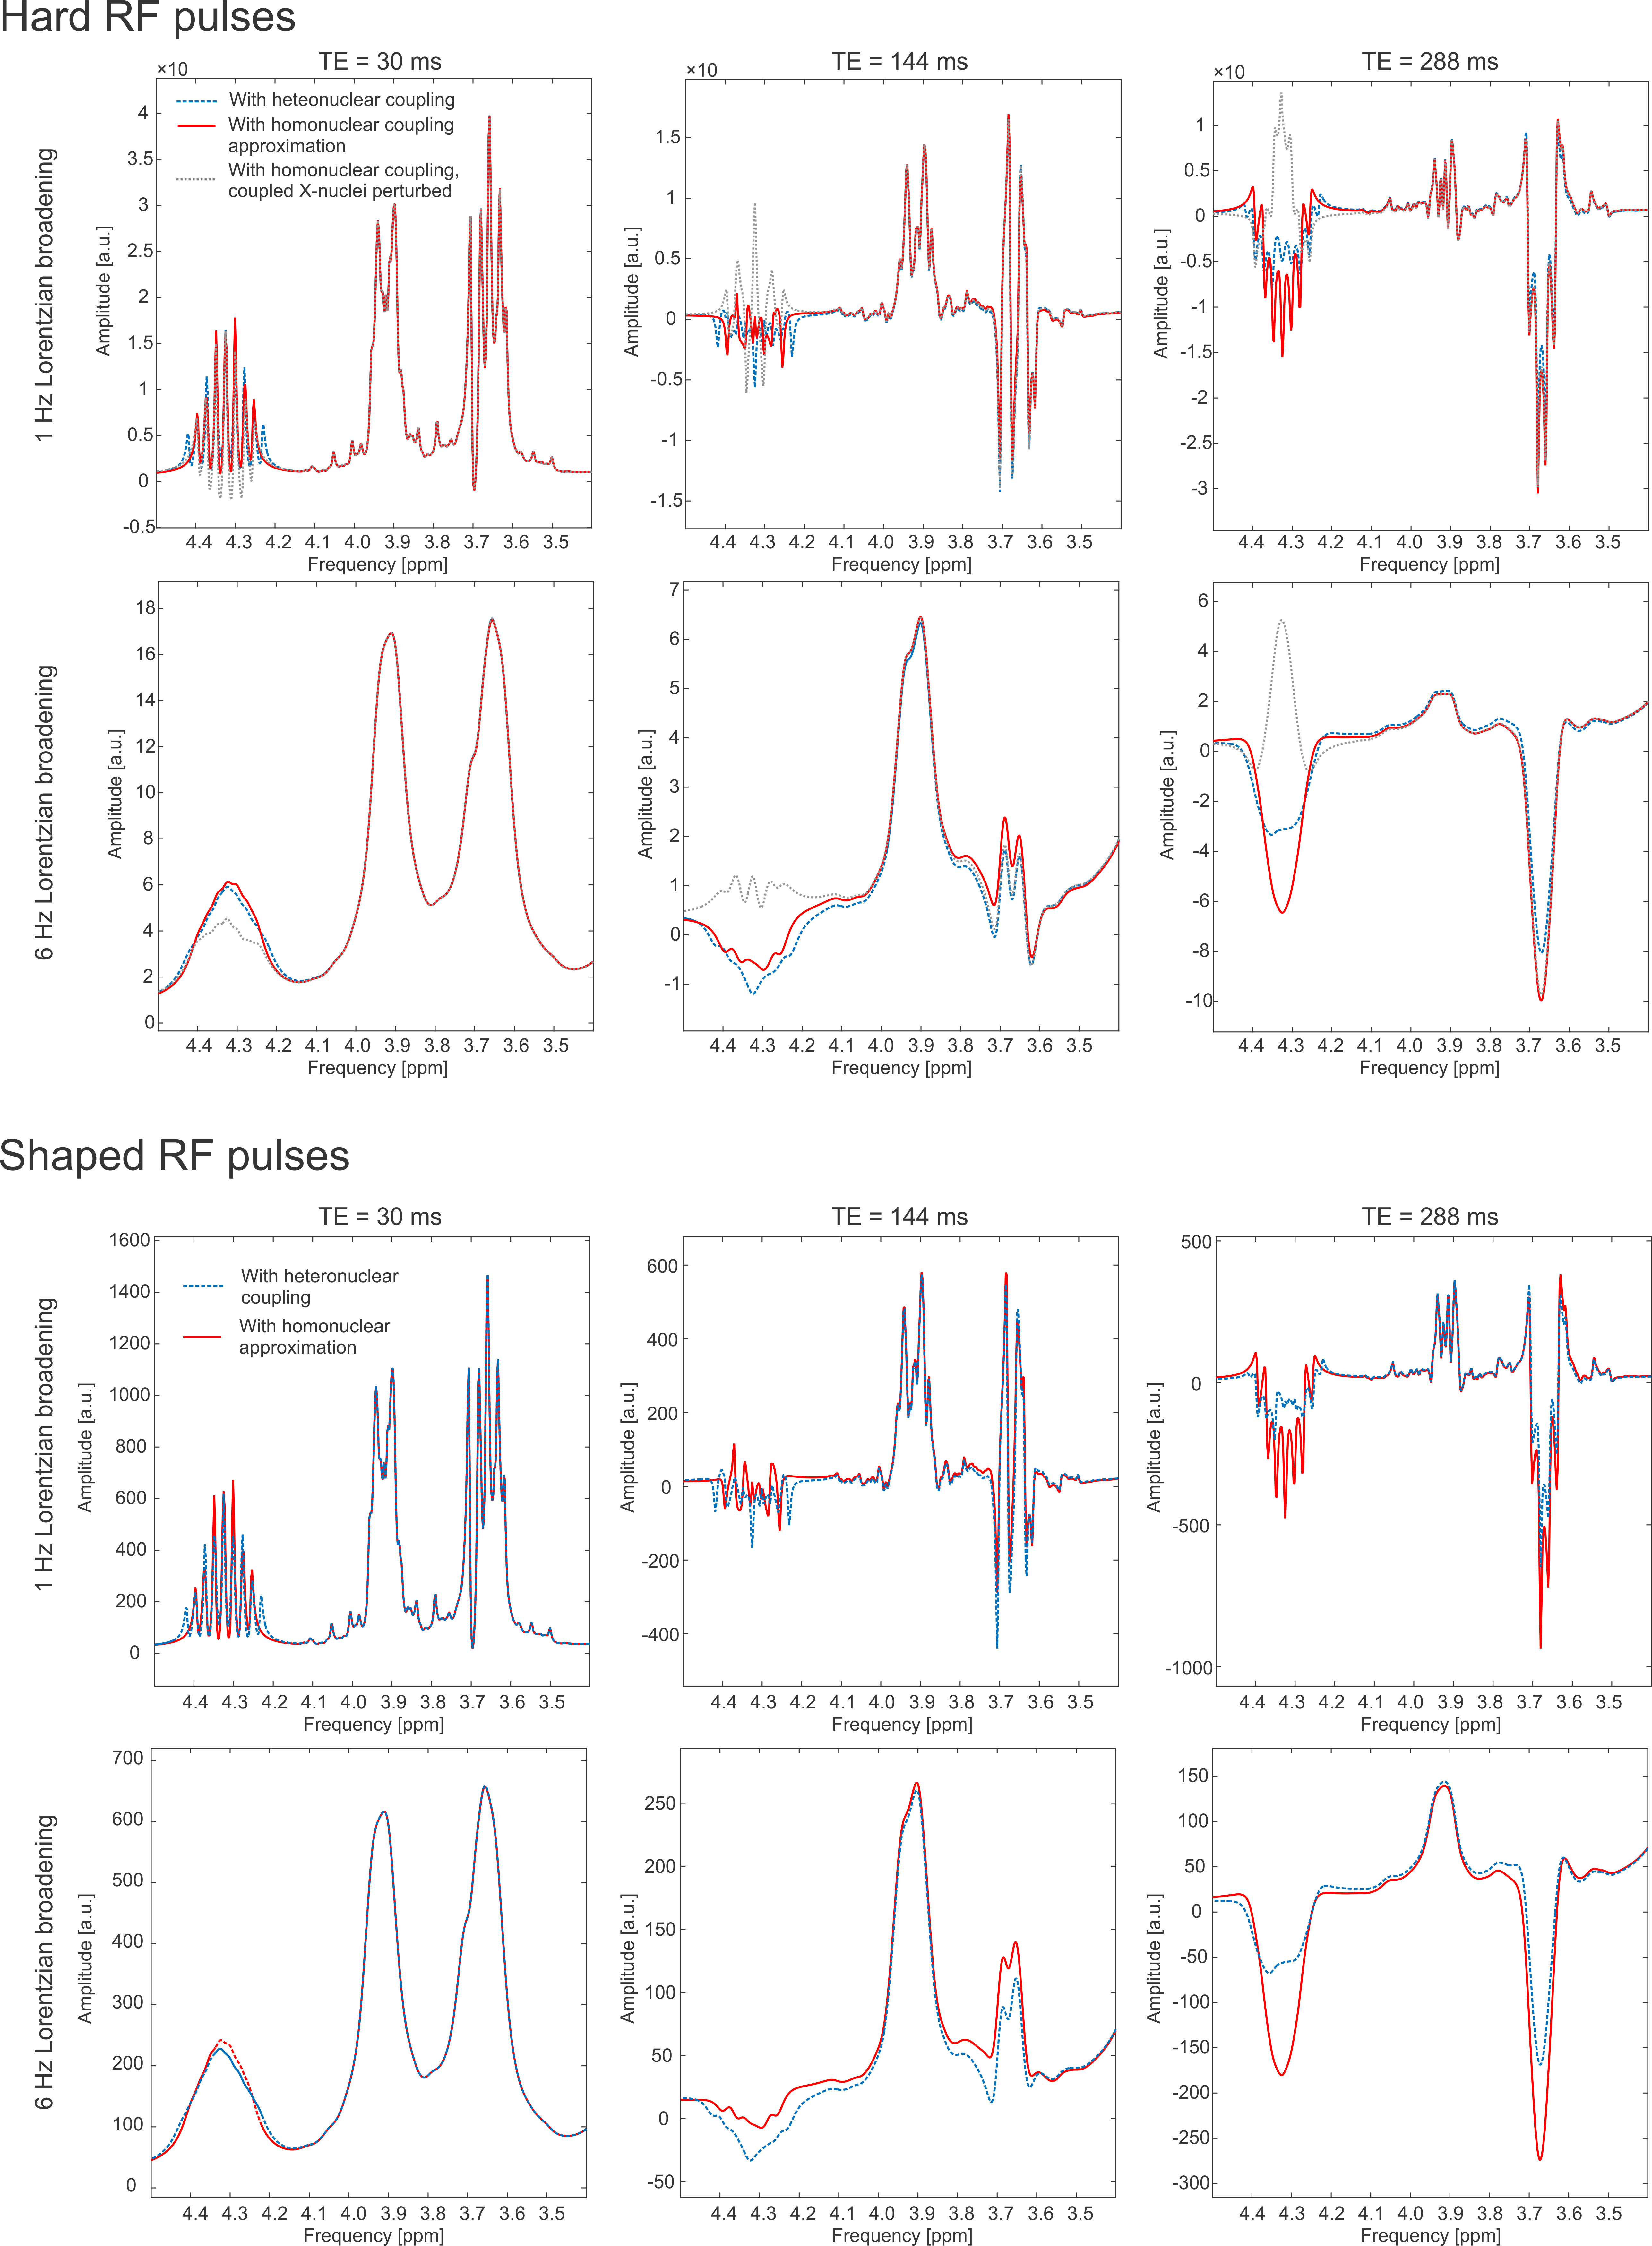
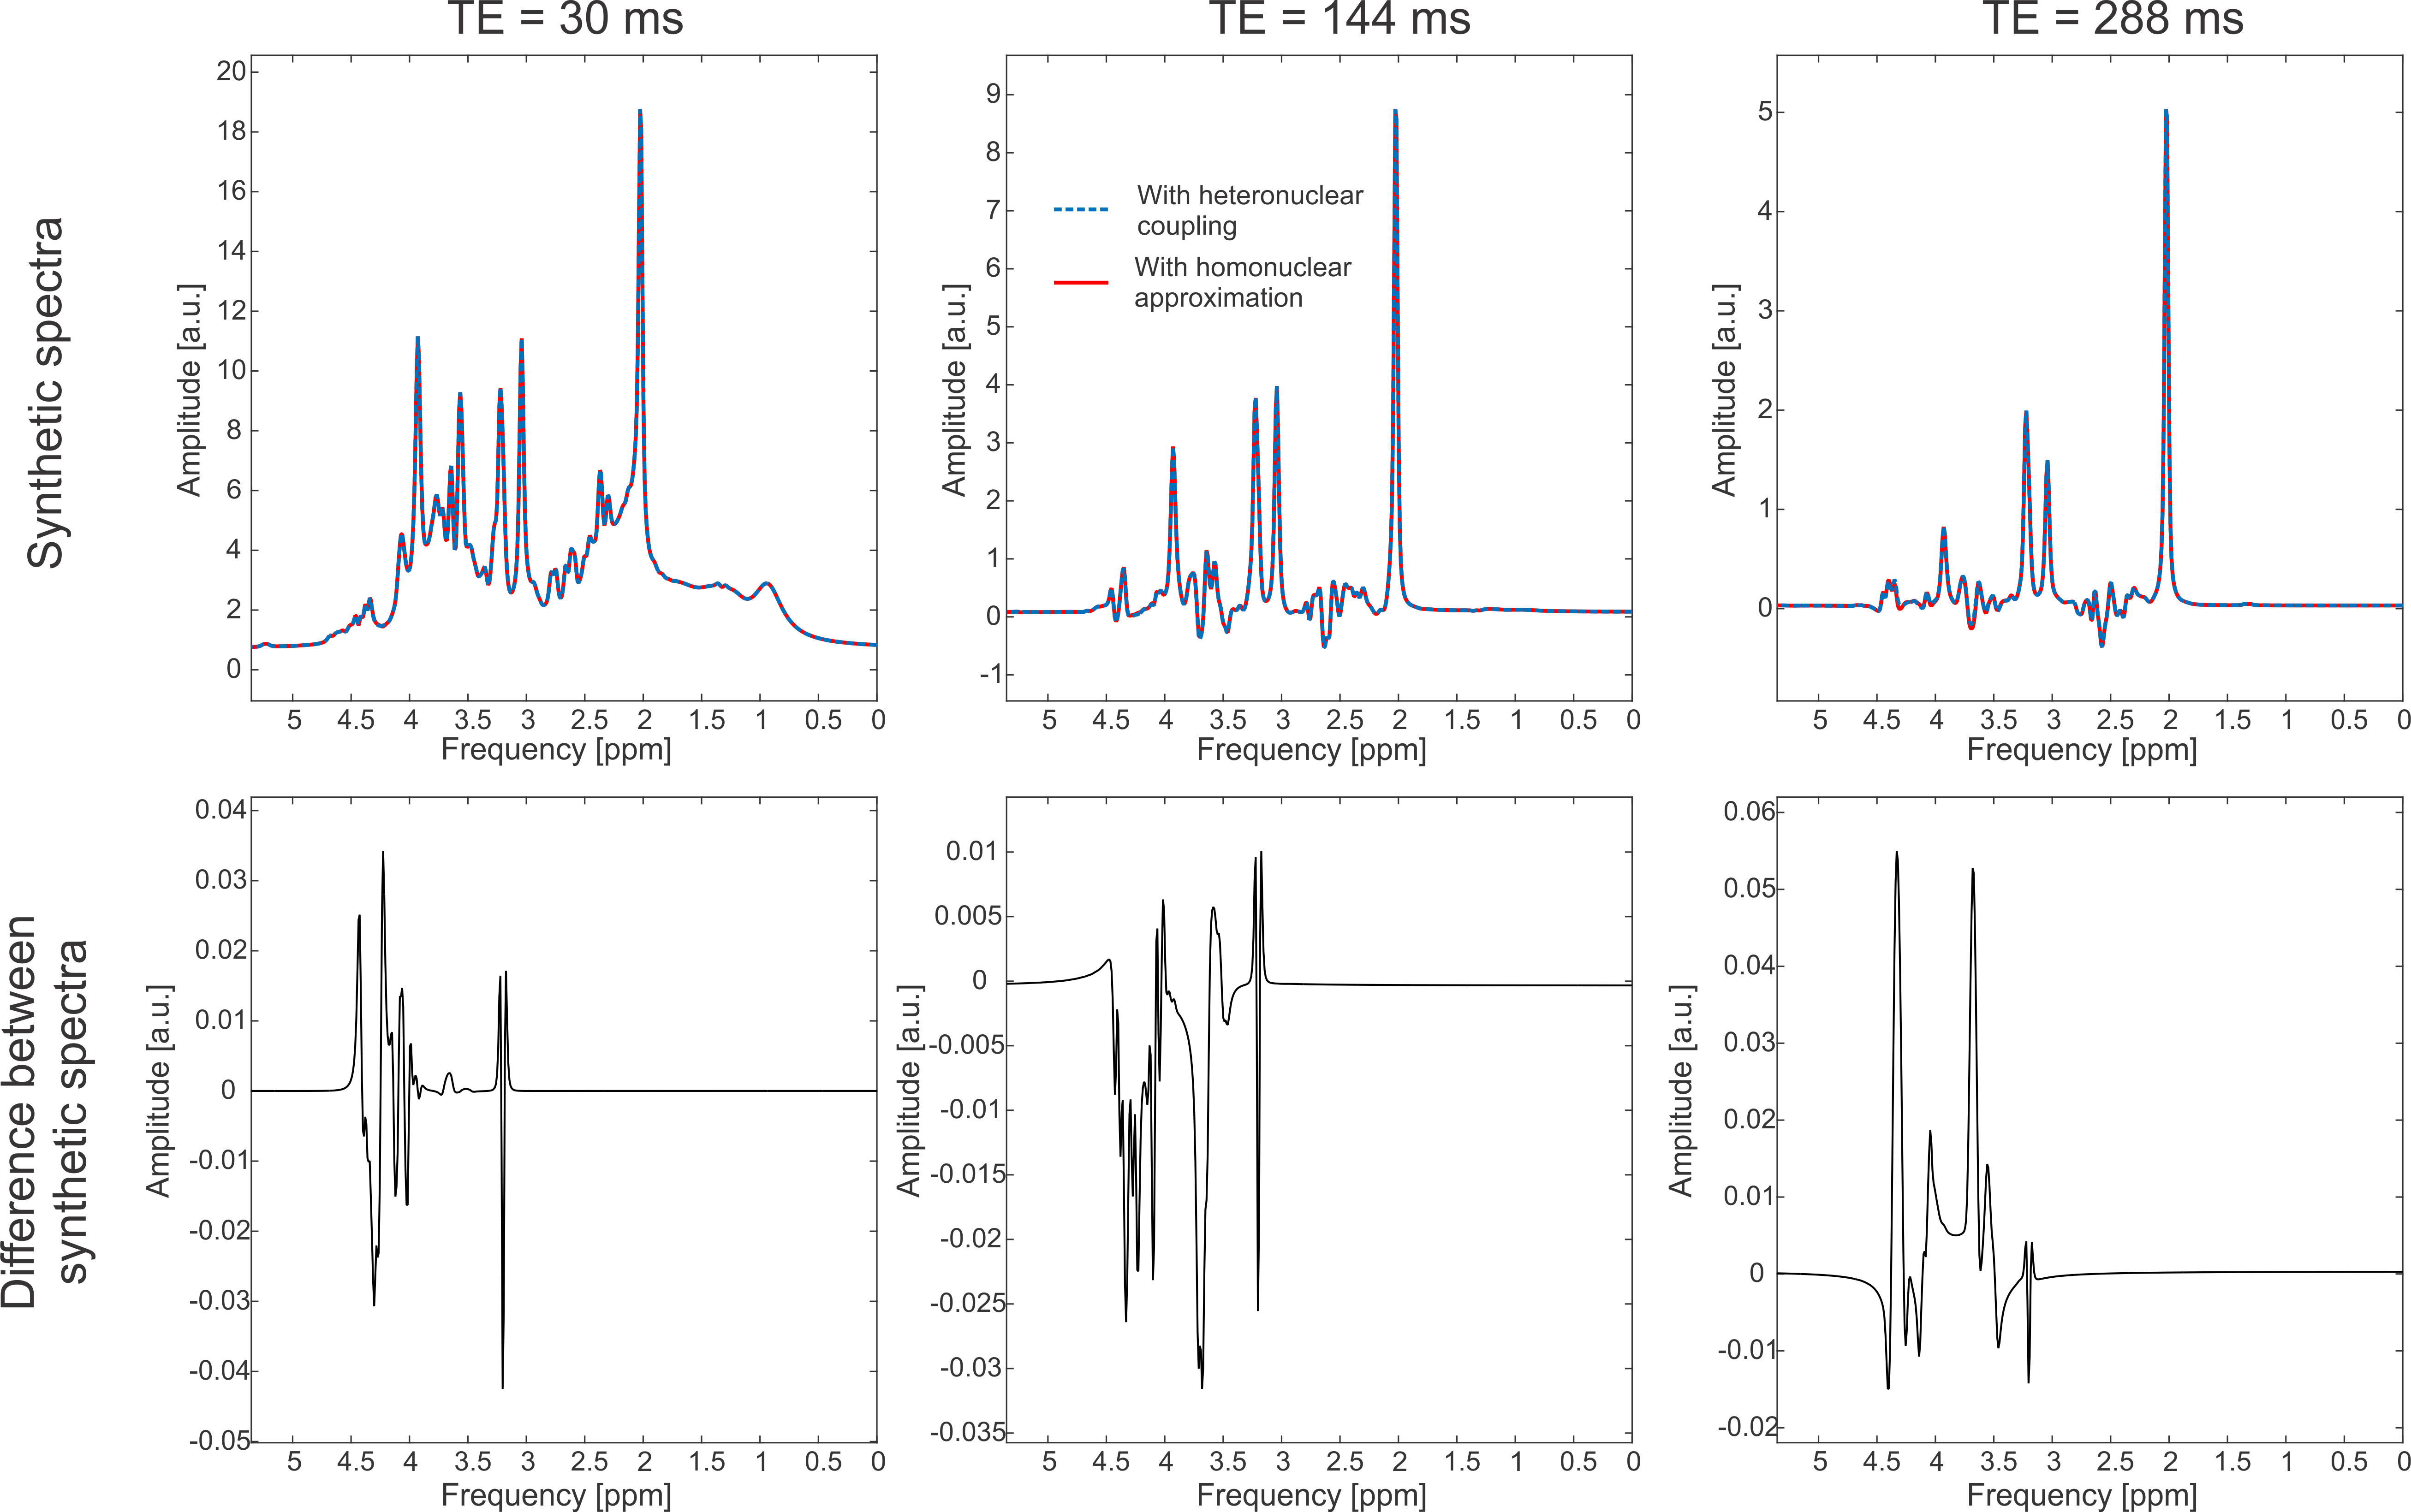
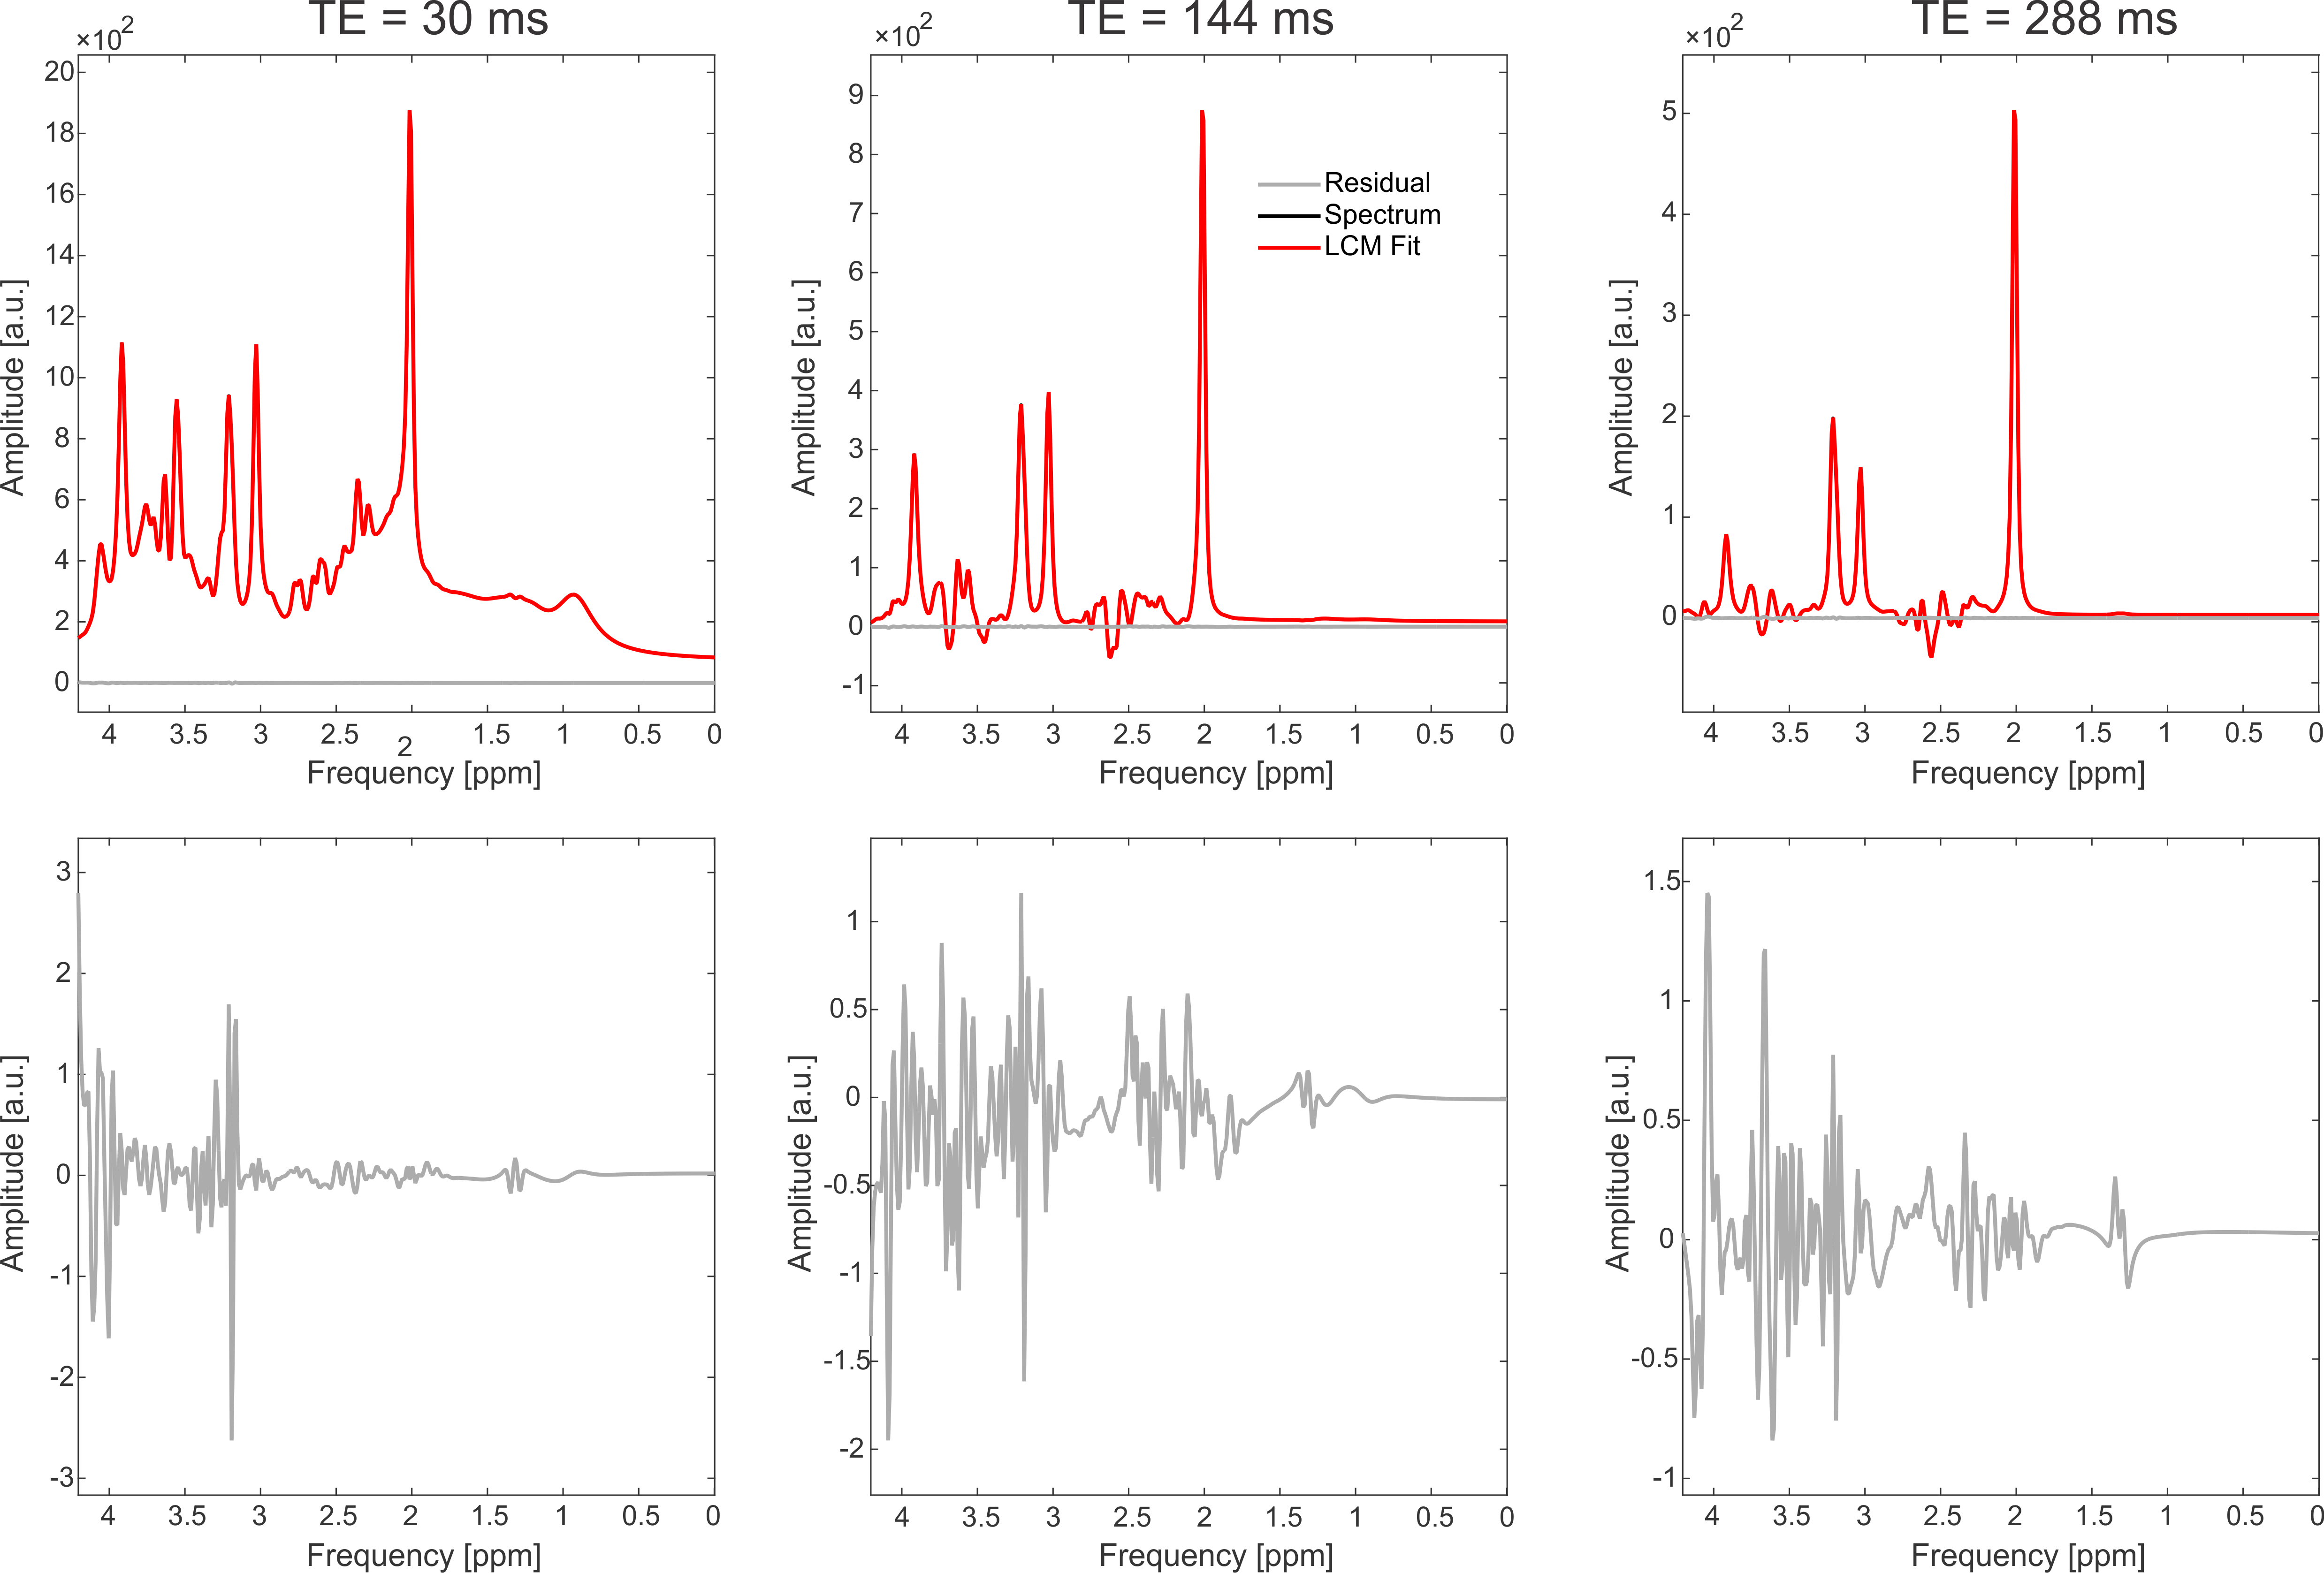
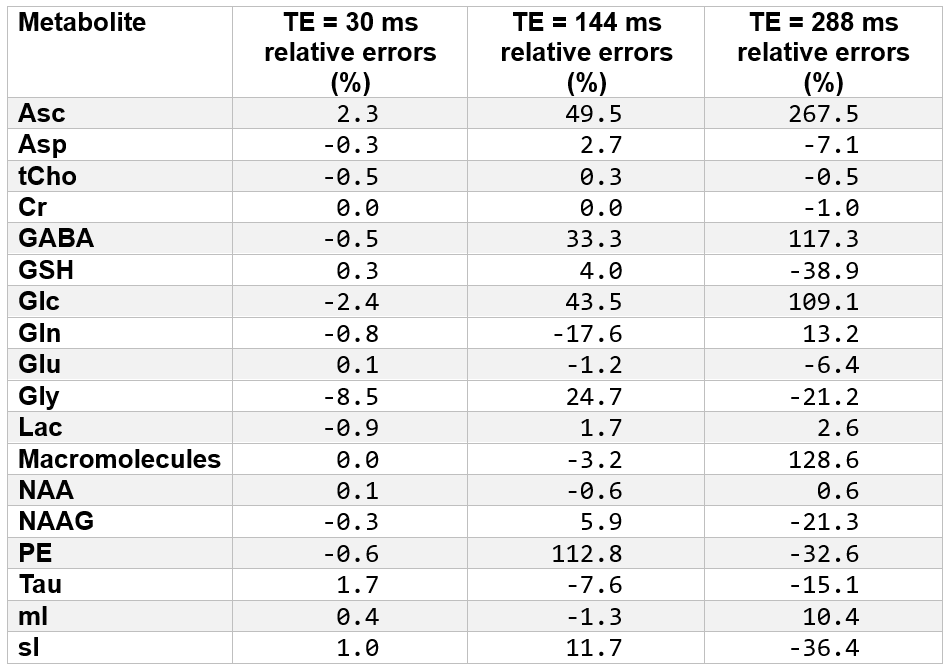
Realistic-appearing synthetic spectra can be generated with synMARSS by specifying concentrations, linewidths, T1 and T2 values and pulse sequence details (Figure 1). With synMARSS, it took 2 minutes after basis set simulation in MARSS to generate 10,000 synthetic spectra (achieved by inputting 10,000 sets of synthetic parameters) on a standard intel i7-8700K CPU 3.7 GHz processor for 29 different signals and 2048 spectral points, indicating the suitability to efficiently generate a large amount of training data.Subtle differences were observed in the simulations with/without the homonuclear coupling approximation, as can be seen for glycerol-phosphocholine (Figure 2), with the effect increasing with TE. Despite these noticeable differences, the synthetic spectra with/without the approximation are similar (Figure 3). Apparently excellent fits (i.e., small residual) were observed using the weak coupling homonuclear basis approximation (Figure 4). Concentration changes were small for prominent resonances (e.g. NAA), but large for small-amplitude metabolites (e.g. GABA, Glc) and the effect increased with TE (Table 1).
Conclusions
synMARSS enables generating experimentally realistic synthetic spectra for an arbitrary MRS sequence given additional MRS tissue parameters. MARSS has been extended to include spin 1 nuclei and can be used for 1H simulations involving heteronuclear coupling to spin 1 nuclei (typically 14N), or 2H MRS spectral simulations. It was shown that approximating 14N heteronuclear coupling as weak homonuclear coupling has small effects on the quantified concentrations for PRESS at short TE, but the effects may be substantial at longer TEs, particularly for low-amplitude metabolites.Acknowledgements
No acknowledgement found.References
1. Landheer, K., Gajdosik, M. & Juchem, C. The effects of basis sets on magnetic resonance spectroscopy quantification for stock PRESS sequences, a simulation study. Proc ISMRM 2830 (2021) doi:10.1002/nbm.4350.
2. Landheer, K., Gajdošík, M. & Juchem, C. A semi-LASER, single-voxel spectroscopic sequence with a minimal echo time of 20.1 ms in the human brain at 3 T. NMR Biomed. 33, 1–12 (2020).
3. Bolliger, C. S., Boesch, C. & Kreis, R. On the use of Cramér-Rao minimum variance bounds for the design of magnetic resonance spectroscopy experiments. Neuroimage 83, 1031–40 (2013).
4. Hatami, N., Sdika, M. & Ratiney, H. Magnetic resonance spectroscopy quantification using deep learning. Med. Image Comput. Comput. Assist. Interv. - MICCAI 2018 doi:10.1007/978-3-030-00928-1_53.
5. Rizzo, R., Dziadosz, M., Kyathanahally, S., Shamaei, A. & Kreis, R. Quantification of MR spectra by deep learning in an idealized setting: Investigation of forms of input, network architectures, optimization by ensembles of networks, and training bias. Magn Reson Med 89, 1707–1727 (2022).
6. Dziadosz, M., Rizzo, R., Kyathanahally, K. & Kreis. Denoising single MR spectra by deep learning: Miracle or mirage? Magn Reson Med 90, 1749–1761 (2023).
7. Landheer, K., Swanberg, K. M. & Juchem, C. Magnetic Resonance Spectrum Simulator (MARSS), A Novel Software Package for Fast and Computationally Efficient Basis Set Simulation. NMR Biomed e4129 (2019).
8. Clarke, W. T., Stagg, C. J. & Jbabdi, S. FSL-MRS: An end-to-end spectroscopy analysis package. Magn. Reson. Med. 85, 2950–2964 (2021).
9. Simpson, R., Devenyi, G. A., Jezzard, P., Hennessy, T. J. & Near, J. Advanced processing and simulation of MRS data using the FID appliance (FID-A)—An open source, MATLAB-based toolkit. Magn Reson Med 77, 23–33 (2017).
10. Govindaraju, V., Young, K. & Maudsley, A. A. Proton NMR chemical shifts and coupling constants for brain metabolites. NMR Biomed 13, 129–153 (2000).
11. Govind, V., Young, K. & Maudsley, A. A. Corrigendum to Proton NMR chemical shifts and coupling constants for brain metabolites. [NMR Biomed. 13, (2000), 129-153]. NMR Biomed. 28, 923–924 (2015).
12. Landheer, K. & Juchem, C. Magnetic Resonance Spectrum Simulator - MARSS. http://innovation.columbia.edu/technologies/CU19215_MARSS.
13. Landheer, K., Gajdosik, M. & Juchem, C. Semi-LASER Single-Voxel Spectroscopic Sequence with Minimal Echo Time of 20 ms in the Human Brain at 3 T. NMR Biomed e4324 (2020).
14. Landheer, K., Gajdosik, M., Treacy, M. & Juchem, C. Concentration and T2 Relaxation Times of Macromolecules at 3 Tesla. Magn Reson Med 84, 2327–2337 (2020).
15. Gajdosik, M., Landheer, K., Swanberg, K. M. & Juchem, C. INSPECTOR: Free Software for Magnetic Resonance Spectroscopy Data Inspection, Processing, Simulation and Analysis. Sci. Rep. 11, 2094 (2021).
16. Wyss, P. O. et al. In Vivo Estimation of Transverse Relaxation Time Constant (T2) of 17 Human Brain Metabolites at 3T. Magn Reson Med 80, 452–461 (2018).
Figures