2989
Deep Learning Framework for Quantifying High-Resolution MRSI Data of the Human Brain at 7T1Department of Electrical and Software Engineering, Schulich School of Engineering, The University of Calgary, Calgary, AB, Canada, 2Department of Biomedical Imaging and Image-guided Therapy, Radiology and Nuclear Medicine, Medical University of Vienna, Vienna, Austria, 3Christian Doppler Laboratory for MR Imaging Biomarker Development, Vienna, Austria
Synopsis
Keywords: Data Processing, Machine Learning/Artificial Intelligence, Magnetic Resonance Spectroscopic Imaging (MRSI); Metabolite Quantification; Uncertainty Estimates; Quantitative MRSI Analysis
Motivation: Addressing challenges in ultra-short TE MRSI data quantification of the Human Brain at 7T utilizing deep learning
Goal(s): Develop a Variational Physics-Informed Autoencoder (VPIAE) to enhance MRSI metabolite quantification, ensuring faster, robust, and efficient metabolite mapping with uncertainty estimates.
Approach: Combine a variational autoencoder with a physics-informed decoder, training on 7T MRSI brain data, and benchmark against a traditional method (LCModel)
Results: VPIAE outperforms conventional MRSI methods in speed by 6 orders of magnitude, offers comparable accuracy, and provides uncertainty estimates for reliable interpretation, promising advancements in clinical and research applications.
Impact: VPIAE enables swift MRSI analysis, crucial for clinicians diagnosing neurological conditions and researchers studying metabolic brain changes. It opens avenues for exploring brain metabolite dynamics with greater fidelity and advancing the field's understanding of brain metabolism.
INTRODUCTION
Magnetic Resonance Spectroscopic Imaging (MRSI) is a powerful tool for quantifying metabolite concentrations in vivo [1], [2]. Yet, it faces significant challenges including broad and overlapping peaks at low magnetic fields, low sensitivity, and large signal backgrounds from macromolecules and lipids [1], [3]. Additionally, traditional spectral analysis methods are computationally intensive and slow, limiting their practicality in clinical settings [4], [5]. To address these issues, we introduce a Variational Physics-Informed Autoencoder (VPIAE) framework for high-resolution MRSI quantification with simultaneous uncertainty estimation, which promises faster and more reliable metabolite quantification.METHODS
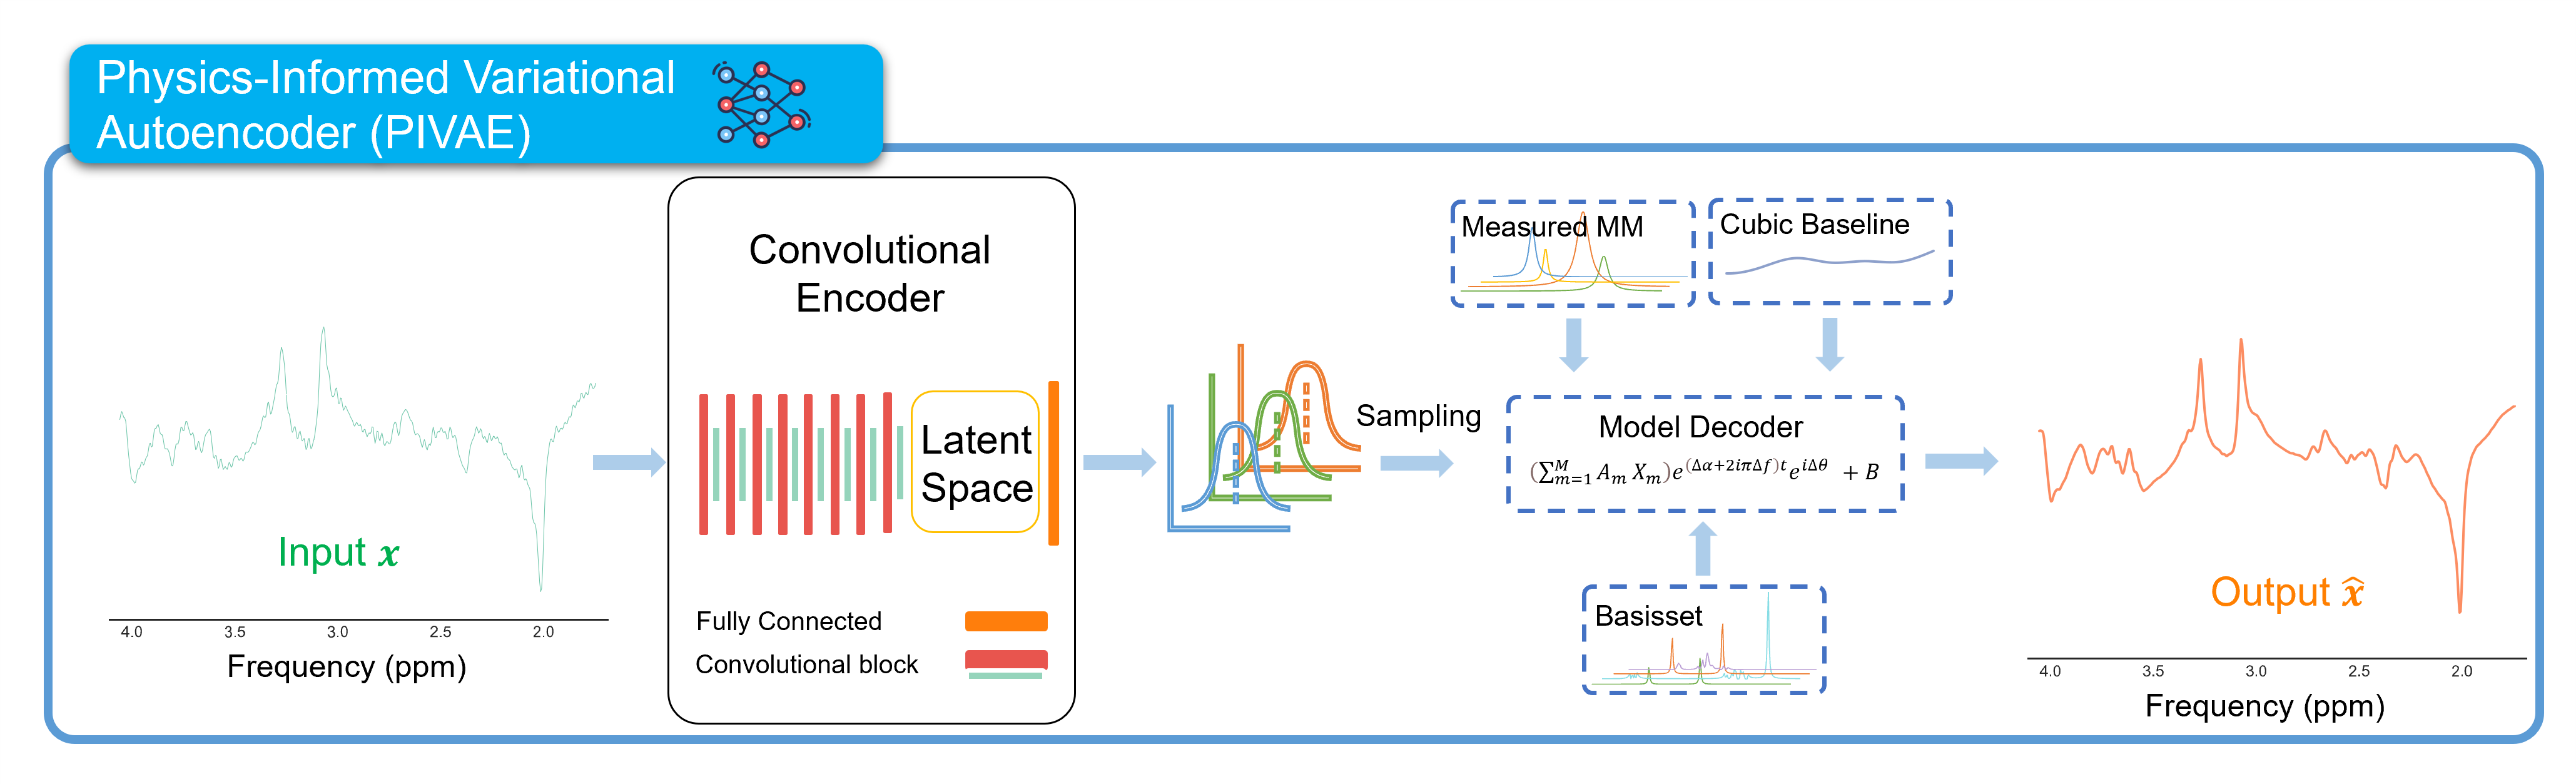
The VPIAE architecture combines a variational autoencoder with a physics-informed model-decoder, optimizing metabolite quantification using the Evidence Lower Bound (ELBO) objective. This enables (1) interpretable estimation of parameters and (2) the calculation of CRLB, which can be considered to be adequate at estimating aleatoric uncertainties [6]. Training our proposed network is an unsupervised learning task that does not require ground truth values. It minimizes the differences between the original input and the consequent reconstructions in the range 1.8-3.8 ppm. Therefore, the network learns to output distribution parameters of the model-decoder over the latent space. The mathematical representation of the loss function of training can be written as follows:$$
\mathcal{L} = \text{MSE}(x,\text{Fit}) - \frac{1}{2} \sum_{m=1}^{\mathbf{M}}\left(1+\ln{\sigma_m}^2 - \sigma_m^2\right)
$$
where $$$\text{MSE}$$$ is the mean square error, $$$x$$$ and $$$\text{Fit}$$$ are the $$$n$$$-dimensional input vector ($$$x$$$ ∈ $$$R^n$$$) of the encoder and the $$$n$$$-dimensional output vector ( ̂$$$\text{Fit}$$$ ∈ $$$R^n$$$) of the model-decoder (in frequency domain), respectively. $$$\sigma_m$$$ is the variational standard deviation of $$$m$$$-th metabolite amplitude. A linear combination of natural cubic spline basis functions is utilized to estimate the smooth baseline. The spline function is differentiable, and the coefficients are obtained from the encoder. This allows the baseline to be optimized as part of the model. We used 8 knots, with 2 knots located at the edges of the fit range and 2 additional knots outside of the fit range. All steps were run on a computer with an Intel Core™ i9-13900HX processor and one graphics processing unit (GeForce RTX 4080). The PIVAE was implemented in Python. The approach is demonstrated using high-resolution 7T MRSI data of the human brain, and its performance is benchmarked against a traditional quantification method. Echo-less slab-selective 3D MRSI data were encoded via concentric ring trajectories within a spherical kSpace [8] with FOV:220x220x133 mm, matrix size: 64x64x33, resolution 3.4x3.4x4.0mm, TA: 8:30 min, TR: 200ms, TE:1.3 ms, excitation flip angle 34 deg., bandwidth: 2778 Hz, with water suppression. Our study included nine subjects, with seven used for training our model (122473 spectra) and two for testing (39051 spectra), which were also analyzed using LCModel software for comparison.
RESULTS
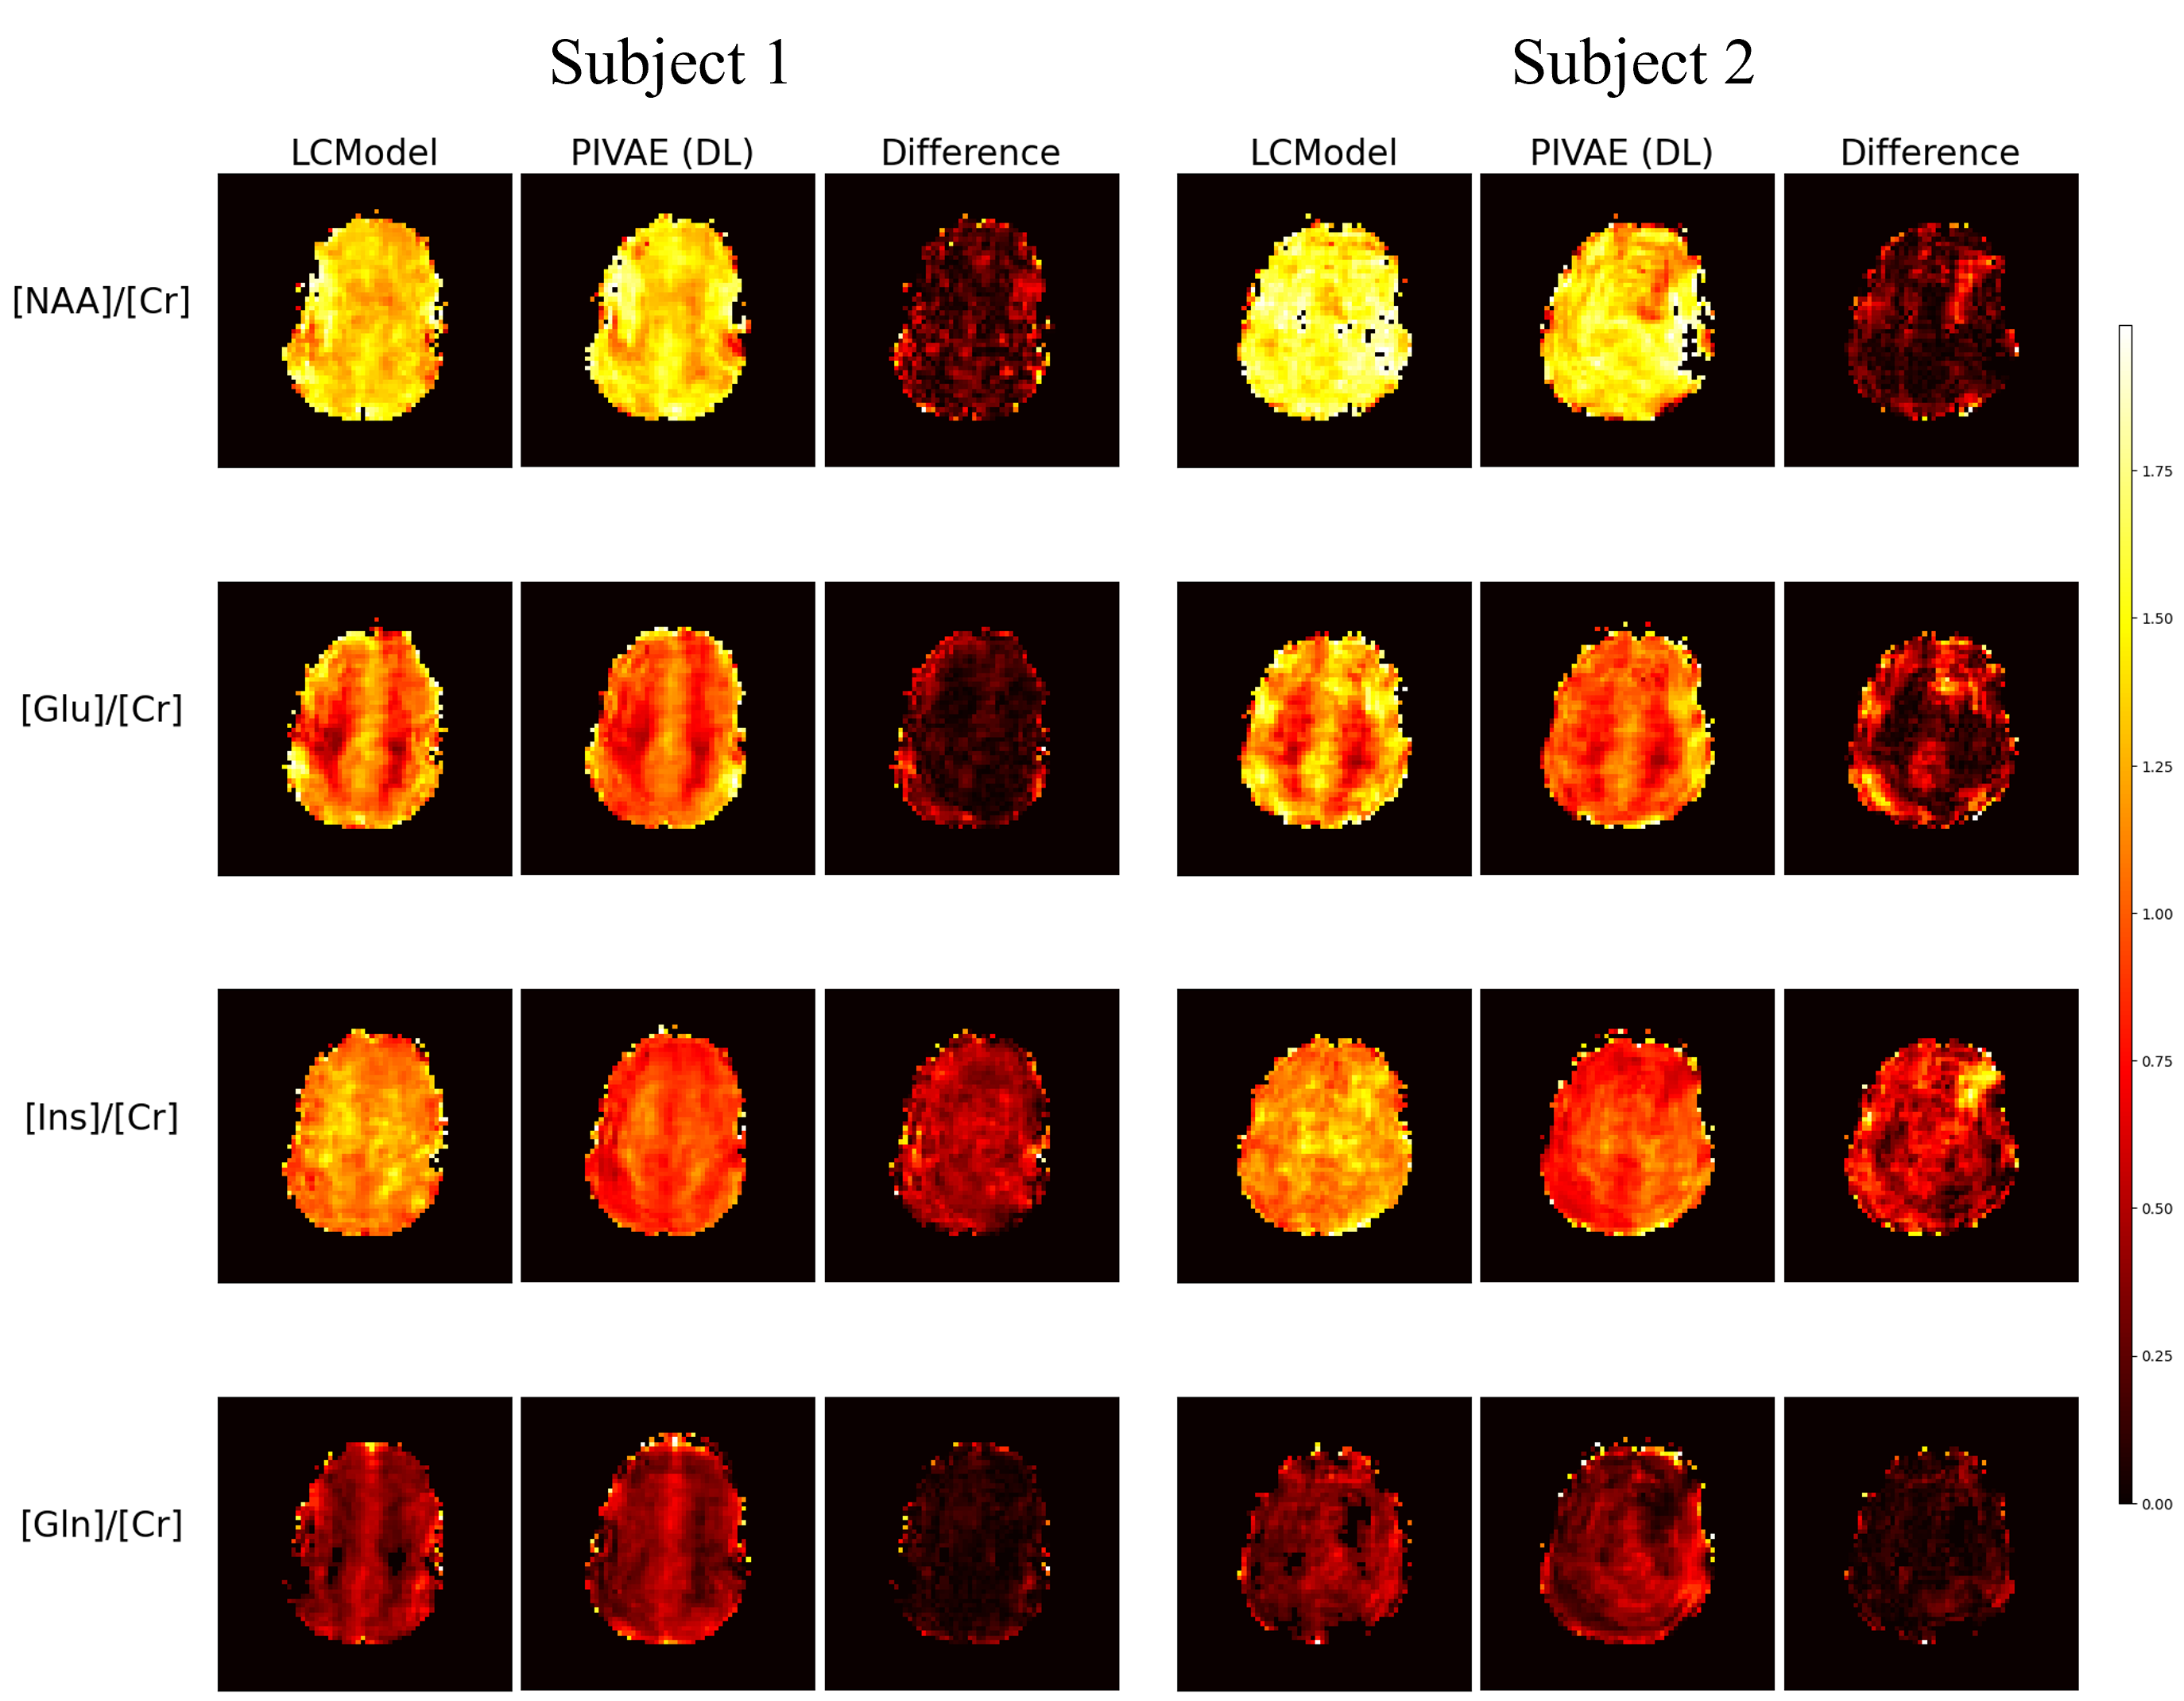
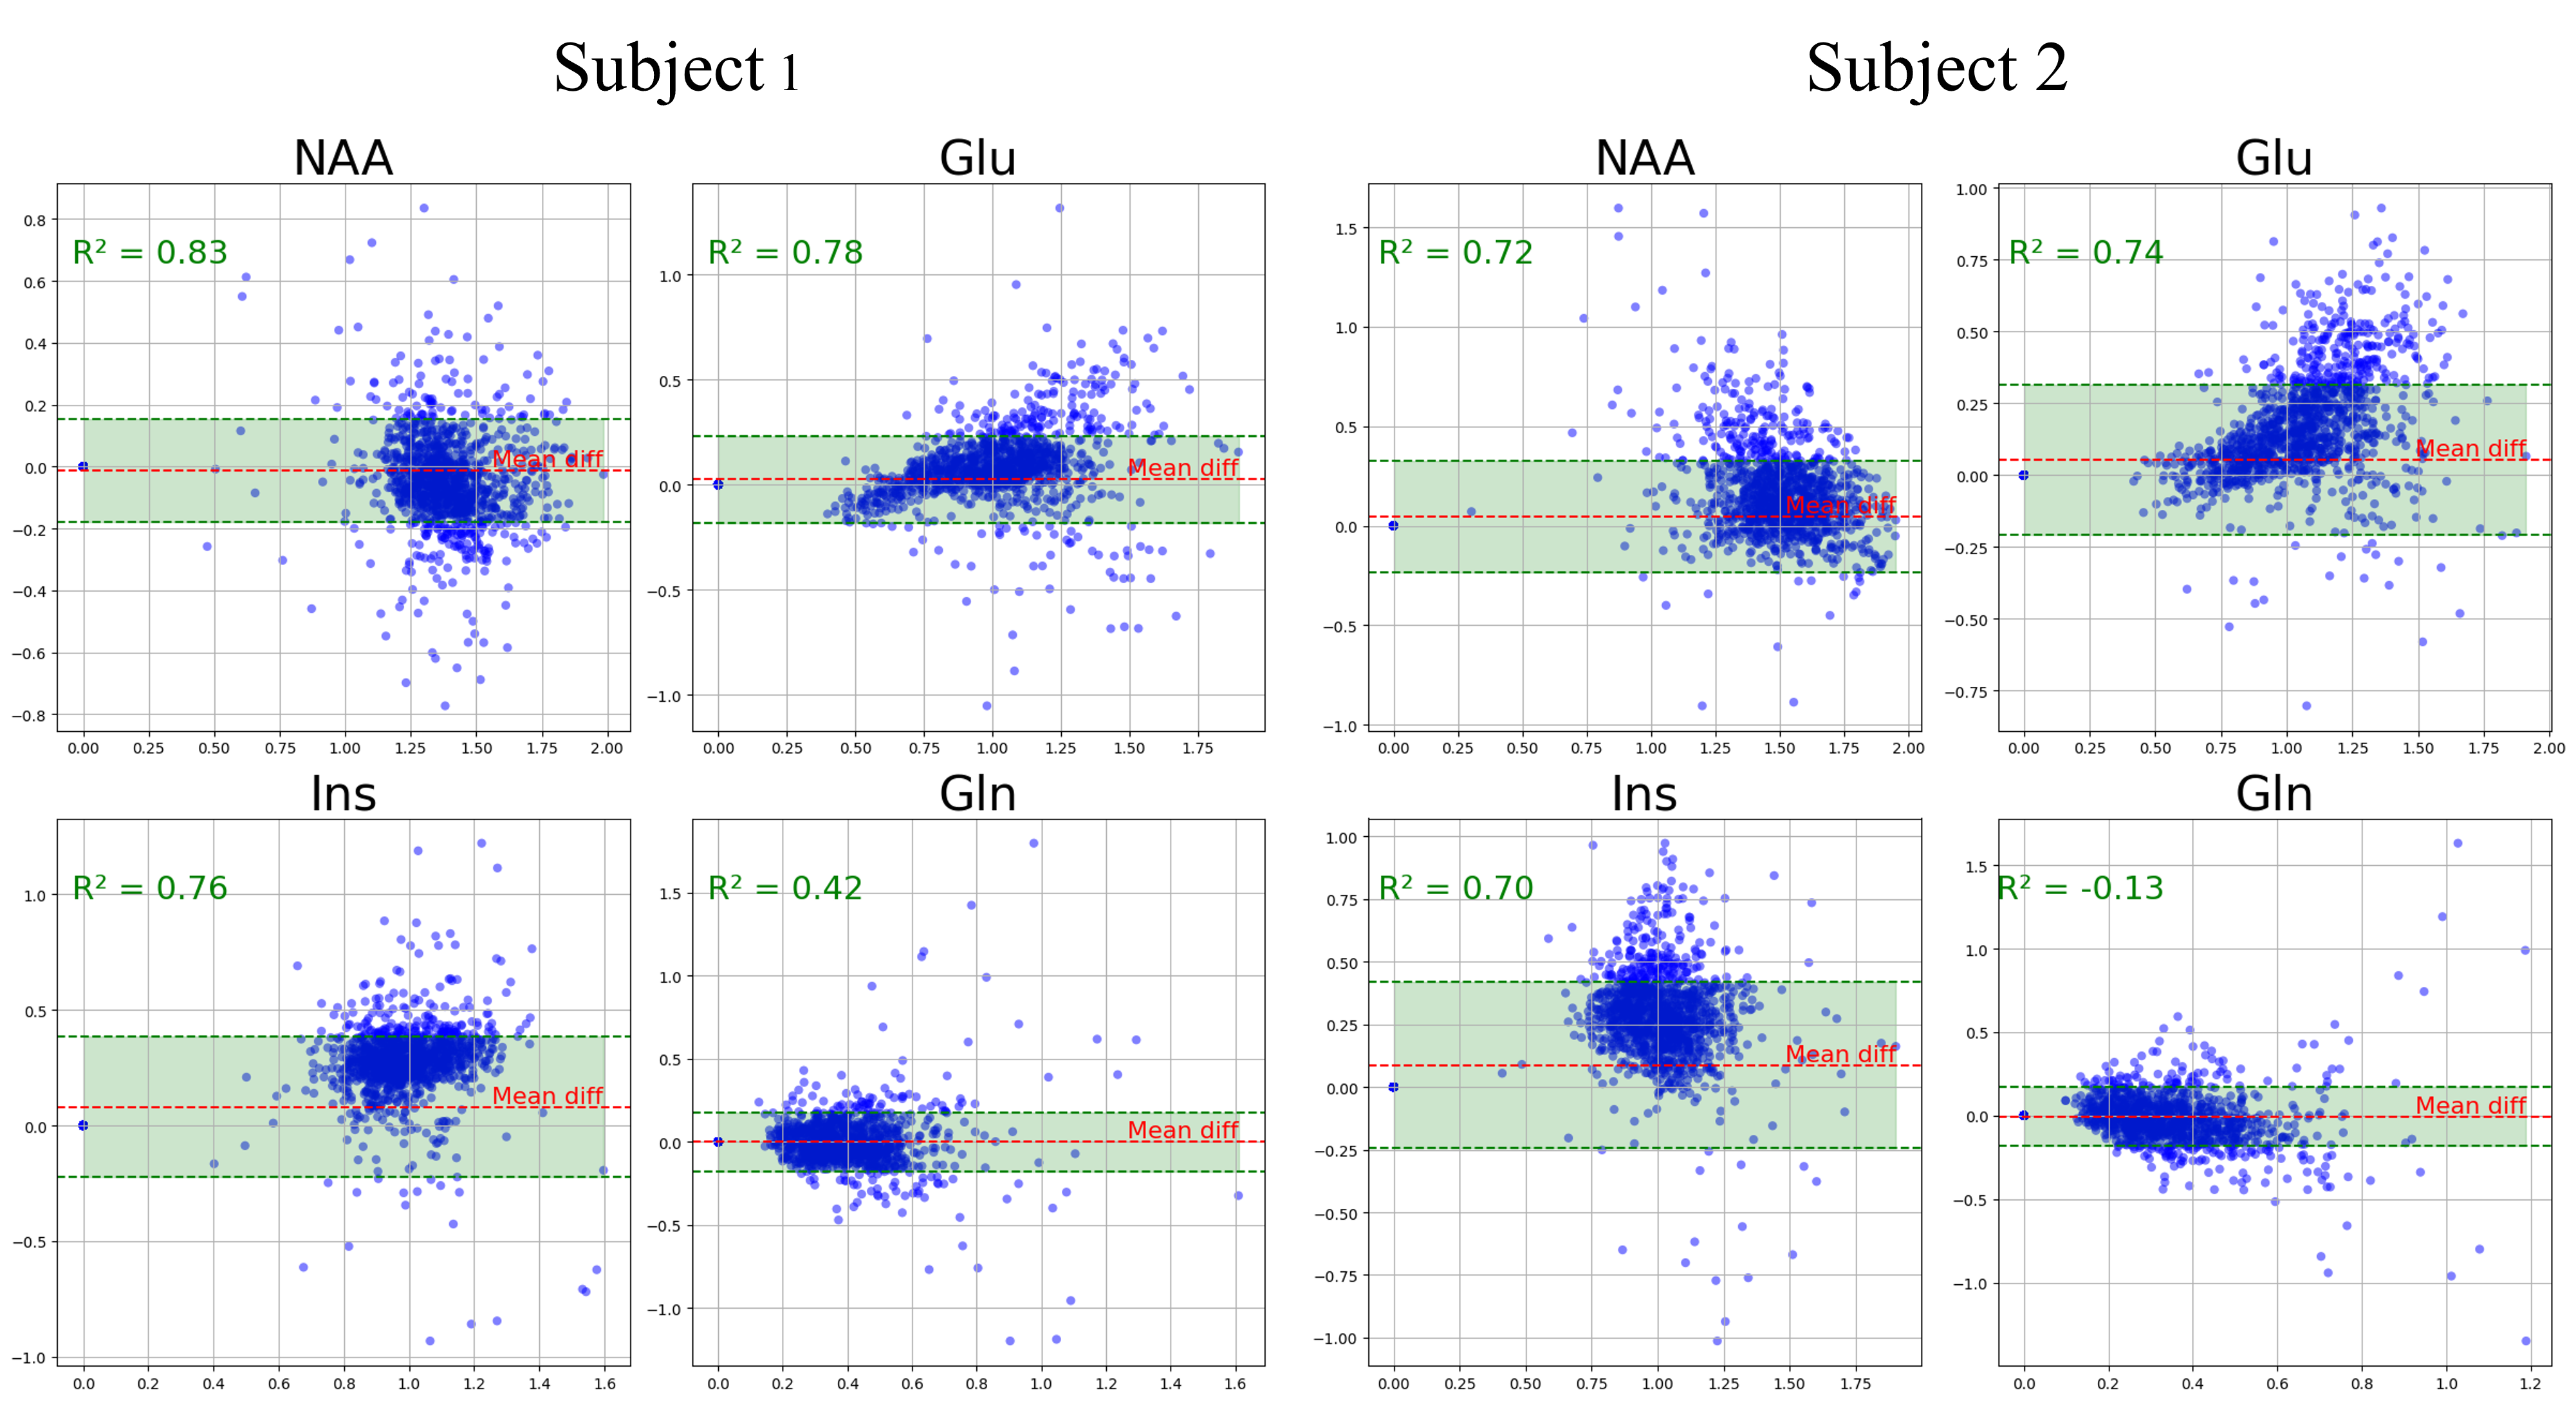
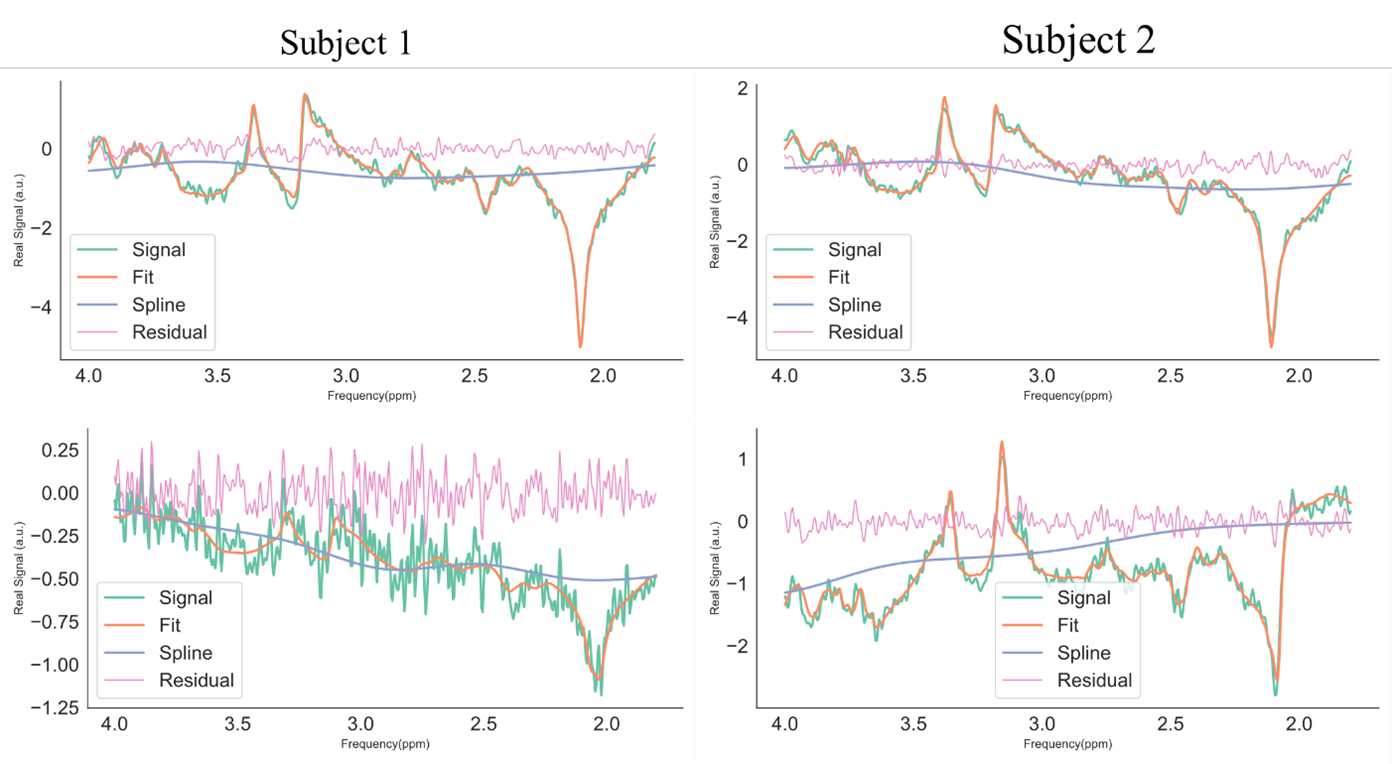
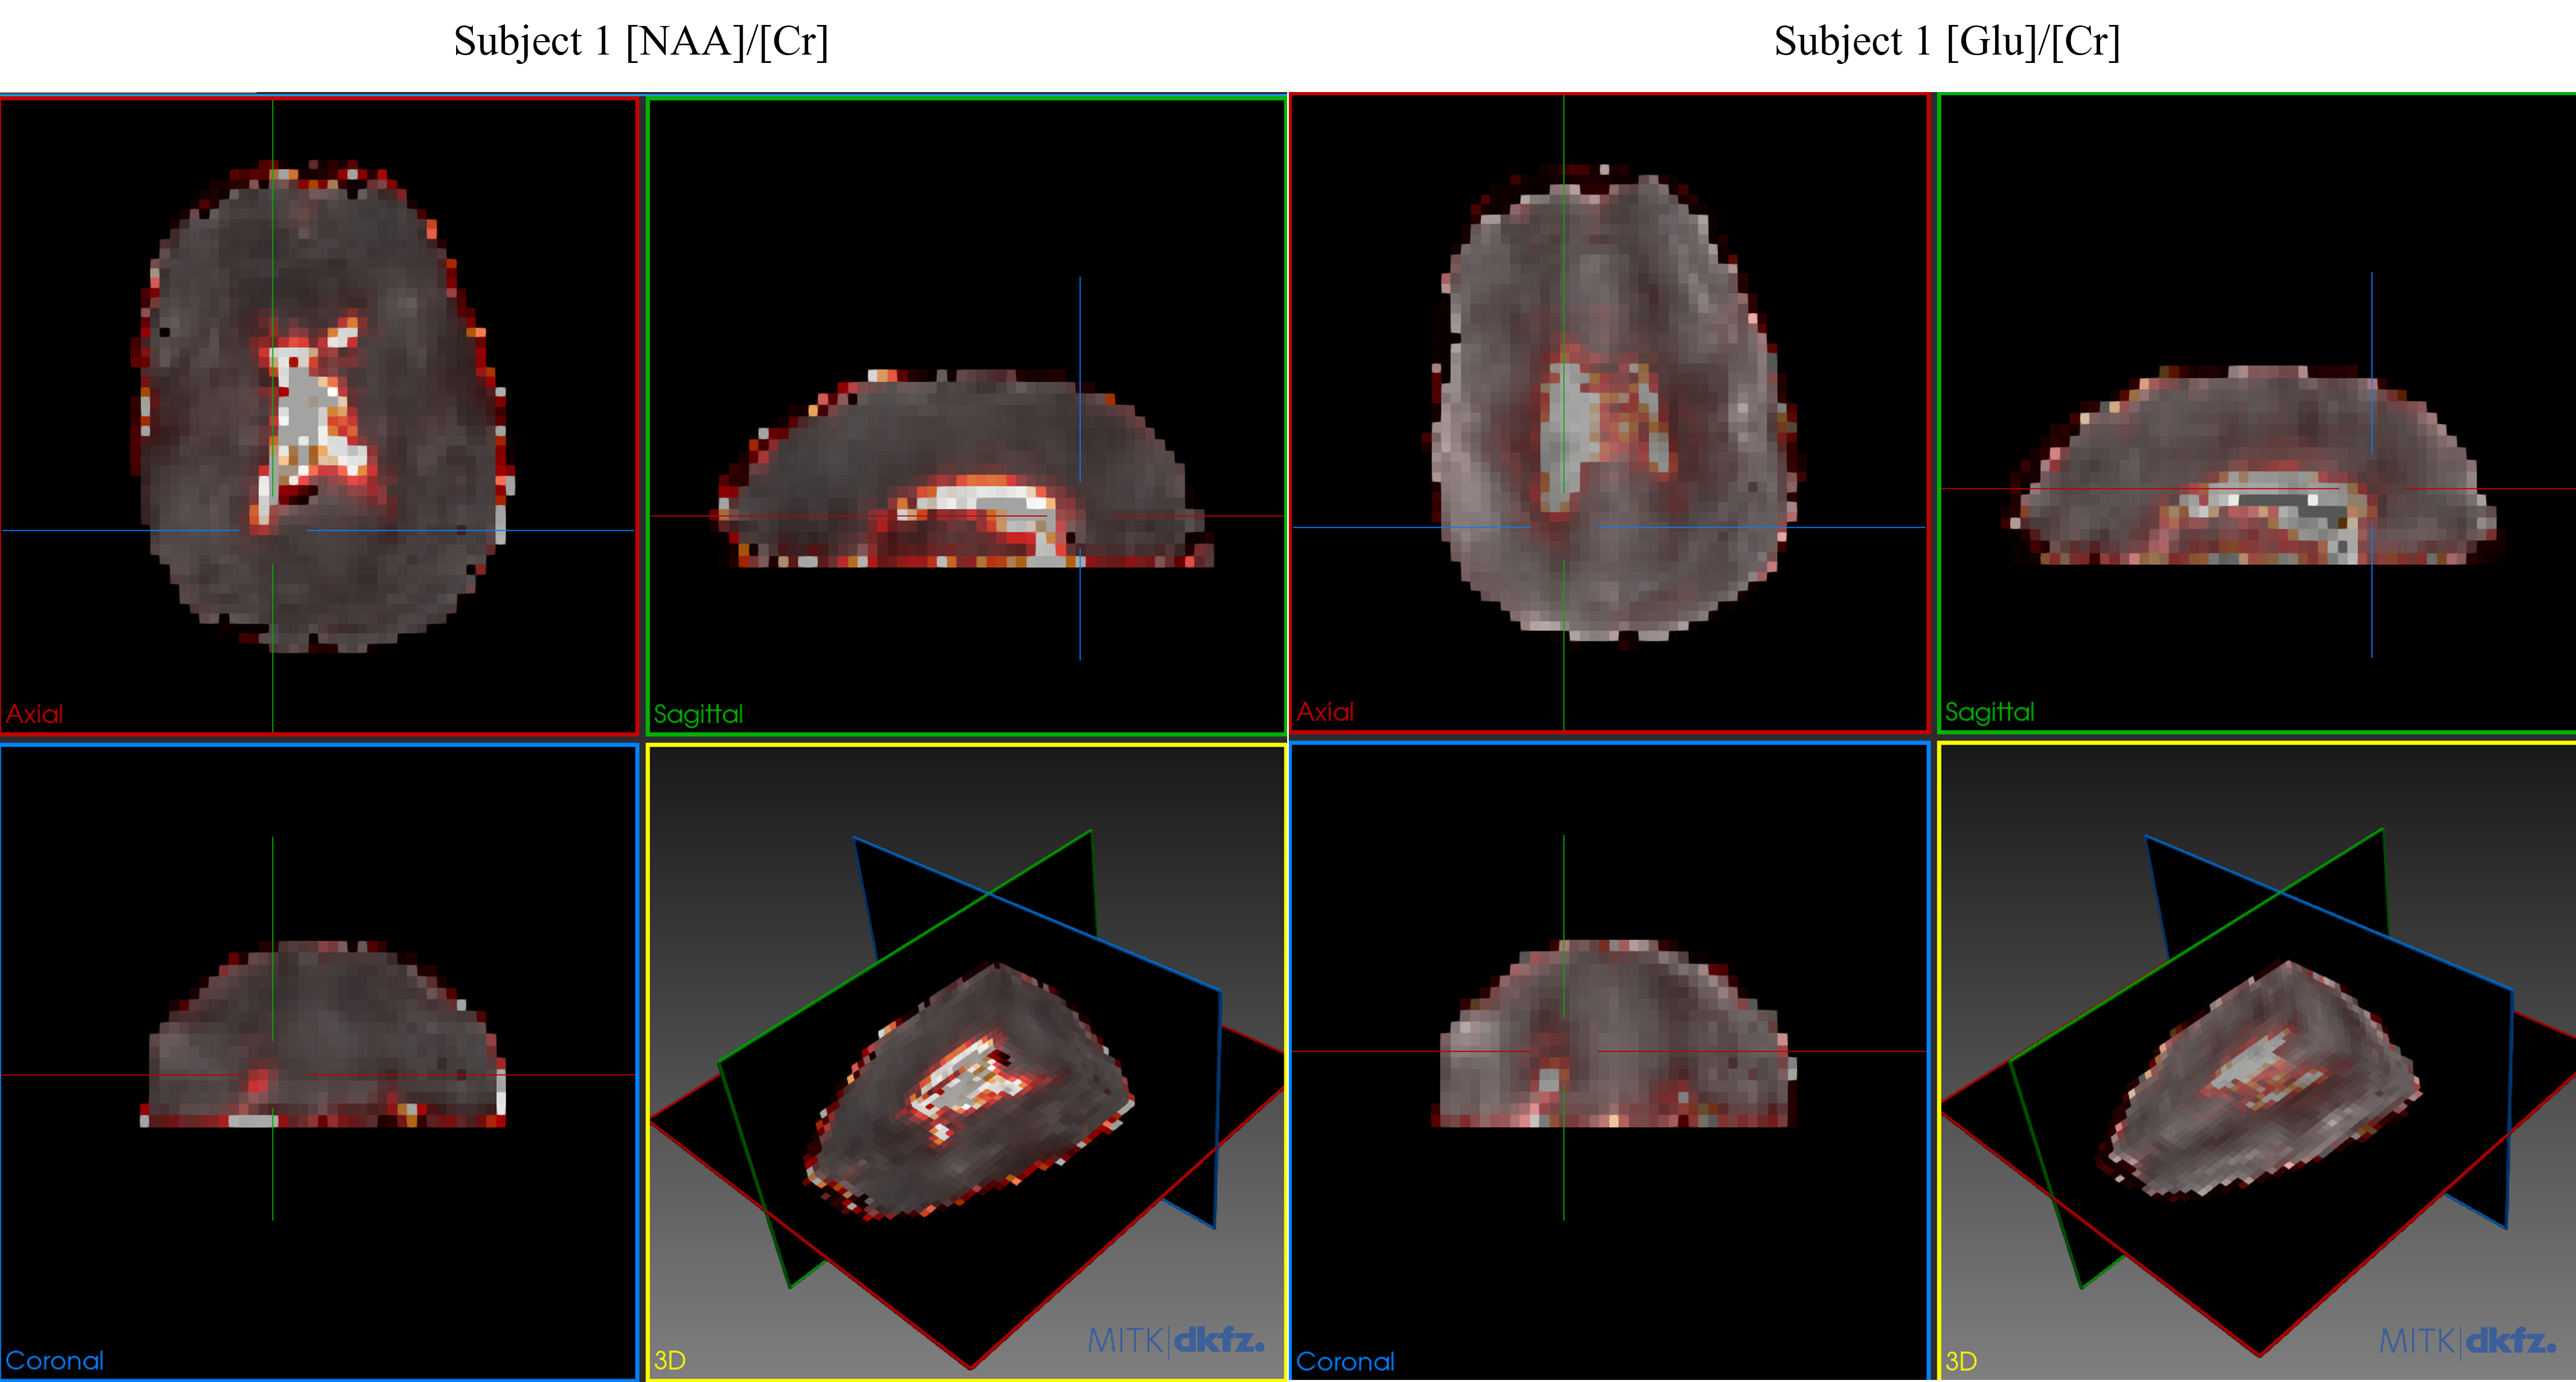
In the study's experimental setup, the inference phase took 6 milliseconds per subject (~ 19000 spectra) which represents a reduction by 6 orders of magnitude in computational time when compared to the conventional approach that typically takes 2 hours. Figure 2 offers a comparative analysis of metabolic mapping between the LCModel and the Deep Learning approach for metabolites NAA, Glu, Ins, and Gln. Figure 3 presents scatter plots comparing metabolite measurements utilizing DL and LCModel for NAA, Glu, Ins, and Gln. NAA demonstrates good consistency with R² values of 0.83 and 0.72. Glu has closely aligned R² values at 0.78 and 0.74. Ins plots show a moderate agreement with R² values of 0.76 and 0.70. However, Gln exhibits a notable discrepancy with R² values of 0.42 and 0.13, suggesting significant variations between the methods for this metabolite. As depicted in Figure 4, we present two representative spectra from our test subjects, demonstrating the efficacy of our spectral analysis model and the current limitations requiring further algorithmic enhancements. The presented Figure 5 offers a detailed view of the concentration ratio of NAA and Glu over Cr in two test subjects' brain scans. These scans are augmented with an overlay representing the estimated Cramér-Rao Lower Bounds (CRLBs), which serve as a measure for the lower bound of the variance of estimators.CONCLUSION
The VPIAE framework presents a much faster and more efficient solution in the quantification of in vivo whole-brain MRSI data. Moreover, the ability to estimate uncertainty in real-time enhances the reliability of the results, making it a promising tool for both research and clinical applications. The results highlight the potential of VPIAE to provide high-resolution metabolite quantification at a fraction of the computational cost traditionally associated with MRSI analysis. Notably, the model achieved significant reductions in computational time without the necessity of ground truth data for training, which is a substantial advancement over existing methods.Acknowledgements
This project has received funding from the European Union's Horizon 2020 research and innovation program under the Marie Skłodowska-Curie grant agreement No 813120, and Austrian Research Fund P 34198.References
[1] T. Rachman, Robin A. de Graaf - In Vivo NMR Spectroscopy Principles and Techniques (2018, Wiley). 2018.
[2] J. Near et al., “Preprocessing, analysis and quantification in single‐voxel magnetic resonance spectroscopy: experts’ consensus recommendations,” NMR Biomed., no. July 2019, pp. 1–23, 2020, doi: 10.1002/nbm.4257.
[3] J. Near et al., “Preprocessing, analysis and quantification in single-voxel magnetic resonance spectroscopy: experts’ consensus recommendations.,” NMR Biomed., no. July 2019, p. e4257, 2020, doi: 10.1002/nbm.4257.
[4] S. W. Provencher, “Estimation of metabolite concentrations from localized in vivo proton NMR spectra,” Magn. Reson. Med., vol. 30, no. 6, pp. 672–679, 1993, doi: 10.1002/mrm.1910300604.
[5] R. Kreis et al., Terminology and concepts for the characterization of in vivo MR spectroscopy methods and MR spectra: Background and experts’ consensus recommendations, no. September 2019. 2020. doi: 10.1002/nbm.4347.
[6] K. Landheer and C. Juchem, “Are Cramér-Rao lower bounds an accurate estimate for standard deviations in in vivo magnetic resonance spectroscopy?,” NMR Biomed., vol. 34, no. 7, 2021, doi: 10.1002/nbm.4521.
[7] A. Paszke et al., “PyTorch: An imperative style, high-performance deep learning library,” Adv. Neural Inf. Process. Syst., vol. 32, no. NeurIPS, 2019.
[8] L. Hingerl et al., “Clinical High-Resolution 3D-MR Spectroscopic Imaging of the Human Brain at 7 T,” Invest. Radiol., vol. 55, no. 4, pp. 239–248, Apr. 2020, doi: 10.1097/RLI.0000000000000626.
Figures