2988
Evaluation of retrospective frequency drift correction methods for single-voxel MR spectroscopy at 7T11Department of Radiology, The University of Iowa, Iowa City, IA, United States, 2GE Healthcare, Waukesha, WI, United States
Synopsis
Keywords: Data Processing, Spectroscopy
Motivation: Retrospective methods to correct frequency drifts has been evaluated at 3T systems but not at 7T systems, where the line-broadening effect may degrade the performance of the correction.
Goal(s): To evaluate retrospective frequency drift correction methods at 7T using simulations and human spectra.
Approach: The frequency correction methods were applied to the simulated spectra and human spectra at 7T to evaluate the accuracy of the frequency drift estimates and the spectral linewidth after the correction.
Results: Among these methods, the spectral registration method showed a more accurate estimate of the frequency drift and a larger improvement of spectral linewidth.
Impact: 7T offers a high sensitivity to detect weakly represented metabolites/neurotransmitters that are relevant to studying neurological and mental disorders. This study addresses frequency drift correction for accurate, consistent metabolite/neurotransmitter quantifications and may help expand the applications of MRS at 7T.
INTRODUCTION
Gradient heating or motion-induced frequency drifts during MR spectroscopy measurements result in broad spectral linewidth (LW) and decreased SNR. Thus, correcting frequency drift is necessary to improve spectral quality and ultimately achieve accurate metabolite quantification1. Retrospective frequency correction methods do not require the acquisition of a navigator echo and are generally applicable to the single-voxel spectroscopy (SVS) data. Earlier retrospective methods utilized the creatine2 or residual water signals3 of each FID to measure frequency drifts. A recent retrospective method, termed time-domain spectral registration method (SR)4, utilizes the registration of FIDs to measure frequency drifts. These methods have been evaluated on the SVS spectra at 3T systems4-7 but not at 7T systems. 7T systems offer a higher sensitivity to detect weakly represented metabolites8, but the broader LW at 7T9 may degrade the performance of the frequency correction. Therefore, it is important to determine the efficacy of these frequency correction methods at 7T systems. This study aims to evaluate the retrospective frequency correction methods at 7T through simulations and human spectra.METHODS
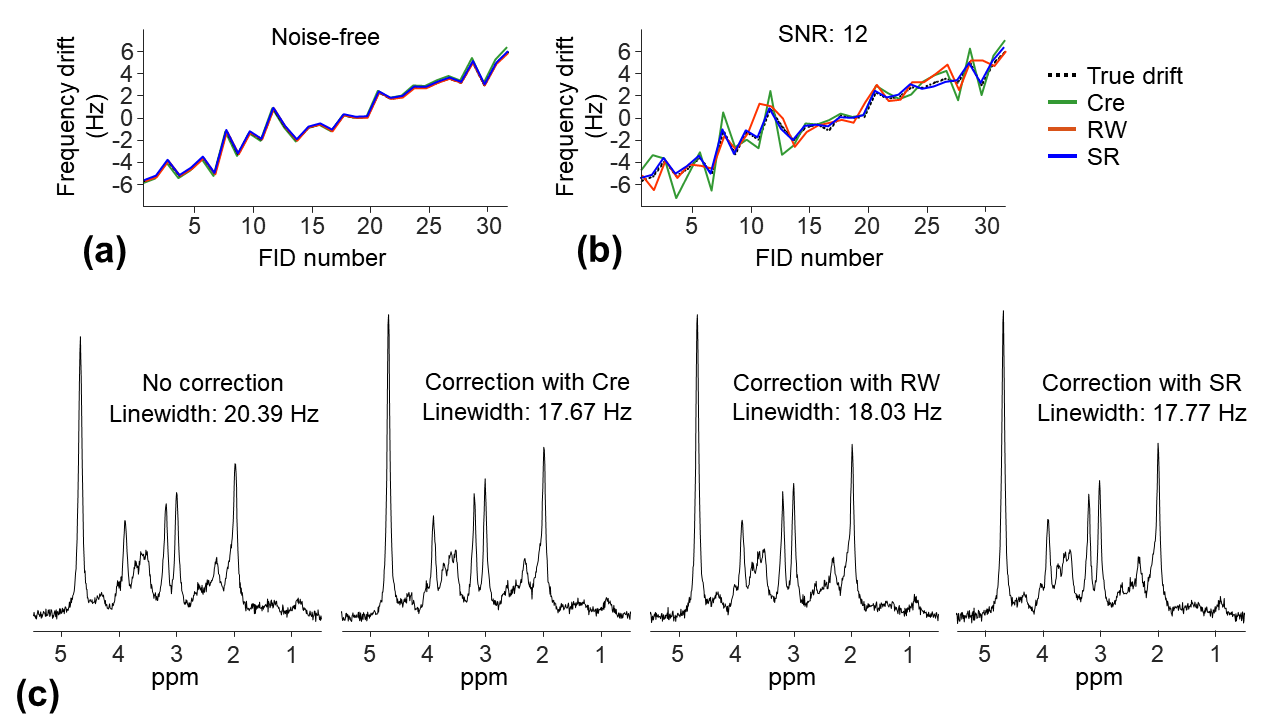
Simulation:Brain 1H semi-LASER SVS spectra were simulated using FID-A software10 with a frequency drift up to 10 Hz over 32 FIDs and phase shift up to ±2.5° (Fig. 1). A18 Hz line-broadening was applied to the simulated FIDs. Noise was added to each FID with a SNR:12. Other parameters of the simulation matched those of the human SVS scans as described in the following paragraph. The simulation was repeated 100 times with a randomly selected frequency/phase drifts over [0, 10] Hz and [-2.5, 2.5]°, respectively.
Human SVS:
The 40 subjects' SVS spectra were collected from a study of bipolar disorder (including control participants) on a GE SIGNA 7T system using a NOVA 2-channel transmit/32-channel receive coil. A 20x20x20 mm3 VOI was placed on the anterior cingulate cortex using semi-LASER localization. The acquisition parameters were TE/TR=30/4000 ms, spectral width=5000 Hz, 2048 data points, and 32 FIDs. Before the analysis, 11 subjects’ spectra were removed due to the broad water LW (>20 Hz)9, and the remaining 29 subjects’ spectra were included in the analysis.
Frequency correction:
Following the coil combination of the FIDs, three frequency correction methods were used:
1). Creatine fitting method2: a Lorentzian function was fitted to the creatine signal (2.72-3.12 ppm) to measure the frequency/phase drifts.
2). Residual water method3: the location of the water peak (4.4-5.0 ppm) determined the measured frequency drift. The phase of the first data point of the FID determined the phase shift.
3). SR method4: the data points of an FID that fell below a SNR of 5 were first removed from each FID. Each FID was then aligned to a reference FID, e.g., the median of the total FIDs, by adjusting the frequency and phase drifts using the nonlinear fitting in Matlab.
Analysis:
For the simulation with a known frequency drift, the accuracy of the measured frequency drift was quantified using the root-mean-square error (RMSE). The spectral quality with and without frequency correction was evaluated using the residual water LW10.
RESULTS
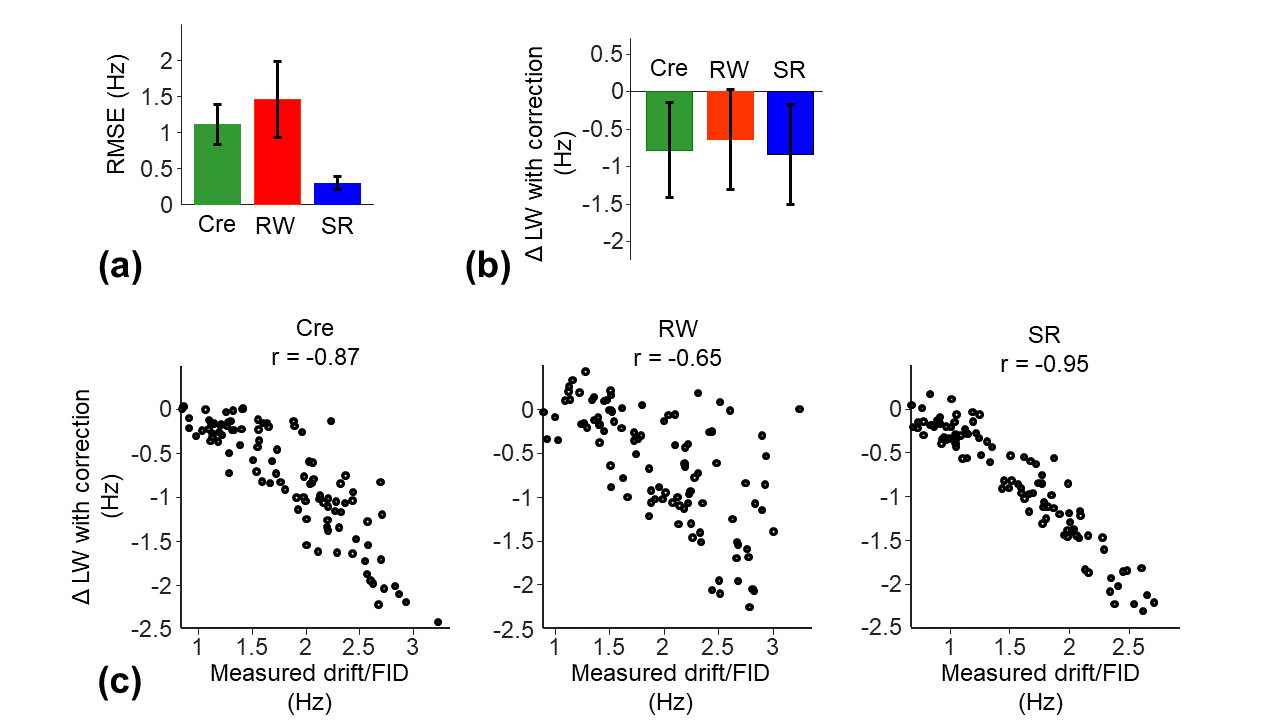
Simulation:The Cre, RW, and SR methods were validated using noise-free FIDs (RMSEs<0.2) (Fig.1a). For noisy FIDs, the measured frequency drifts using the SR method were more accurate than those using the Cre and RW methods (Figs.1b and 2a). The improvement in LW was larger using the SR method; Cohen’s d: 1.26 versus 1.23 (Cre) and 0.95 (RW) (Fig.2b). The measured frequency drifts using the SR methods showed the strongest correlation with the improvement in LW (Fig.2c).
Human SVS:
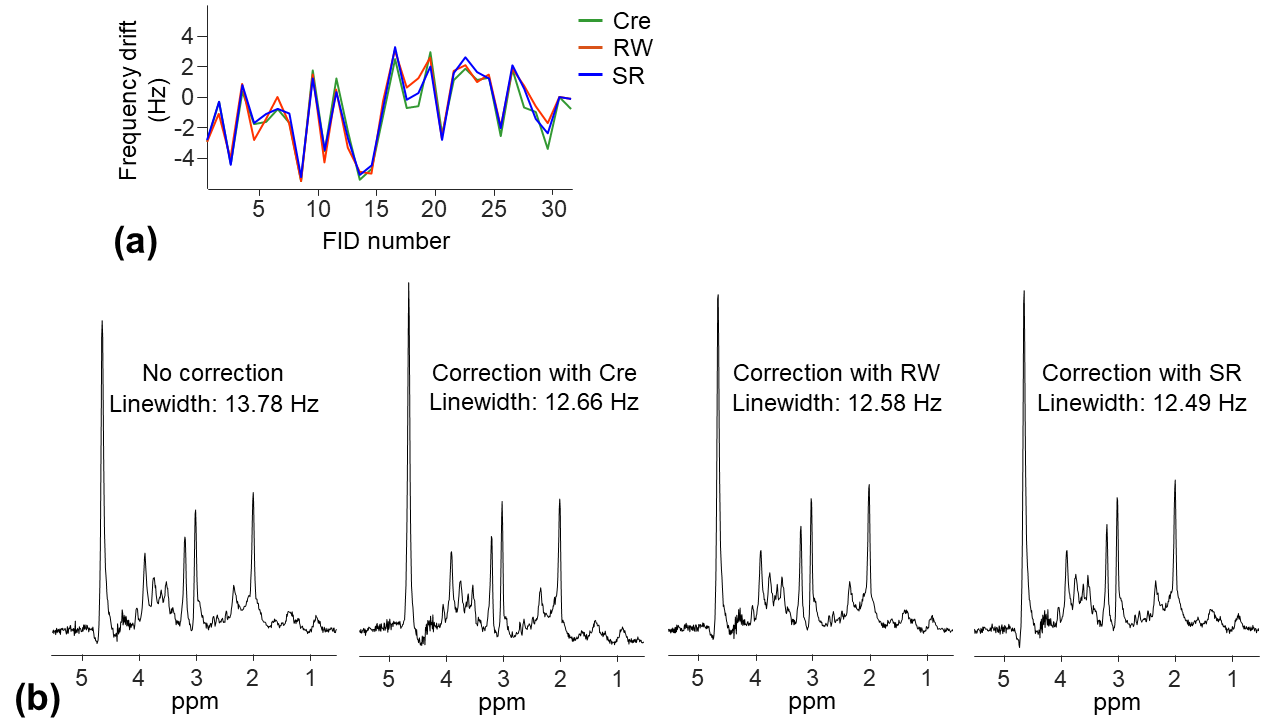
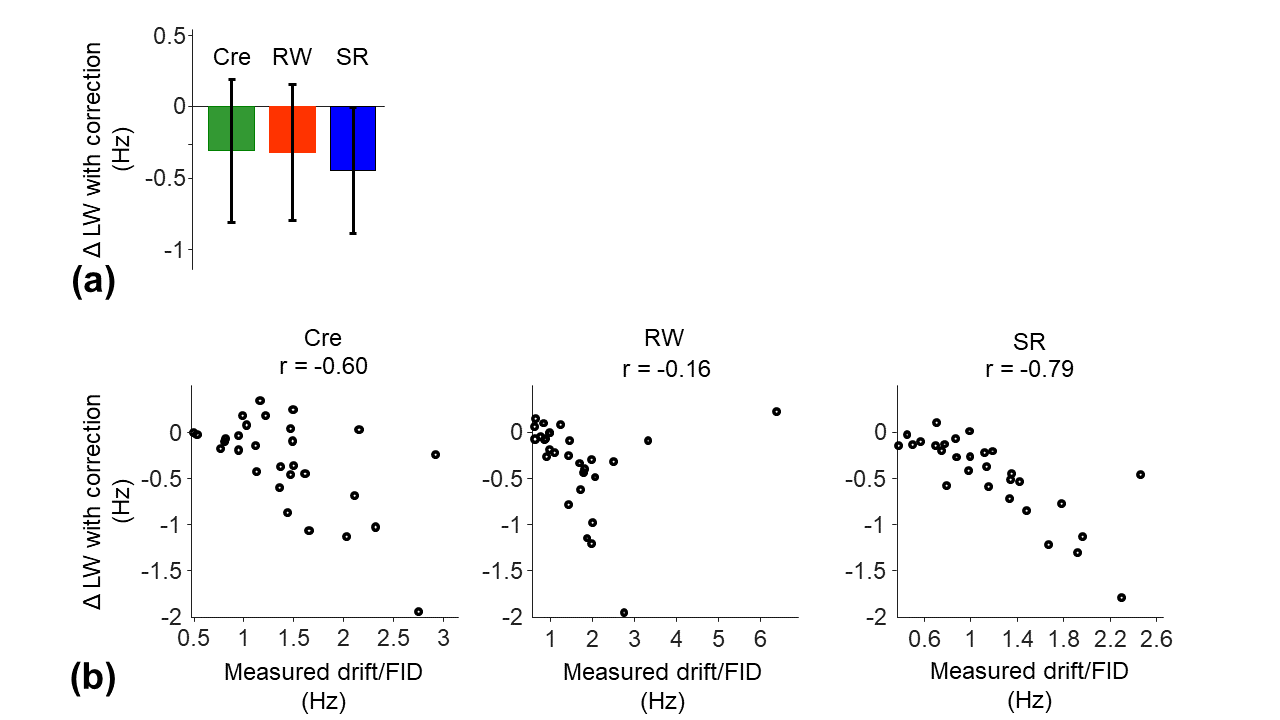
The mean water LW of 29 subjects’ spectra was 15.2 Hz (range:11.3-19.1 Hz). Consistent with the observations in simulations, the improvement in LW was larger using the SR method; Cohen’s d: 1 versus 0.61 (Cre) and 0.67 (RW) (Fig.4a). The measured frequency drifts using the SR methods showed the strongest correlation with the improvement in LW (Fig.4b).
DISCUSSION
The SR method had a more accurate measurement of frequency drifts than the Cre and RW methods, contributing to a larger improvement in LW and a strong correlation between the measured frequency drift and improvement in LW (r=-0.79 in human SVS measurements). These results support the use of the SR method to effectively correct frequency drifts at 7T in the presence of line-broadening effect, as well as the promise for improving spectral-editing efficiency at 7T11.CONCLUSION
We demonstrate the improved LW using the three frequency correction methods at 7T. Among them, the SR method provides a more accurate estimate of frequency drifts, allowing an effective correction and improved spectral quality for SVS at 7T.Acknowledgements
This work was supported by the National Institutes of Health R01MH111578. Core facilities were supported in part by the National Institutes of Health S10RR028821.References
[1]. Near J, Harris AD, Juchem C, Kreis R, Marjańska M, Öz G, Slotboom J, Wilson M, Gasparovic C. Preprocessing, analysis and quantification in single-voxel magnetic resonance spectroscopy: experts' consensus recommendations. NMR Biomed. 2021 May;34(5):e4257.
[2]. Waddell KW, Avison MJ, Joers JM, Gore JC. A practical guide to robust detection of GABA in human brain by J-difference spectroscopy at 3 T using a standard volume coil. Magn Reson Imaging 2007;25:1032–1038.
[3]. Helms G, Piringer A. Restoration of motion-related signal loss and line-shape deterioration of proton MR spectra using the residual water as intrinsic reference. Magn Reson Med 2001;46:395–400.
[4]. Near J, Edden R, Evans CJ, Paquin R, Harris A, Jezzard P. Frequency and phase drift correction of magnetic resonance spectroscopy data by spectral registration in the time domain. Magn Reson Med. 2015 Jan;73(1):44-50.
[5]. Mikkelsen M, Tapper S, Near J, Mostofsky SH, Puts NAJ, Edden RAE. Correcting frequency and phase offsets in MRS data using robust spectral registration. NMR Biomed. 2020 Oct;33(10):e4368.
[6]. Wilson M. Robust retrospective frequency and phase correction for single-voxel MR spectroscopy. Magn Reson Med. 2019 May;81(5):2878-2886. . Magn Reson Med. 2019; 81:2878–2886.
[7]. Rowland BC, Liao H, Adan F, Mariano L, Irvine J, Lin AP. Correcting for Frequency Drift in Clinical Brain MR Spectroscopy. J Neuroimaging. 2017 Jan;27(1):23-28.
[8]. Terpstra M, Cheong I, Lyu T, Deelchand DK, Emir UE, Bednařík P, Eberly LE, Öz G. Test-retest reproducibility of neurochemical profiles with short-echo, single-voxel MR spectroscopy at 3T and 7T. Magn Reson Med. 2016 Oct;76(4):1083-91.
[9]. Juchem C, Cudalbu C, de Graaf RA, Gruetter R, Henning A, Hetherington HP, Boer VO. B0 shimming for in vivo magnetic resonance spectroscopy: Experts' consensus recommendations. NMR Biomed. 2021 May;34(5):e4350.
[10]. Simpson R, Devenyi GA, Jezzard P, Hennessy TJ, Near J. Advanced processing and simulation of MRS data using the FID appliance (FID-A)-An open source, MATLAB-based toolkit. Magn Reson Med. 2017 Jan;77(1):23-33.
[11]. Choi IY, Andronesi OC, Barker P, Bogner W, Edden RAE, Kaiser LG, Lee P, Marjańska M, Terpstra M, de Graaf RA. Spectral editing in 1 H magnetic resonance spectroscopy: Experts' consensus recommendations. NMR Biomed. 2021 May;34(5):e4411.
Figures