2986
Automatic Identification of Potential Cellular MRS Metabolites1Radiology and Pathology, Massachusetts General Hospital, Harvard Medical School, Boston, MA, United States, 2Environmental Health, Harvard T.H. Chan School of Public Health, Boston, MA, United States
Synopsis
Keywords: Data Processing, Data Analysis, Metabolomics, metabolomic imaging, nuclear magnetic resonance, spectroscopy, biomarkers, data processing, metabolism, metabolites
Motivation: Manual identification of potential metabolites from untargeted MRS-based metabolomics studies is often tedious, labor-intensive, and prone to error.
Goal(s): To develop an automated and customizable program to systematically identify metabolites from spectral regions of interest (ROIs) based on databases, such as Human Metabolome Database (HMDB) for specific medical conditions.
Approach: We integrated experimental data — including ROIs, statistical significance, group trends/comparisons, and tissue- and disease-specific information — with automated HMDB searching, to output relevant and significant potential metabolites.
Results: Given spectral ROIs, and relevant significance and trend data, our program is capable of identifying possible disease- and tissue-specific metabolites.
Impact: Our program automates the manual database-searching process required for metabolite identification in MRS-based metabolomics research, enabling fast, robust, and reliable identification and categorization of metabolites based on user-customizable factors such as significance, trend, and tissue- and disease-specificity.
Introduction
Magnetic resonance spectroscopy (MRS) is one of the most effective techniques for identifying metabolites in untargeted metabolomics studies of biological samples, with potential for novel biomarker and target discovery. Identification and quantification of metabolites-of-interest from experimental MRS often requires researchers to manually reference online databases, such as the Human Metabolome Database (HMDB)1 and Biological Magnetic Resonance Band (BMRB).2 However, this process can be tedious, labor-intensive, and prone to error, particularly since increasingly large and complex datasets are generated in metabolomics studies and multiple metabolites can resonate in overlapping regions. To address this challenge, we developed a customizable Python program to systematically identify metabolites for different bio-specimen types from spectral regions of interest (ROIs), for specific medical conditions, using HMDB as a testing platform.Methods
Overview: Our program can automatically identify potential metabolites from a provided list of ROIs determined in experimental MRS. It requires the following inputs: 1) a table summarizing ROIs and statistical parameters (i.e. significance, group comparisons), and 2) an HMDB-derived dataset containing cellular metabolites from different biological samples and relevant MRS information. An overview of the program workflow is systematized in Figure 1.LC-AD application: We tested this program with a study investigating the metabolomic relationships between lung cancer (LC) and Alzheimer’s disease (AD) (Figure 2). Using high-resolution magic angle spinning (HRMAS) MRS, we measured serum from LC patients with (n=10) and without (n=10) AD, and their matched healthy controls (Ctrl-LC-AD, n=10; Ctrl-LC-nonAD, n=10). Ten microliter serum samples were analyzed on a Bruker 600MHz spectrometer at 4°C with a rotor-synchronized CPMG sequence and 5000Hz spinning rate. Spectra processing and curve-fitting were completed on Bruker Topspin 3.6.2, and 18 spectral regions of interest (ROIs) were identified. Univariate comparisons, hierarchical analysis, and unsupervised multivariate principal component analysis (PCA) were performed on JMP Pro (SAS).
Program functions: After analysis of ROIs, our program identified and categorized potential metabolites based on a provided summary table and cellular metabolites database (Figure 3A). First, we organized an appropriate metabolite database using chemical shift data from HMDB (ppm and ppm regions) and according to sample type (e.g. blood serum, in this case). Then, based on the ROIs presented by the study, we identified all metabolites with ppm values within the ROIs, and determined the number of significant (p<0.05) and False Discovery Rate (FDR) corrected regions for each metabolite. Next, we categorized the metabolites based on the following parameters: match ratio, significance ratio, and trend, which are further described in Figure 3B.
Finally, disease-specific metabolite lists related to lung cancer and Alzheimer's disease for this study were downloaded from HMDB or summarized by the users. The program presented a list of potential metabolites, “The Final Metabolites”, as the intersection of all datasets, illustrated in Figure 4. The final output, a table summarizing potential LC- and AD-related metabolites with their estimated significant levels, is shown in Figure 5.
Discussion & Conclusion
Our program can identify and categorize potential metabolites from spectral ROIs, based on their significance/trend information, and according to any available metabolomic databases for any bio-specimen types. The implementation of our program enhanced the efficiency and accuracy of metabolite identification in untargeted studies, which is traditionally tedious, laborious, and susceptible to errors.We are currently using our program to identify cellular metabolites from additional diseases, including cardiovascular, prostate cancer, and Alzheimer's disease unrelated to lung cancer. The generalizability of our program enables us to explore more disease-related metabolites and also potentially to expand our analyses from singular metabolites to include entire metabolic pathways. A key strength of our program is a high degree of flexibility, allowing researchers to customize and adjust filter parameters according to the specific needs of their studies. Moreover, programming work is underway to build a user-friendly graphic user interface (GUI) for its distribution and further applications in the research community. Our methodology is also generalizable to other imaging modalities, such as Raman spectroscopy or mass spectrometry.
Due to extensive references to external sources, primarily HMDB, it is crucial to ensure these databases are consistently updated. This necessitates regular checks and validation to confirm that our program is accessing the most up-to-date knowledge. It is beyond the scope of this study to update these databases, but future efforts should incorporate automatic synchronization to reduce manual input. In addition, AI tools (such as ChatGPT) is another possibility for metabolites identification. However, the reliability and reproducibility are questioned in our preliminary experiment with it.
Acknowledgements
NIH Grants: R01 AG070257 and R01 CA273010. MGH Martinos Center for Biomedical Imaging.References
- Wishart DS, Guo A, Oler E, et al. HMDB 5.0: the Human Metabolome Database for 2022. Nucleic Acids Res. 2022 Jan 7;50(D1):D622-D631. doi: 10.1093/nar/gkab1062.
- Zheng C, Zhang S, Ragg S, Raftery D, Vitek O. Identification and quantification of metabolites in 1H NMR spectra by Bayesian model selection. Bioinformatics. 2011;27(12):1637-1644. doi:10.1093/bioinformatics/btr118
Figures
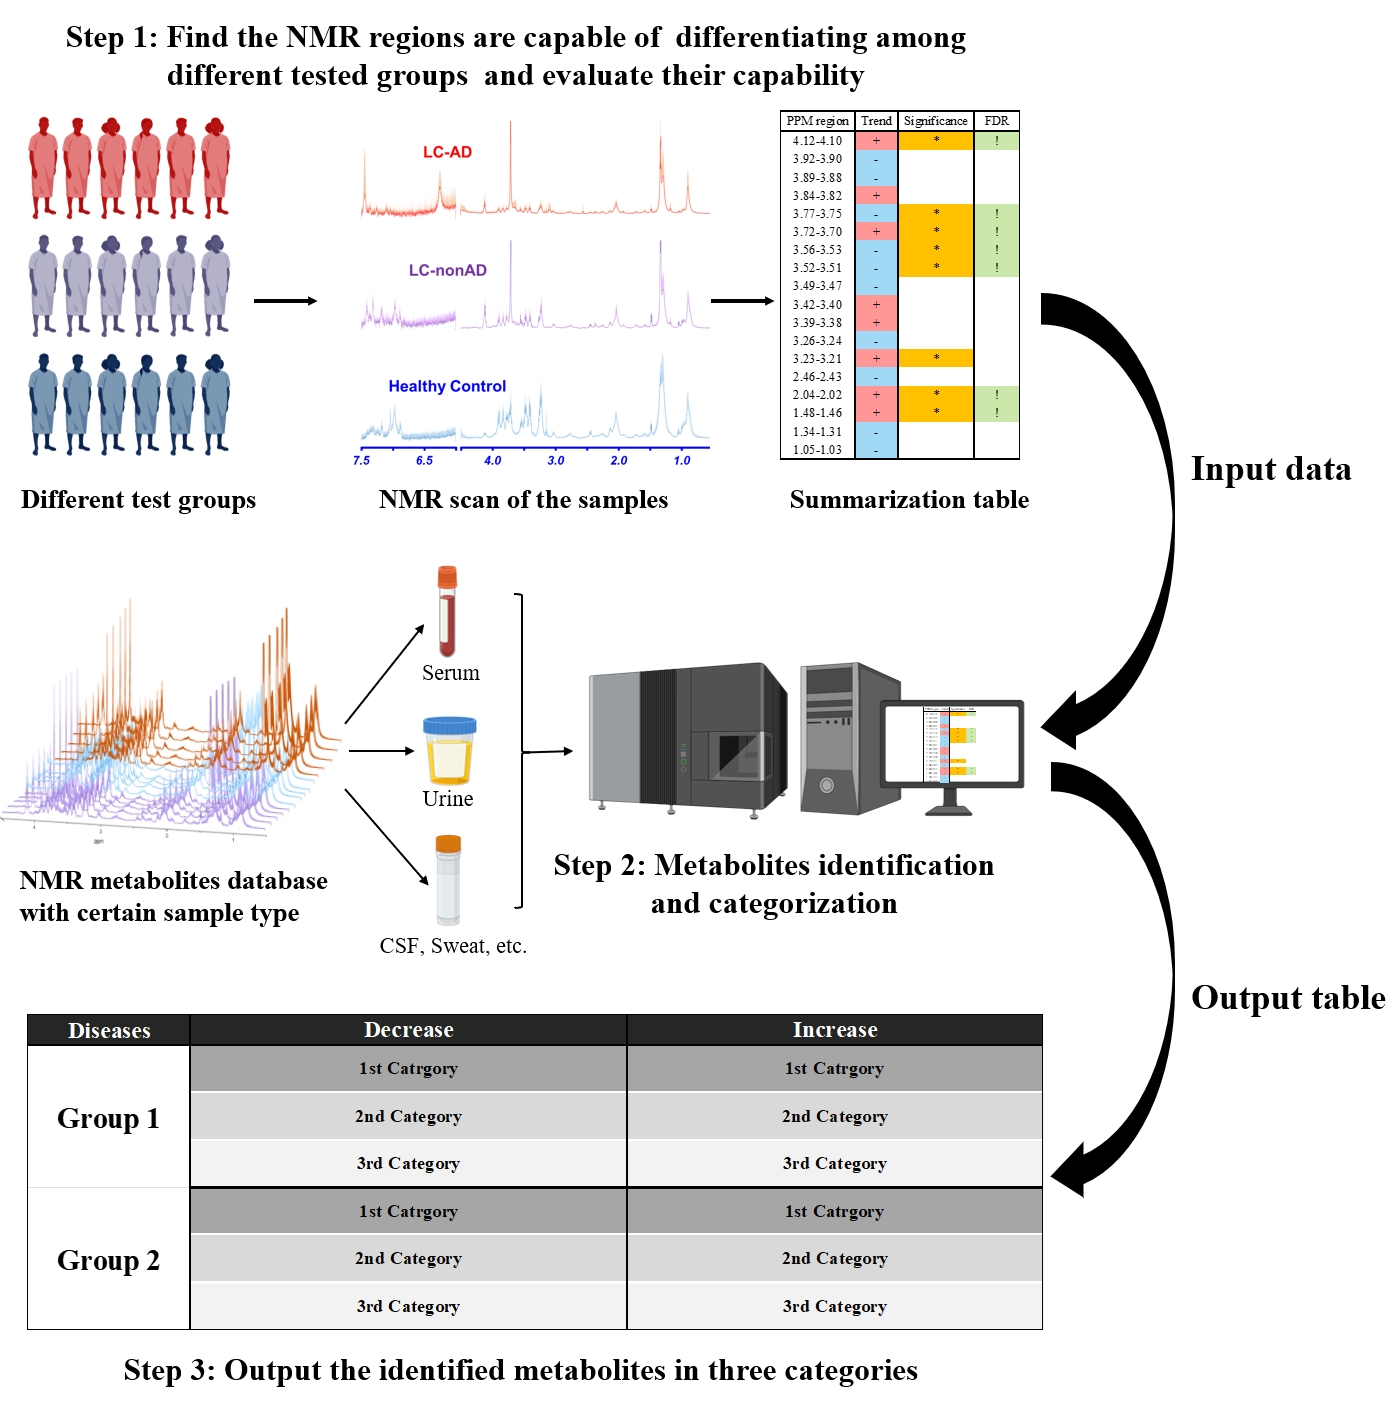
Figure 1. Program workflow. Comparison of MRS data from different testing groups generates a table summarizing ROIs and their capability to differentiate between experimental groups. With this input, our program identifies and categorizes metabolites based on HMDB chemical shift data, and outputs the final table of potential metabolites.
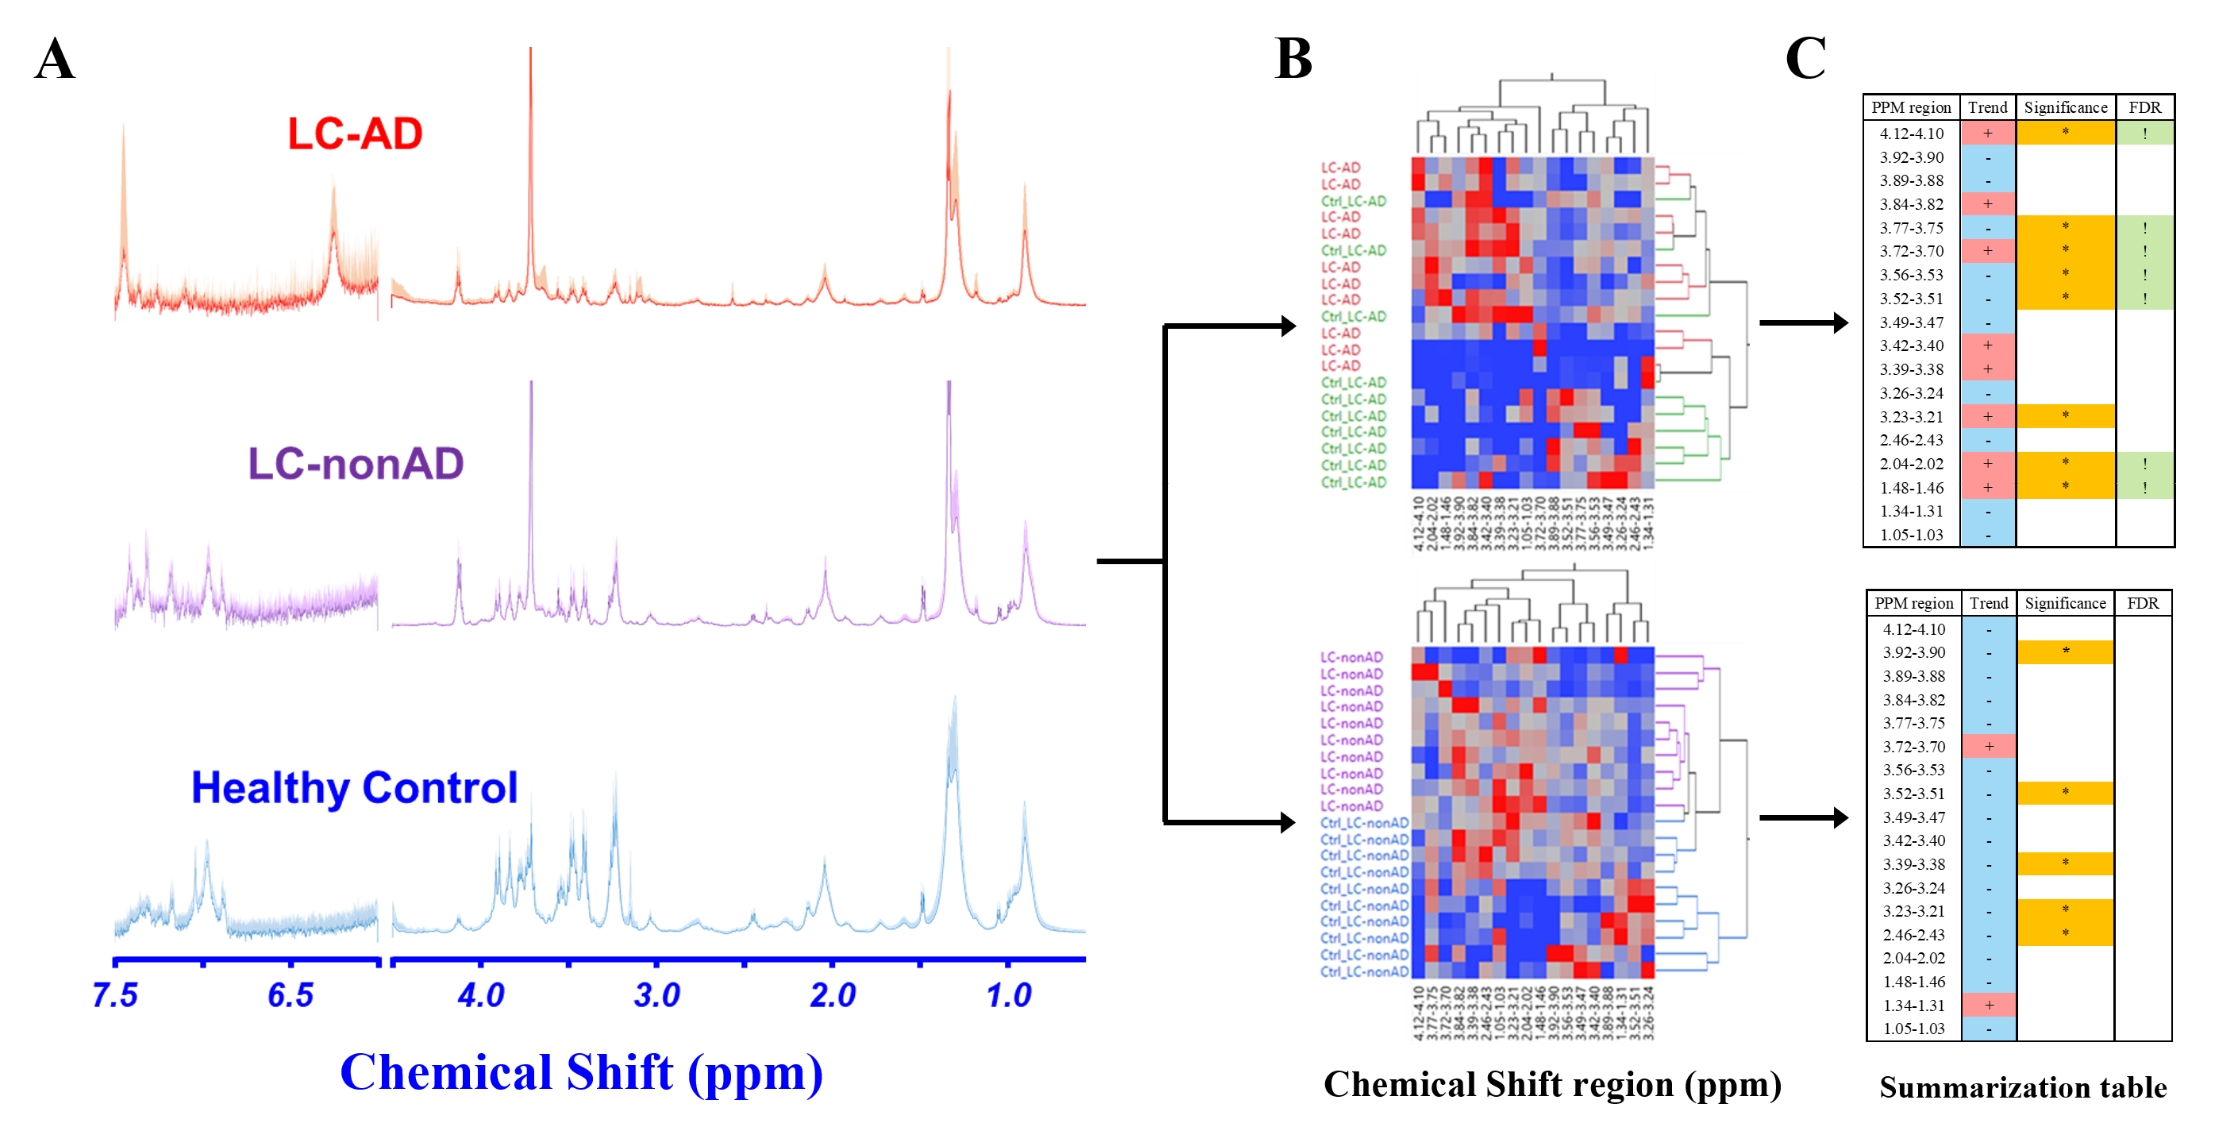
Figure 2. ROI identification in LC-AD study. (A) MR spectra of serum samples from different testing groups. (B) Hierarchical clustering heat map generated from all 40 samples with 18 identified ROIs. (C) The table summarizes the ROIs and uses Wilcoxon-Kruskal-Wallis tests (p-value < 0.05 represents significance) and false discovery rate (FDR) to evaluate their capability of differentiating test groups.
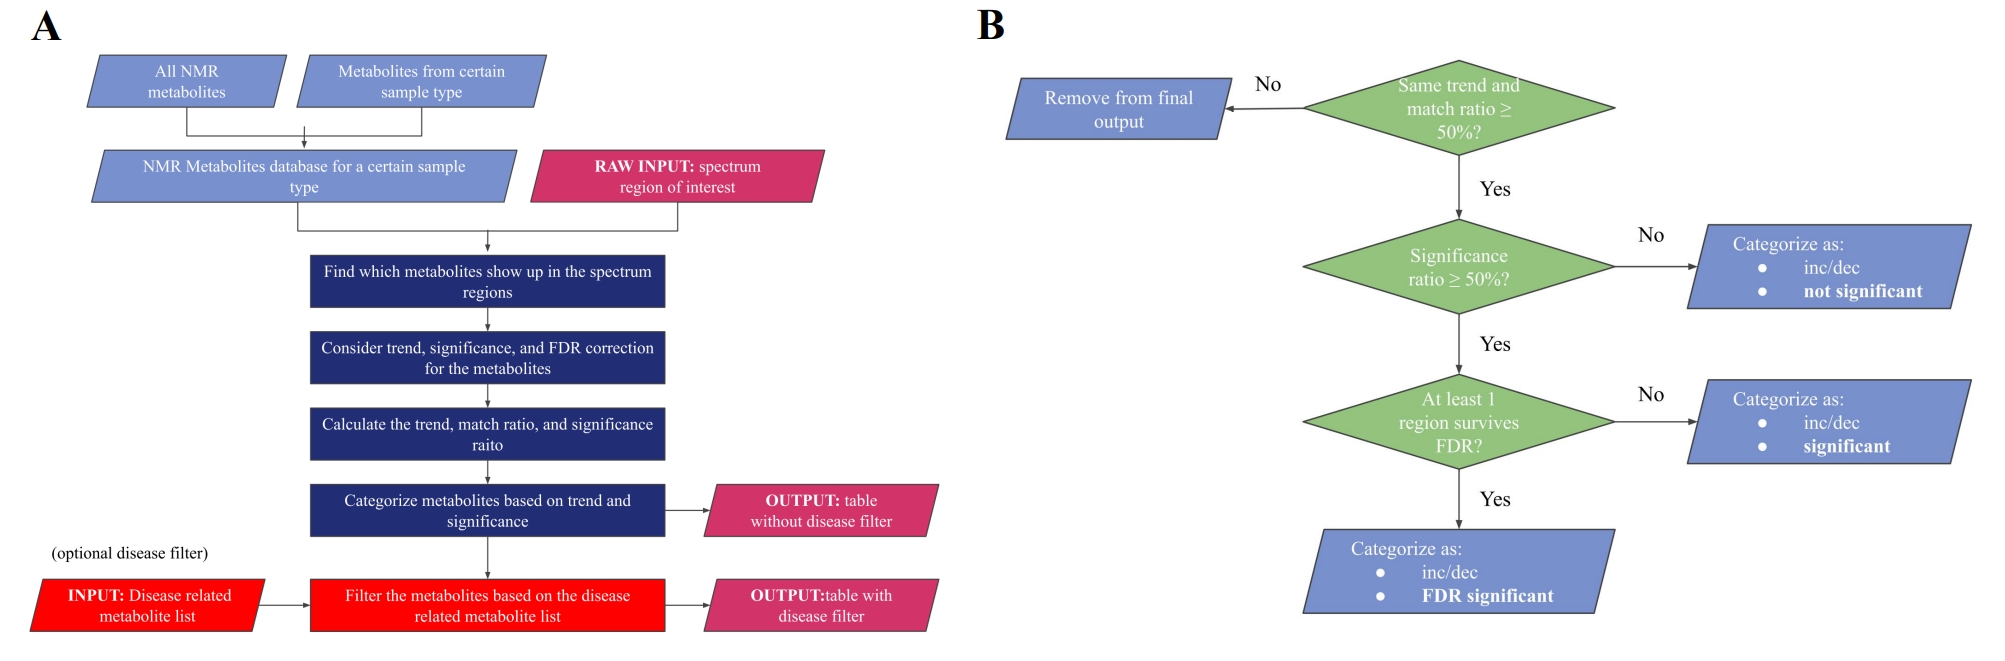
Figure 3. (A) Program flowchart. Overview of the program, from top to bottom: import of datasets, followed by calculation of parameters, and concluded by the output of the list. “Match ratio” (all spectral regions ÷ total spectral regions of metabolite), “significance ratio” (significant spectral regions ÷ total spectral regions of metabolite), and “trend”, (spectral intensities of the tested condition (LC) increases or decreases relative to the control group). (B) Categorization procedure. The flowchart illustrates the specific criteria of the categorization step in (A).
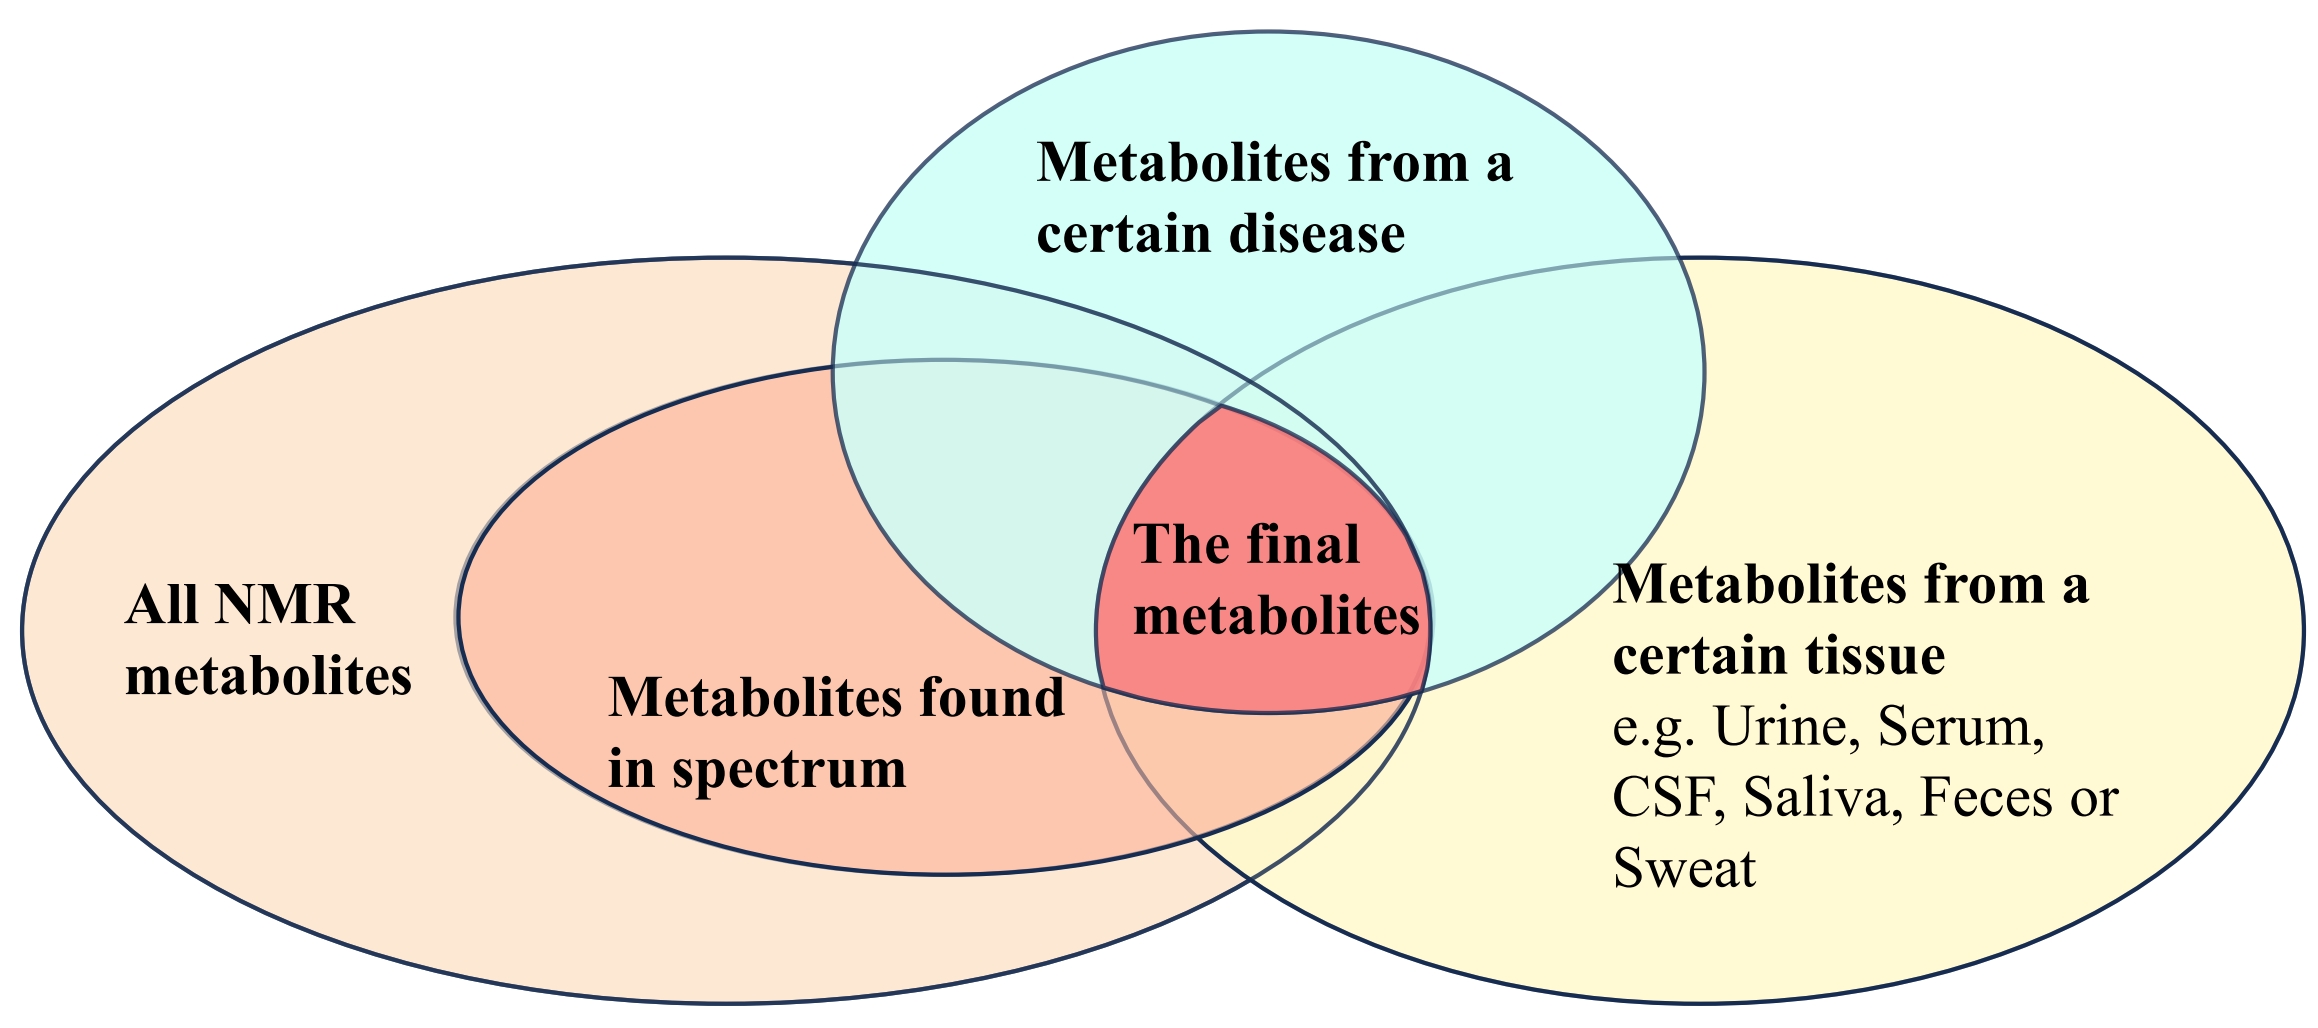
Figure 4. Database Structure. Venn diagram illustrating the intersection of metabolites found in the MRS spectrum from the study (the only needed inputs in the program), metabolites associated with a specific disease, and metabolites derived from a certain tissue type such as urine, serum, cerebrospinal fluid (CSF), saliva, feces, or sweat (all found in HMDB, or in user established databases). The central area labeled "The final metabolites" represents metabolites identified by the program.
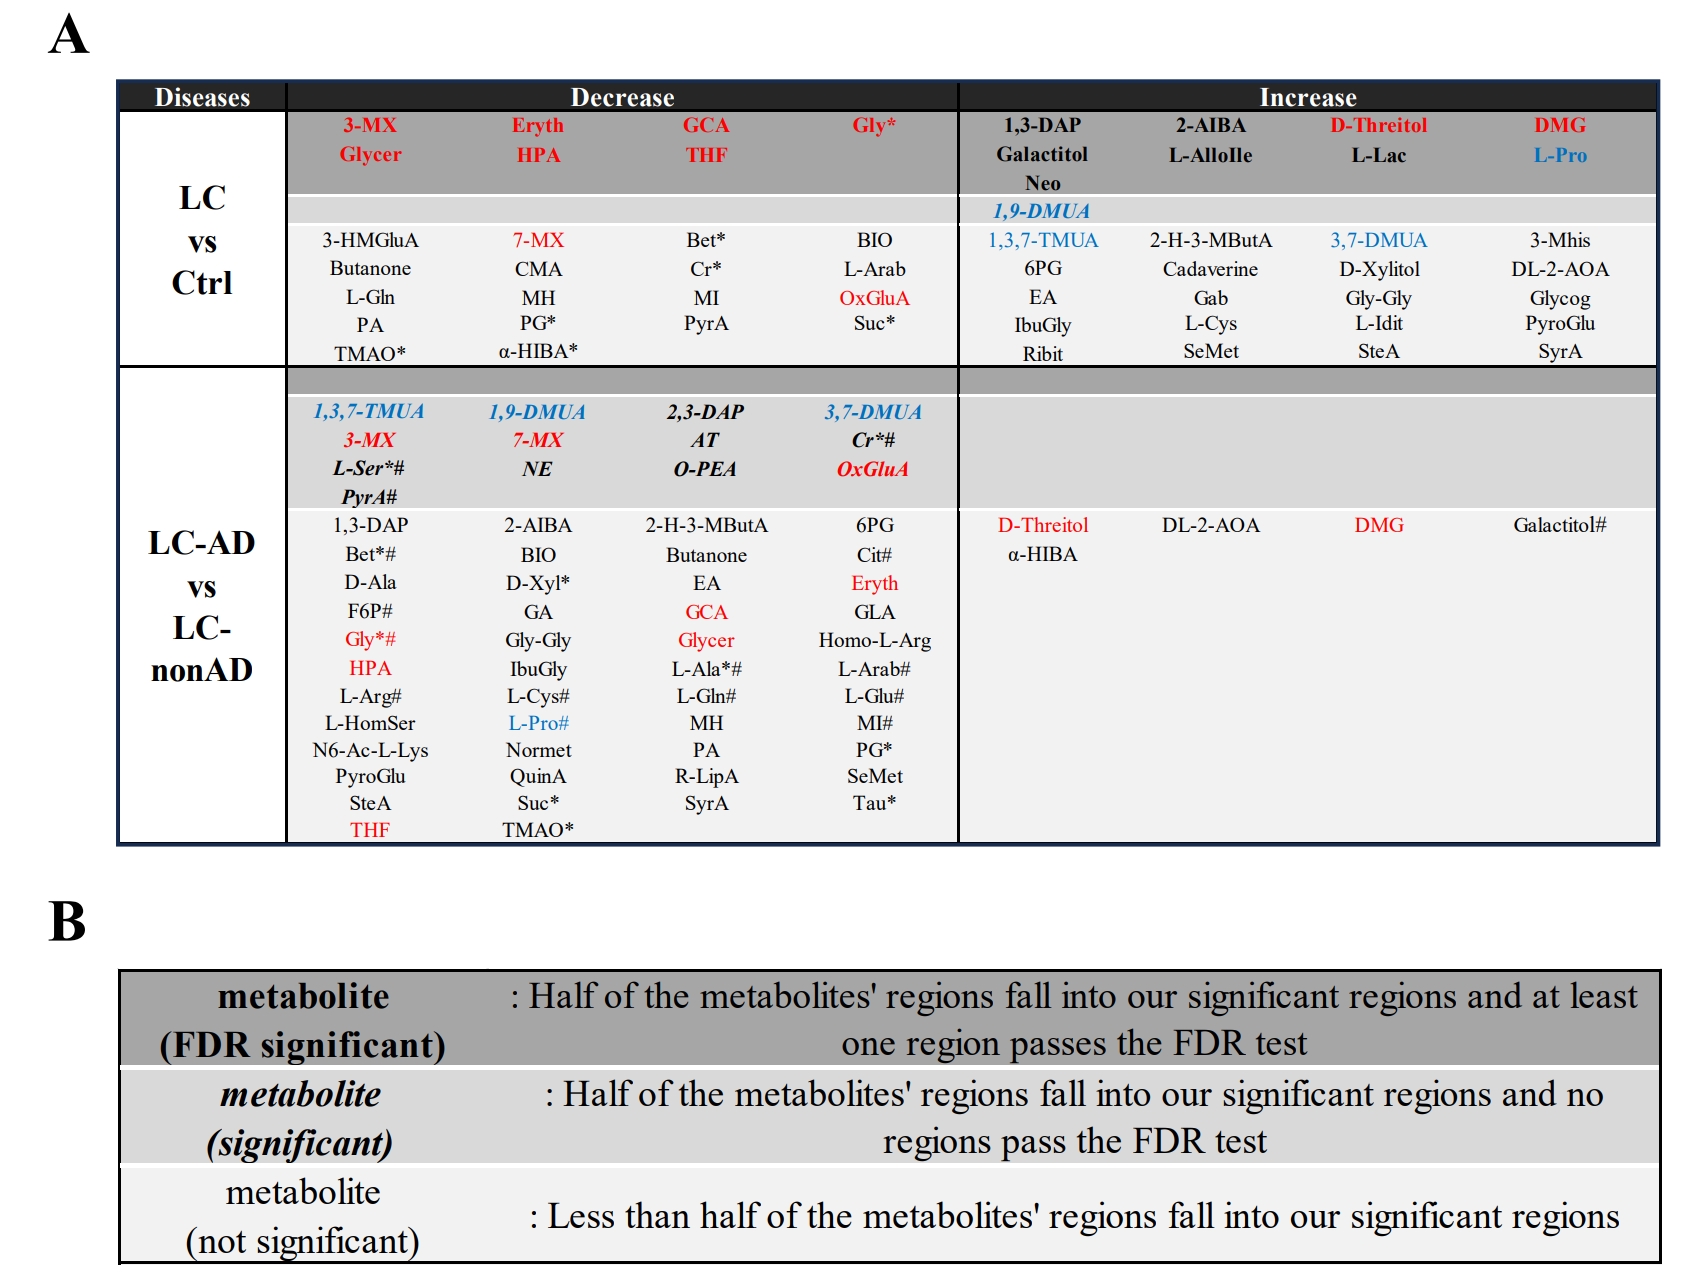
Figure 5. (A) Potential metabolites associated with diseases. Red metabolites present the same trends in both LC vs. Ctrl, and LC-AD vs. LC-nonAD comparisons, and at least one comparison shows it is FDR significant or significant, while Blue metabolites presented opposite trends in different comparison groups. *: metabolites found in the LC disease list; #: metabolites in the AD list. (B) Legend for metabolite categorization.