2983
An Accessible Toolbox for MR Spectroscopy Data Extraction and Analysis with Optimization for Diabetes Patients1Biomedical Engineering, National Taiwan University, Taipei, Taiwan, 2Department of Medical Imaging and Radiology, Medical College and Hospital, National Taiwan University, Taipei, Taiwan
Synopsis
Keywords: Software Tools, Software Tools, Spectroscopy
Motivation: Offline MR spectroscopy (MRS) analyses are limited by proprietary software on the console.
Goal(s): This study proposes a novel MATLAB-based toolbox to process the scanner-derived MRS raw data offline.
Approach: Functions in the proposed toolbox were programmed to efficiently perform MRS data extraction, peak detection in the spectral data, and Lorentzian curve fitting to provide a noiseless spectrum.
Results: With the toolbox, raw MRS data can be utilized offline; clinically relevant metabolites whose peaks were originally obscured in console-derived spectra can now be clearly resolved.
Impact: The development of a MATLAB toolbox for MRS data processing streamlines access to valuable MRS information and enhances peak detection, thus potentially increasing the utility and accessibility of MRS clinically and providing medical practitioners with more diagnostic information.
Introduction
Magnetic Resonance Spectroscopy (MRS) stands as a non-invasive imaging modality that facilitates the in vivo detection and quantification of metabolic information. For example, diabetes is associated with metabolic syndrome and abnormal lipid metabolism; in vivo MRS can assist in tracking different lipid profiles in muscle, the liver, and other organs relevant to this patient population. In lieu of biopsy and pathological analysis to determine metabolite composition, target metabolites can now be detected and quantified by this non-invasive technology. However, due to the closed-source nature of the MR scanner and its associated proprietary software, the ability to access MRS information and establish relationships between different metabolites and diseases has been limited.In this work, we proposed a user-friendly MRS data analysis toolbox, allowing users to directly extract numerical data from MR scanner-generated files; three functions were included:
- Data extraction: raw files acquired from the Siemens MR machine were analyzed; spectral data could be generated through the integration of LCModel functions. [1]
- Peak detection: peaks were determined by finding the local maximum within a set range.
- Curve fitting: Lorentzian curve-fitting on the detected peaks could afford users an interpretable representation of MRS data.
Theory and Methods
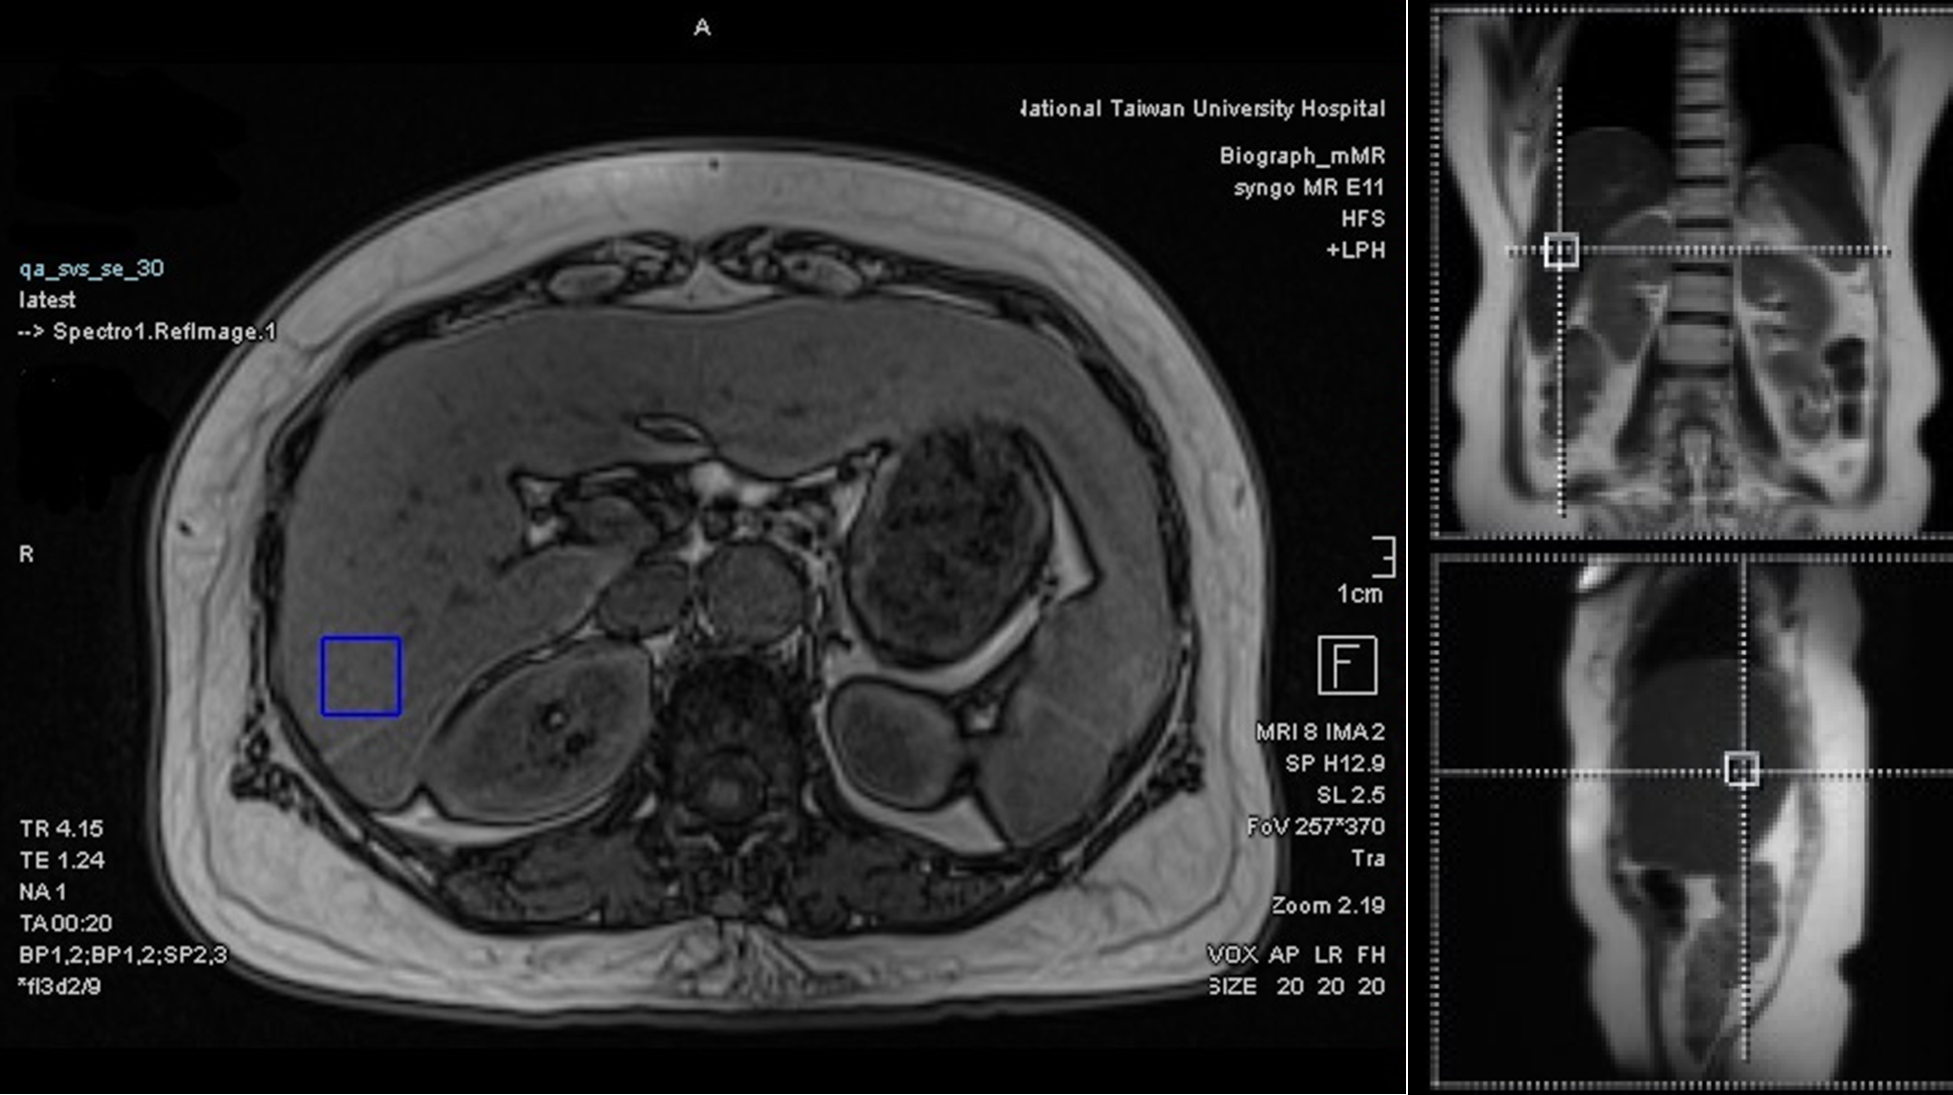
In Vivo MRS AcquisitionThe single-voxel [1H]-MRS scans were performed on 12 diabetes patients. Data acquisition was approved by our institutional review board. All measurements were conducted on the Siemens 3T Biograph mMR scanner. During acquisition, the subjects remained head first supine, with their abdomen positioned at the isocenter. Before performing [1H]-MRS, multi-slice MR images in three orthogonal planes of the abdomen were acquired using a standard fast spin-echo pulse sequence for positioning of the volume of interest. Volumes of interest (20 × 20 × 20 mm3) centered within the periphery of the right lobe of liver, avoiding large vessels and bile ducts (Figure 1). For volume selection, single voxel PRESS (Point Resolved Spectroscopy) with water suppression was applied (TR=2000 ms, TE=30 ms, NA=64). Chemical shifts were reported using water as the internal standard at 4.7 ppm. The MATLAB version 2023a was used in building the toolbox.
Toolbox functionalities
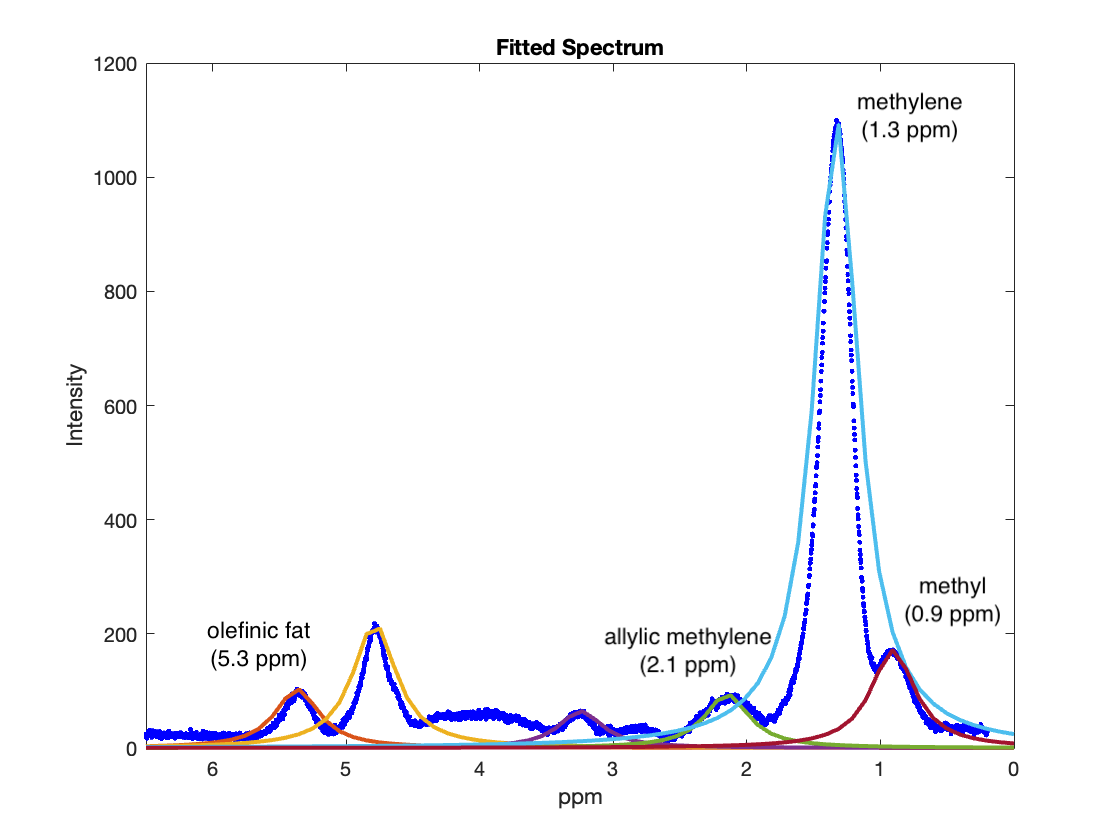
The toolbox begins by taking the time-domain raw MRS data (.rda) files from the Siemens MRI scanner as input, which was then Fourier transformed to output the spectral data as text files [2]. Next, peaks of interest were selected by comparing the intensities of the spectral data within local neighborhoods. Within the identified peaks, those relevant to diabetes, such as the methyl (CH3) peak (0.9 ppm), methylene (CH2) peak (1.3 ppm), allylic methylene (-CH2-CH=CH-) peak (2.1 ppm), and olefinic fat (-CH=CH-) peak (5.3 ppm), could be selected for further analyses [3, 4].
To obtain a numerical fit of spectral data based on identified peaks, the Lorentzian curve function with two parameters was used:
$$$f(x)={\frac{k\times \mathit{I}}{\left ( x-\mathit{C} \right )^{2}+k}}$$$
where I stands for intensity, C stands for chemical shift, and k (0.04 for our diabetes dataset) stands for a constant that can be modified with respect to the dataset. The intensity and chemical shift were then utilized to construct a fitted graph, providing a noiseless spectrum with clinically relevant peaks. The chemical shift (ppm) value, the metabolite name, and the area under the peak curve could be displayed for the user/medical professional.
Results & Discussion
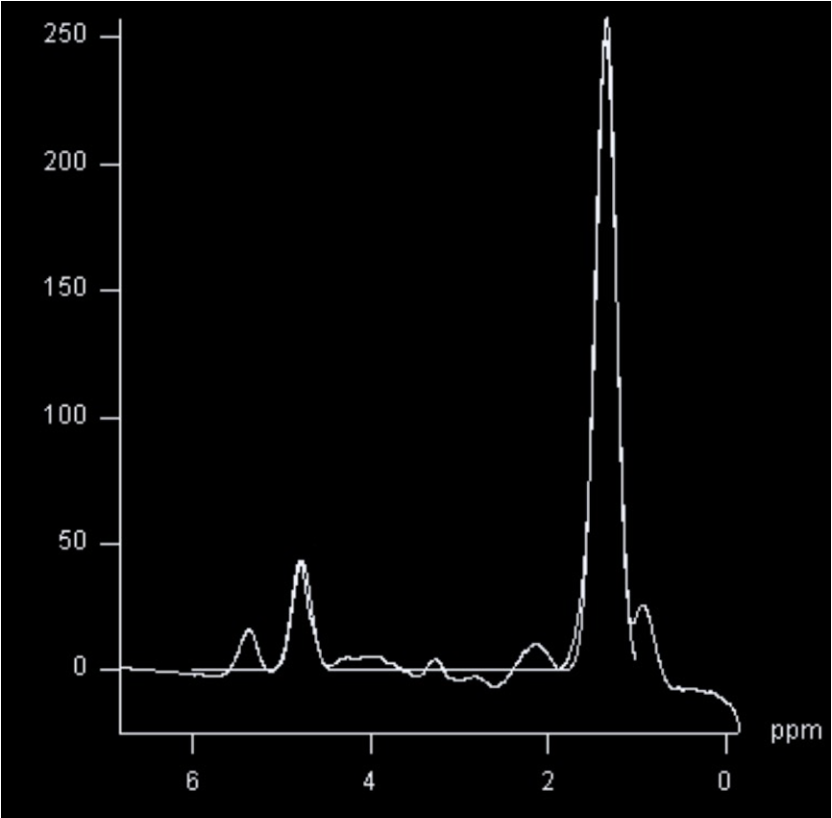
Previously, limited spectral data information could only be accessed from the console; now with the implementation of the toolbox, raw data could be processed and viewed offline, significantly increasing the accessibility of MRS data to medical professionals. The output, as expected, provided users with the raw spectral data along with a list of enhanced peaks and metabolite analyses. By redesigning the curve-fitting and peak-locating algorithm with Lorentzian curve-fitting methods, a denoised spectrum could be presented to users alongside quantified data.Upon further observation, small peaks originally obscured in the console-provided spectrum (Figure 2) could now be clearly resolved. Metabolites such as methyl (CH3), methylene (CH2, allylic methylene (-CH2-CH=CH-), and olefinic fat (-CH=CH-) can be more easily identified on the spectrum (Figure 3), as expected in this patient population. The information could be used to inform diagnoses, or compared with those derived from previous scans on the same patient for longitudinal follow-ups.
Conclusions
This work proposes to implement and integrate the file pre-processing, peak detection, and curve fitting functions into a software toolbox. With this accessible tool, the profuse information inside MRS data can be better leveraged, potentially allowing for easy utilization and integration of MRS analyses into clinical workflows.Acknowledgements
This work is supported by the Yushan Fellow Program, Ministry of Education, R.O.C. Taiwan (NTU-112V1015-3), Sprout Higher Education Project, Ministry of Education, R.O.C. Taiwan (NTU-112L900703) National Science and Technology Council, R.O.C. Taiwan (110-2222-E-002-015-MY3, 112-2813-C-002-086-E), and National Health Research Institutes, R.O.C. Taiwan (NHRI-EX112-11205EC).References
- Provencher, S.W., Estimation of metabolite concentrations from localized in vivo proton NMR spectra. Magn Reson Med, 1993. 30(6): p. 672-9
- Hnilicová, P., et al., Spatial variability and reproducibility of GABA-edited MEGA-LASER 3D-MRSI in the brain at 3 T. NMR in Biomedicine, 2016. 29(11): p. 1656-1665.
- Boesch, C., et al., In vivo determination of intra-myocellular lipids in human muscle by means of localized 1H-MR-spectroscopy. Magn Reson Med, 1997. 37(4): p. 484-93.
- Boesch, C., et al., Role of proton MR for the study of muscle lipid metabolism. NMR Biomed, 2006. 19(7): p. 968-88.
Figures