2982
Linear Regression Modeling of BOLD Response to task activation reflects neurovascular uncoupling in MS1Imaging Institute, Cleveland Clinic, Cleveland, OH, United States, 2Epilepsy Center, Cleveland Clinic, Cleveland, OH, United States
Synopsis
Keywords: Multiple Sclerosis, Multiple Sclerosis
Motivation: To understand the different BOLD activation pattern in multiple sclerosis patients
Goal(s): To Investigate the neuro-vascular uncoupling of MS patients to be compared with healthy controls
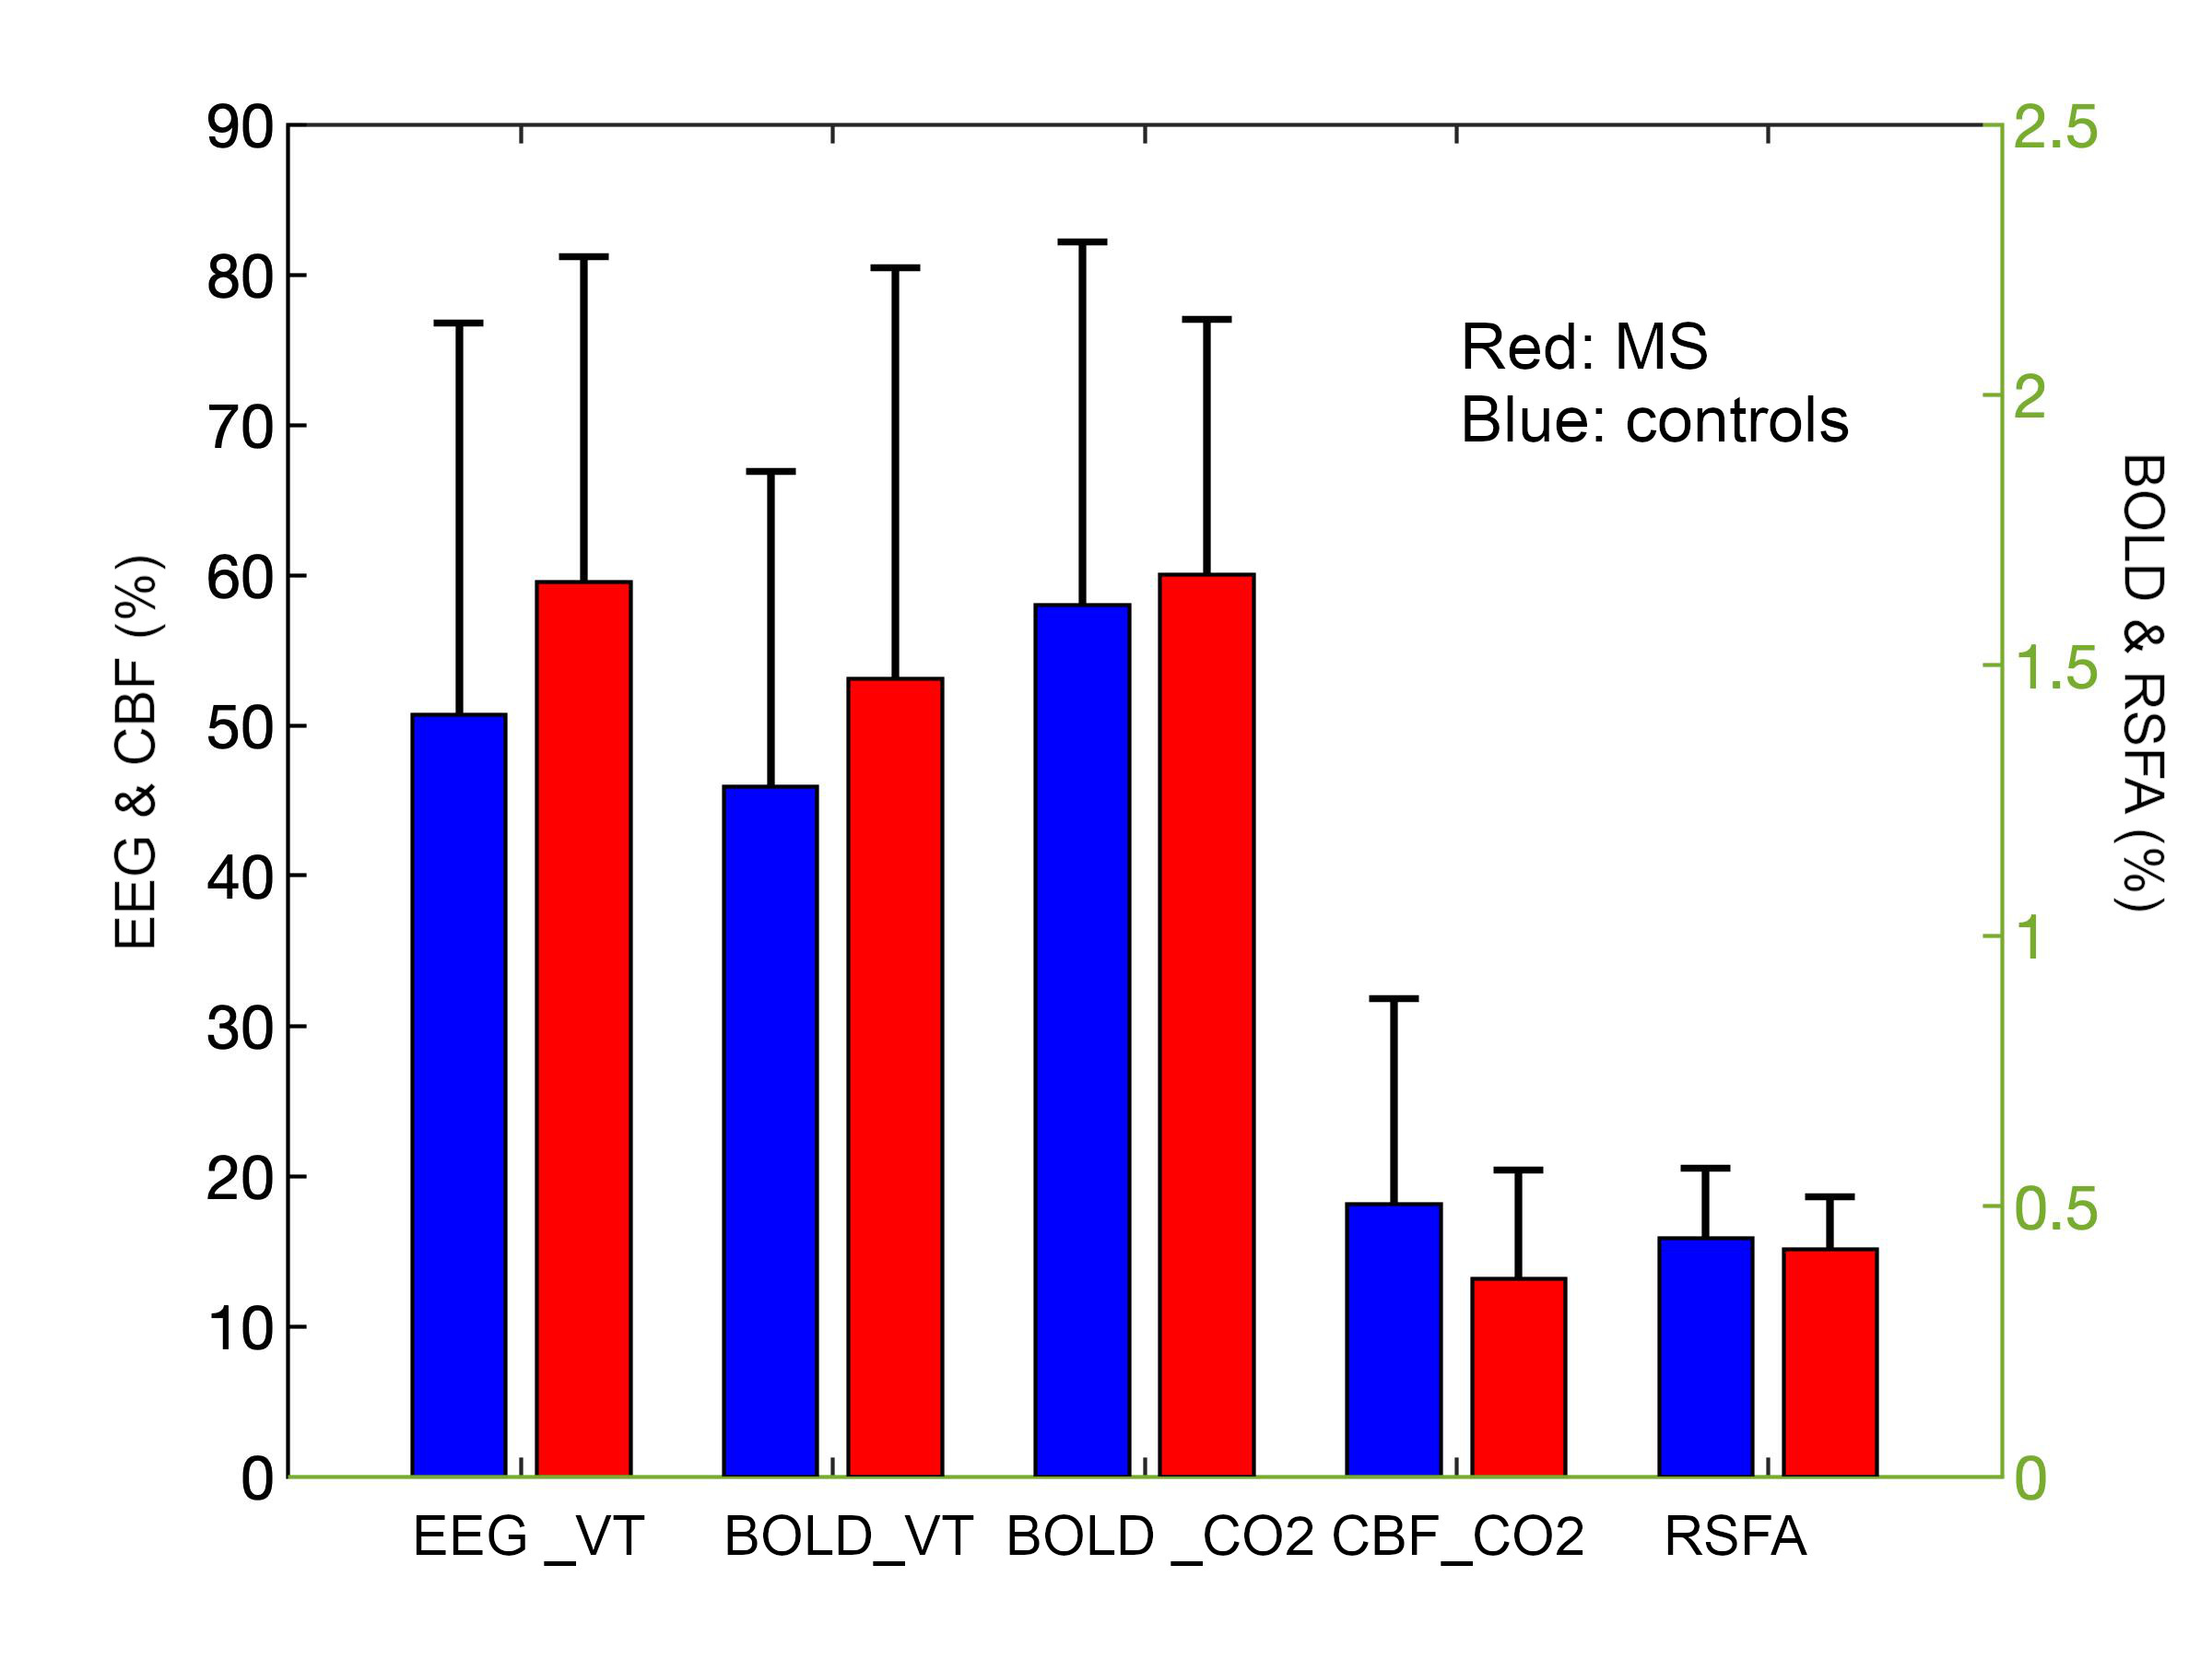
Approach: During the visual task and hypercapnia challenge, BOLD and CBF are measured simultaneously with EEG in patients of MS (n=11) and health controls (n=15).
Results: We find that, for healthy controls, only models that included neuronal activity, i.e. EEG power change during task performance, were significantly predictive of BOLD response
Impact: We investigate BOLD activation of MS patients and compare with controls using EEG simultaneously during a visual task and hypercapnia challenge. We find that the BOLD response in MS does not directly depend on the degree of underlying neuronal activity.
Introduction
Altered blood oxygenation level dependent (BOLD) activation has been reported in fMRI studies of multiple sclerosis (MS) patients in comparison to age and sex matched healthy control subjects 1-3. These altered findings are widely interpreted to be evidence of plasticity, or functional reorganization in response to the disease. However, it is also known that MS patients have impaired cerebral hemodynamics when compared to healthy controls 4-6. In this study, we assess the neuro-vascular coupling of MS patients and compare with age-matched normal-controls using EEG simultaneously during a simple visual task.Methods
Study Population: Eleven MS patients (age = 53±6 yo, 7 females) and 15 controls (53±9 yo, 9 females) satisfied the study inclusion criterion. Age and gender of two populations were not statistically different (p > 0.05).MRI Data collection: fMRI data were collected using a custom multi-slice (SMS) excited double echo pseudo-continuous tagging BOLD-arterial spin labeling sequence (TR=4s, TE=13.4ms/37ms, voxel size = 3.8x3.8x5mm3, 18 slices (MB=3), pseudo-continuous tagging = 1.5s, post labeling delay = 2s) 115 repetitions for visual task (VT) and 181 repetition hypercapnia (HC) condition scans 7. Four blocks (48s On/Off periods) of 4 Hz of flashing checkerboard was projected in the screen during two times of each SMS dual echo ASL scans. Five percent of CO2 mixed gas was delivered two times with 2 mins of periods.
MRI analysis: Cerebral blood flow (CBF) and BOLD contrasts were calculated from the first and second echoes of dual echo ASL scans. The region of interest (ROI) was defined using voxels activated with p < 0.01 using the perfusion weighted time series data during VT. The percent change in CBF and BOLD contrast during visual activation (_VT) and hypercapnia condition (_CO2) was calculated within the ROI. In addition, resting state (rs-)fMRI data were collected with a single shot EPI sequence (TR=2.8s, 2x2x4mm3, 31 slices, 132 volumes), and resting state fluctuation amplitude (RSFA) map was calculated following reference 8, and RSFA values within the activated ROI were averaged.
EEG acquisition and analysis: We acquired simultaneous EEG-fMRI using 64 channel electrodes. We recorded EEG both inside and outside the scanner during VT. We used template subtraction to remove MR gradient artifacts 9, then removed cardioballistic, eye blink, vibration, and residual scanner artifacts. We performed spectral decomposition of EEG_VT and estimated the normalized power changes at 4 Hz, compared to baseline.
Statistical analysis: We analyzed the relationship between signal change in BOLD_VT and other measures (BOLD_CO2, CBF_CO2, RSFA, EEG_VT) in both groups. Using a step-wise regression approach, different models were tested, progressively including all combinations of predictors (i.e. regressors) with age and gender. We report only statistically significant regression models (p<0.05).
Result
Age or gender does not predict BOLD_VT in either MS and control group. In 1 variable model, RSFA predicts BOLD_VT in control (p < 0.04) and CBF_CO2 predicts BOLD_VT in MS with p value = 0.034. In the following, predictors are listed in the parathesis with p value. In 2 variable model, (EEG_VT, BOLD_CO2, p = 0.019), (EEG_VT, CBF_CO2, p = 0.038) in control group; (EEG_VT, CBF_CO2, p = 0.01), (BOLD_CO2, CBF_CO2, p = 0.016), and (CBF_CO2, RSFA, p = 0.037) in MS. In 3 variable models, (EEG_VT, BOLD_CO2, CBF_CO2, p = 0.003) and (EEG_C, CBF_CO2, RSFA, p = 0.03) in controls; (EEG_VT, CBF_CO2, RSFA, p = 0.037) in MS. In all 4 variable model, BOLD_VT is predicted with p = 0.009 only in controlsDiscussion
We find that, for healthy controls, only models that included neuronal activity, i.e. EEG power change during task performance, were significantly predictive of BOLD response. Several of the models that included only vascular responses during hypercapnia or resting state were significantly predictive for BOLD response during task for MS. This supports our hypothesis of neurovascular uncoupling in MS.Conclusion
In this study, we present a linear regression model fitting of direct measures of neuronal response to task (EEG power), as well as MR-assessed measures of vascular response to task, hypercapnia challenge and resting state. We show that, in contrast to healthy control subjects, the BOLD response in MS does not directly depend on the degree of underlying neuronal activity.Acknowledgements
No acknowledgement found.References
1. Lowe MJ, Beall EB, Sakaie KE, et al. Resting state sensorimotor functional connectivity in multiple sclerosis inversely correlates with transcallosal motor pathway transverse diffusivity. Human brain mapping 2008;29:818-827.
2. Mainero C, Caramia F, Pozzilli C, et al. fMRI evidence of brain reorganization during attention and memory tasks in multiple sclerosis. Neuroimage 2004;21:858-867.
3. Wishart HA, Saykin AJ, McDonald BC, et al. Brain activation patterns associated with working memory in relapsing-remitting MS. Neurology 2004;62:234-238.
4. Brooks DJ, Leenders KL, Head G, Marshall J, Legg NJ, Jones T. Studies on regional cerebral oxygen utilisation and cognitive function in multiple sclerosis. J Neurol Neurosurg Psychiatry 1984;47:1182-1191.
5. Inglese M, Adhya S, Johnson G, et al. Perfusion magnetic resonance imaging correlates of neuropsychological impairment in multiple sclerosis. J Cereb Blood Flow Metab 2008;28:164-171.
6. Inglese M, Park SJ, Johnson G, et al. Deep gray matter perfusion in multiple sclerosis: dynamic susceptibility contrast perfusion magnetic resonance imaging at 3 T. Arch Neurol 2007;64:196-202.
7. Kim T, Shin W, Zhao T, Beall EB, Lowe MJ, Bae KT. Whole brain perfusion measurements using arterial spin labeling with multiband acquisition. Magn Reson Med 2013;70:1653-1661.
8. Kannurpatti SS, Rypma B, Biswal BB. Prediction of Task-Related BOLD fMRI with Amplitude Signatures of Resting-State fMRI. Frontiers in systems neuroscience 2012;6:7.
9. Allen PJ, Josephs O, Turner R. A method for removing imaging artifact from continuous EEG recorded during functional MRI. Neuroimage 2000;12:230-239.
Figures