2981
Normal appearing white matter and tracts in patients with multiple sclerosis: susceptibility properties and clinical disability evaluation1Department of Biomedical and Neuromotor Sciences, University of Bologna, Bologna, Italy, 2UOSI Riabilitazione Sclerosi Multipla, IRCCS Istituto delle Scienze Neurologiche di Bologna, Bologna, Italy, 3Functional and Molecular Neuroimaging Unit, IRCCS Istituto delle Scienze Neurologiche di Bologna, Bologna, Italy, 4Department for Life Quality Sciences, University of Bologna, Bologna, Italy, 5Department of Information and Electrical Engineering and Applied Mathematics, University of Salerno, Salerno, Italy, 6Department of Imaging, Cambridge University Hospitals NHS Foundation Trust, Cambridge, United Kingdom, 7Department of Radiology, University of Cambridge, Cambridge, United Kingdom, 8Investigative Medicine Division, Radcliffe Department of Medicine, University of Oxford, Oxford, United Kingdom, 9NOVA Information Management School, Universidade NOVA de Lisboa, Lisbon, Portugal
Synopsis
Keywords: Multiple Sclerosis, Multiple Sclerosis
Motivation: Magnetic susceptibility is influenced by myelin concentration, playing a significant role in the pathogenesis of MS as a demyelinating disease.
Goal(s): This study aims to investigate normal-appearing-white-matter in MS patients using QSM, focusing on the cortico-spinal tract and optic radiation, to find non-invasive biomarkers of pre-clinical inflammatory activity.
Approach: The automated implemented pipeline relies on the acquisition of multiple MR sequences. Several susceptibility histogram properties were considered and correlated with disability scores.
Results: A decrease in myelin concentration was detected in MS group, consistently with the pathophysiology. Correlations between susceptibility and clinical disability occur, distinguishing clinical phenotypes and levels of motor impairment.
Impact: Studying the normal-appearing-white-matter tracts using QSM reveals decrease in myelin concentration within cortico-spinal tract and optic radiation in MS patients. Variations were observed between different clinical phenotypes and various levels of motor impairment, suggesting biomarkers for early diagnosis and prognosis.
Background and aim
Quantitative susceptibility (χ) mapping (QSM)1 is an advanced MR technique sensitive to alterations in myelin and iron concentration2, involved in multiple sclerosis (MS) pathogenesis. MS is a chronic inflammatory and demyelinating disease3, and QSM has already been used in investigating MS lesions4 and brain structures like the thalamus, with susceptibility values being linked to clinical disability5. Since MS can affect the entire brain, analyzing the normal-appearing white matter (NAWM) could potentially yield valuable non-invasive imaging biomarkers, offering insights into pre-clinical inflammatory activity and aiding in early diagnosis6. In this study, we explored χ properties of NAWM and tracts – namely cortico-spinal tract (CST) and optic radiation (OR) – within a cohort of patients with MS, comparing their distribution to healthy controls (HC) and correlating with clinical disability scores.Materials and methods
The study sample included 102 patients with MS (F:M 58:44, 47.2±8.4 years old), meeting the Mac Donald diagnostic criteria (60 relapsing-remitting, 29 primary progressive, 13 secondary progressive) and undergoing Anti-CD20 therapies, and 50 HC (F:M 31:19, 60.1 ± 6.3). The brain MR protocol (3T Siemens Magnetom Skyra, whole-body transmit and head/neck 64-channel receiver coil) included: morphological T1w (3D-MPRAGE, TR/TE=2300/2.98 ms, 1x1x1 mm3) and T2w (3D-FLAIR, TR/TE/TI=5000/428/1800 ms, 1x1x1 mm3), DWI (2D-EPI HARDI single-shot, TR/TE = 4300/98 ms, 2x2x2 mm3) and QSM (3D-GRE T2*w, nTEs=5, TR/TE/ΔTE=53/9.42/9.42 ms, 0.5x0.5x1.5 mm3).To reconstruct χ maps, raw phase maps were processed by Laplacian unwrapping, V-SHARP background removal, weighted-sum for echo combination and iLSQR for dipole inversion7. Cerebro-spinal fluid was considered as reference tissue, using an original atlas-based method to select atrium, interior horns and central part8 inside the lateral ventricles. An automated diffusion and tractography processing pipeline was used9 to reconstruct CST and OR. The MRtrix3 (https://www.mrtrix.org/) tool 5ttgen was used to segment WM tissue and the LPA algorithm from LST (https://www.applied-statistics.de/lst.html) for automatic MS lesion segmentation, to exclude the lesioned parenchyma from the analyzed Volume-Of-Interest (VOI) (NAWM, CST, OR) (Fig.1).
For each VOI, considering left and right hemispheres individually, mean, median, 10th and 90th percentile χ were extracted and comparison analysis was carried out. ANCOVA was used, considering sex, age and total intracranial volume as covariates of no-interest (p-value * <.008). Χ histogram properties were correlated (Spearman’s test, p-value * <.05) with Expanded Disability Status Scale (EDSS) scores. EDSS is divided into 8 functional systems (FS), among which there is the Pyramidal one, measuring muscle weakness and difficulty in moving limbs. Patient handedness, measured with the Oldfield’s test, was considered.
Results and discussion
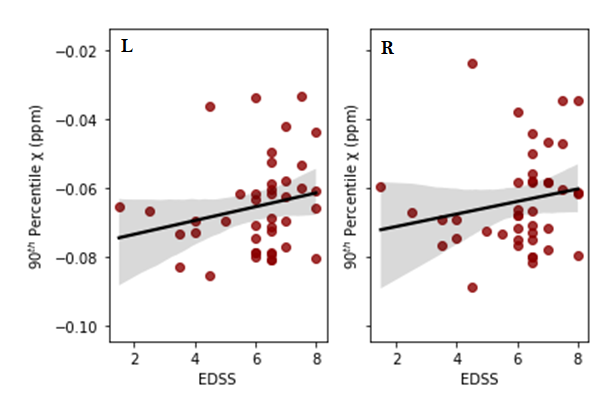
All the χ measurements resulted significantly higher in the MS group with respect to HC in all the VOI; in WM tissue, higher χ values correspond to lower myelin concentration. P-values in NAMW, as representative area, were (L/R): .0002/.0002 mean, .0003/.0003 median, .0018/.008 10th-percentile and .0001/.0002 90th-percentile (Fig.2). A significant positive correlation occurred between CST 90th-percentile and EDSS total score (L: ρ=0.301, p-value=.002; R: ρ=0.242, p-value=.014) and EDSS FS pyramidal (L: ρ=0.243, p-value=.013; R: ρ=0.200, p-value=.044). The asymmetry between the two sides may be explained considering that ~82% of patients are right-handed (0.5<Oldfield's test≤1), and therefore the alterations may be more evident on the contro-lateral side (Fig.3).Significant differences held comparing controls with progressive patients (NAWM p-values [L/R]: .0053/.0061 mean, .0072/.0062 median, .0189/.0106 10th-percentile and .0022/.0095 90th-percentile) (Fig. 4). Additionally, the correlation between CST 90th-percentile and EDSS remained true in the left side (ρ=0.377, p-value=.014), with higher slope than in the entire MS group (Fig. 5). Susceptibility increase in the relapsing-remitting group vs control, but not significantly.
Considering that FS-pyramidal=4 is recognized as the threshold between high and low pyramidal impairment, CST χ values showed significant correlations in patients with FS-pyramidal<4 and not in those with a higher score, suggesting that the link between susceptibility and disability occurs before a certain level of impairment.
Conclusion and future work
The current study shows how the analysis of susceptibility measures in the normal-appearing white matter and cortico-spinal tracts and optic radiation leads to the distinction between healthy controls and patients with multiple sclerosis, in particular in patients with primary and secondary progressive clinical phenotypes. The increased susceptibility values in the patient group correspond to a reduction in the concentration of myelin in the structures analyzed2, consistent with the study of the pathophysiology. In the analysis, a link between susceptibility and clinical disability scores is highlighted, distinguishing with respect to the clinical phenotype and motor impairment.In future work, we will pursue a radiomic approach following previously implemented and validated pipeline10, to better exploit the quantitative nature of QSM sequence and develop characterizers and predictors of the course of the pathology.
Acknowledgements
No acknowledgement found.References
1. A. Deistung, F. Schweser and J.R. Reichenbach. Overview of quantitative susceptibility mapping. NMR Biomed. 2017;30(4):e3569
2. S. Hamatner, V. Endmayr , A. Deistung et al.The influence of brain iron and myelin on magnetic susceptibility effective transverse relaxation – A biochemical and histological validation study. Neuroimage. 2018;179:117-133
3. D.S. Reich, C.F. Lucchinetti and P.A. Calabresi. Multiple Sclerosis. N Engl J Med. 2018;378(2):169-180
4. M. Marcille, S.H. Rúa, C. Tyshkov et al..Disease correlates of rim lesions on quantitative susceptibility mapping in multiple sclerosis. Sci Rep. 2022;12(1):4411
5. R. Zivadinov, E. Tavazzi, N. Bergsland et al. Brain Iron at Quantitative MRI Is Associated with Disability in Multiple Sclerosis. Radiology. 2018;289(2):487-496
6. F.F. Yu, F.L. Chiang, N. Stephens et al. Characterization of normal-appearing white matter in multiple sclerosis using quantitative susceptibility mapping in conjunction with diffusion tensor imaging. Neuroradiology. 2019;61(1):71-79
7. W. Li, N. Wang, F. Yu et al..A method for estimating and removing streaming artifacts in quantitative susceptibility mapping. Neuroimage. 2015;108:111-222
8. S. Straub, T.M. Schneider, J. Emmerich et al. Suitable reference tissues for quantitative susceptibility mapping of the brain. Magn Reson Med. 2017;78(1):204-214
9. L. Talozzi, C. Testa, S. Evangelisti et al. Along-tract analysis of the arcuate fasciculus using the Laplacian operator to evaluate different tractography methods. Magn Reson Imaging. 2018;54:183-193
10. C. Fiscone, L. Rundo, A. Lugaresi et al. Assessing robustness of quantitative susceptibility-based MRI radiomic features in patients with multiple sclerosis. Scientific Report 2023;13:16239
Figures
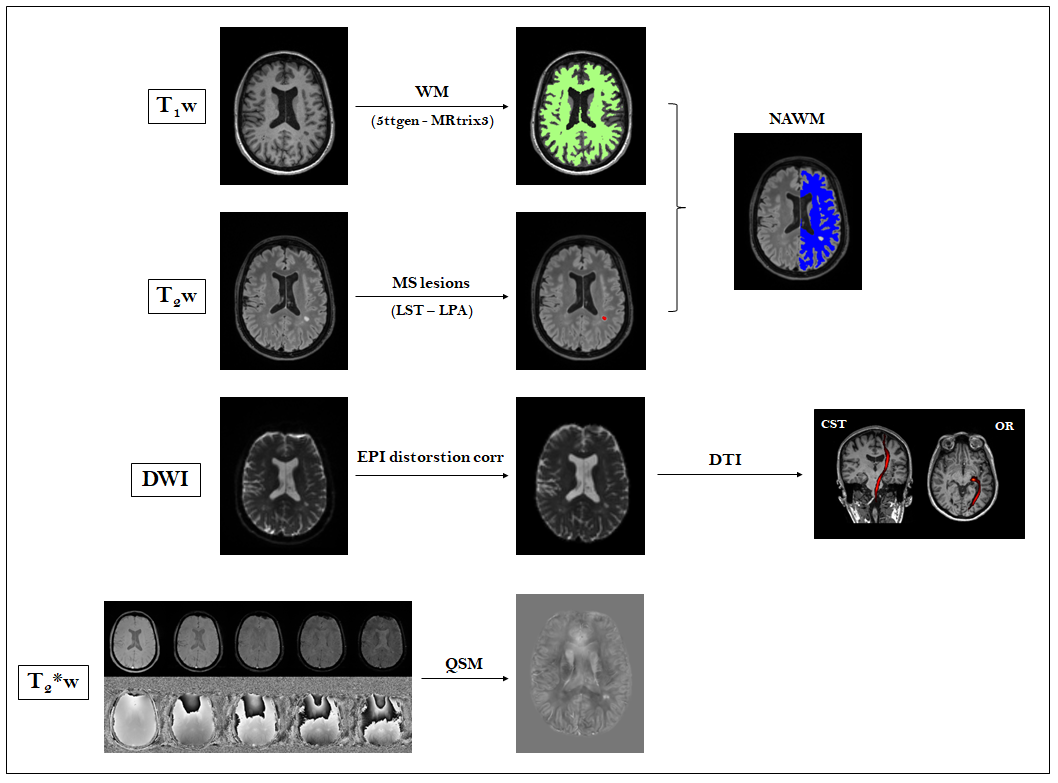
Figure 1: Acquisition and processing pipeline. The MRI protocol provided: 1) T1w used to obtain white matter segmentation (5ttgen from MRtrix3); 2) T2w, processed with LPA algorithm from LST to obtain MS lesion and, consequently, the normal-appearing-white matter mask; 3) DWI images, pre-processed and undergone a diffusion tractography imaging automated pipeline, to obtain the cortico-spinal tract and the optic radiation; 4) T2*w images, processed to reconstruct QSM. Images of a representative subject are shown (patient with MS, F/38 years old)
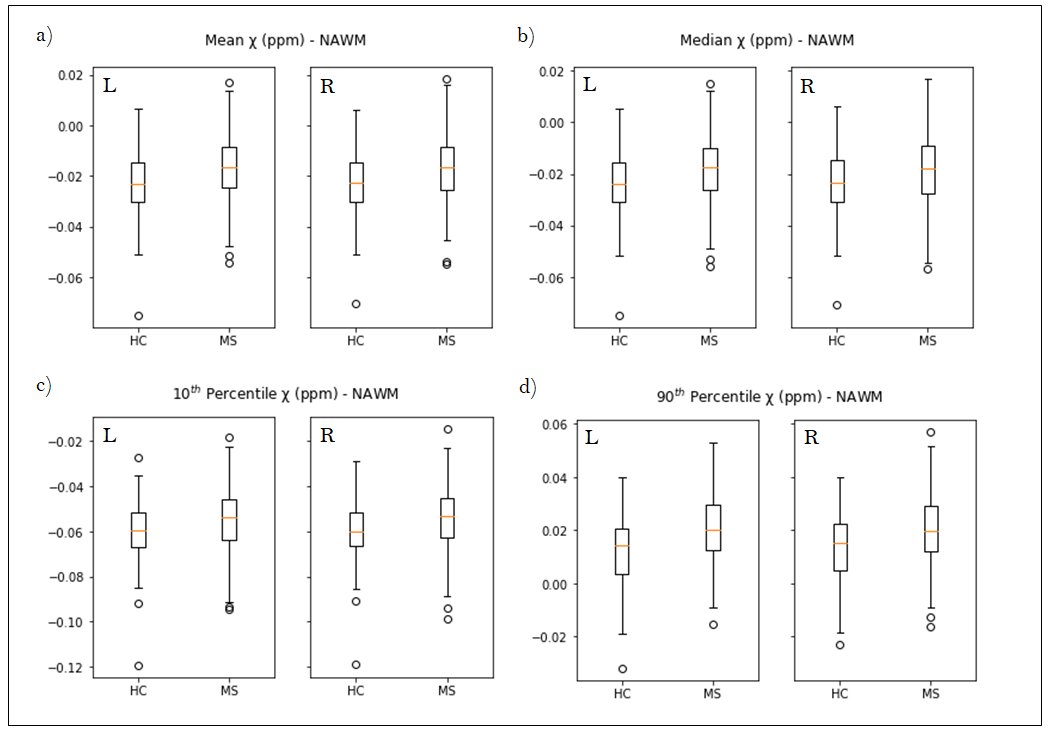
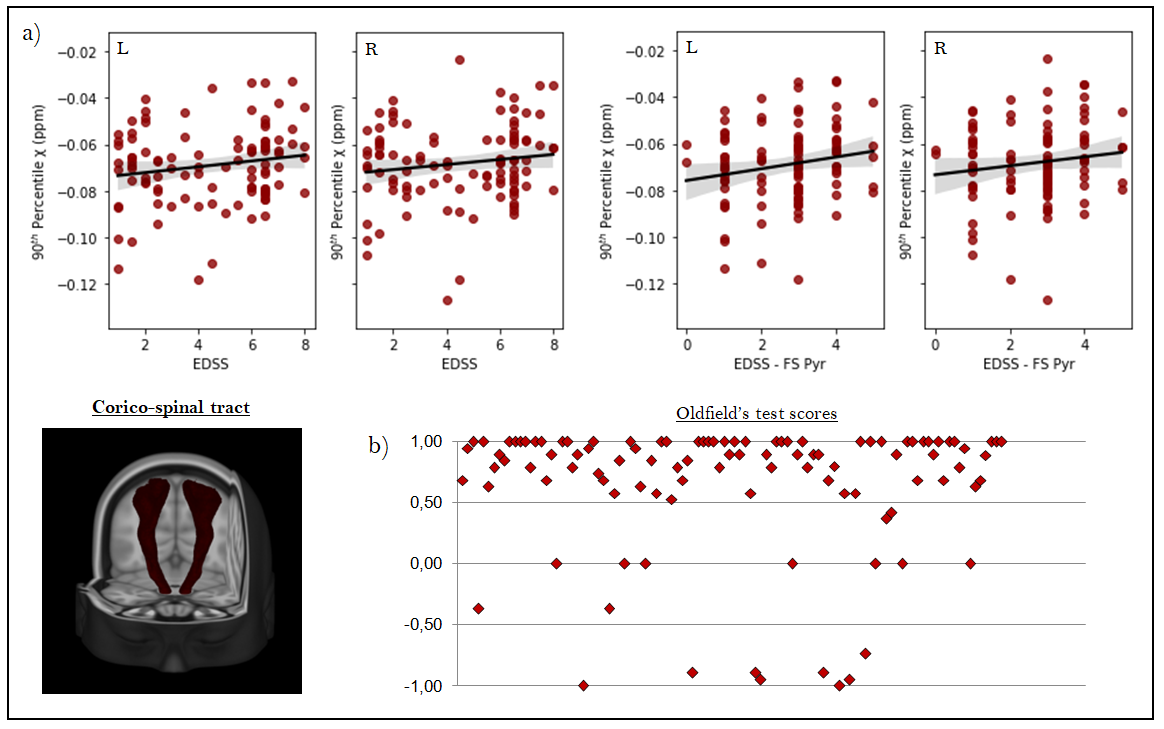
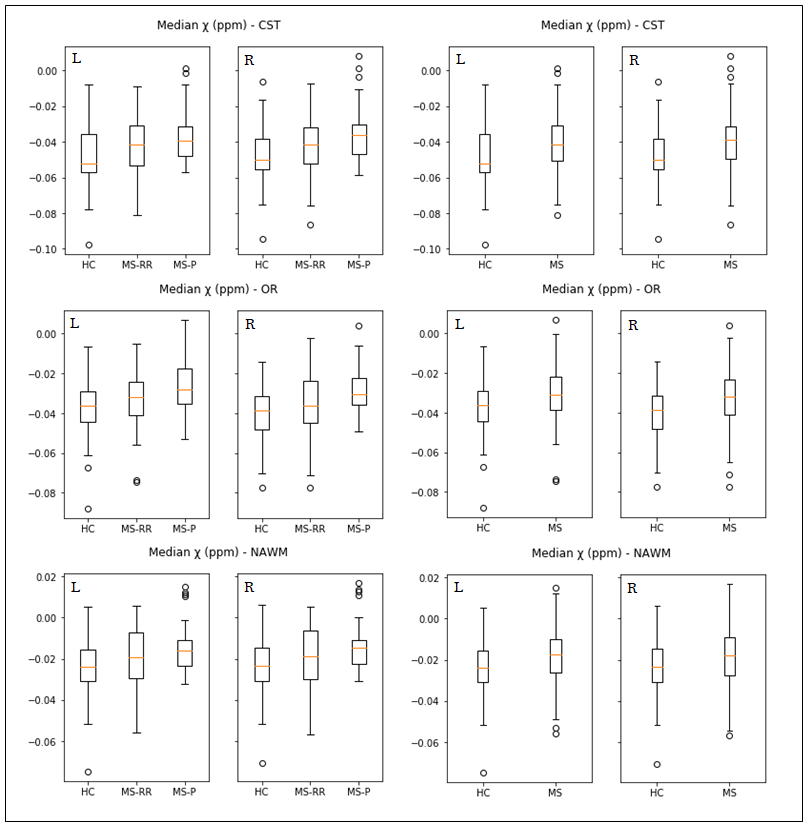
Figure 4: Bar plots of χ distributions (ppm) of the cortico-spinal tract, the optic radiation and the normal appearing white matter, comparing healthy controls and all MS patients, on the right, and distinguishing relapsing-remitting (RR) and primary and secondary progressive (P), on the left. ROI-based analysis was performed; ANCOVA was, using age, sex and total intracranial volume as covariates. It is noteworthy an increase of susceptibility values, corresponding to decrease in myelin concentration, from healthy controls to relapsing-remitting to progressive.